REVISION DATE: 12-Dec-2016 15:04:16
The files below are the darks and background collected during the lastest in-water tests, these are from an automated program . Darks and backgrounds where collected in groups of 3. 3 backgrounds, 3 dark, 5 lites (not shown), 3 dark and 3 backgrounds and then the process is repeated a second time. See the file numbering below. The first data set is for the Lu tracks only, the second data set is for the Es, Ed and Lu data.
The files I am calling darks where taken with the camera shutter closed and external shutter open. Backgournd files where collected with the camera shutter open and the external shutters closed. /
File numbers for the data sets collected
1  Background
2  Background
3  Background
4  Dark
5  Dark
6  Dark
7  Signal - Lu tracks only
8  Signal - Lu tracks only
9  Signal - Lu tracks only
10 Signal - Lu tracks only
11 Signal - Lu tracks only
12 Dark
13 Dark
14 Dark
15 Background
16 Background
17 Background
%--------------------------------
18 Background
19 Background
20 Background
21 Dark
22 Dark
23 Dark
24 Signal - Es, Ed and Lu Tracks
25 Signal - Es, Ed and Lu Tracks
26 Signal - Es, Ed and Lu Tracks
27 Signal - Es, Ed and Lu Tracks
28 Signal - Es, Ed and Lu Tracks
29 Dark
30 Dark
31 Dark
32 Background
33 Background
34 Background
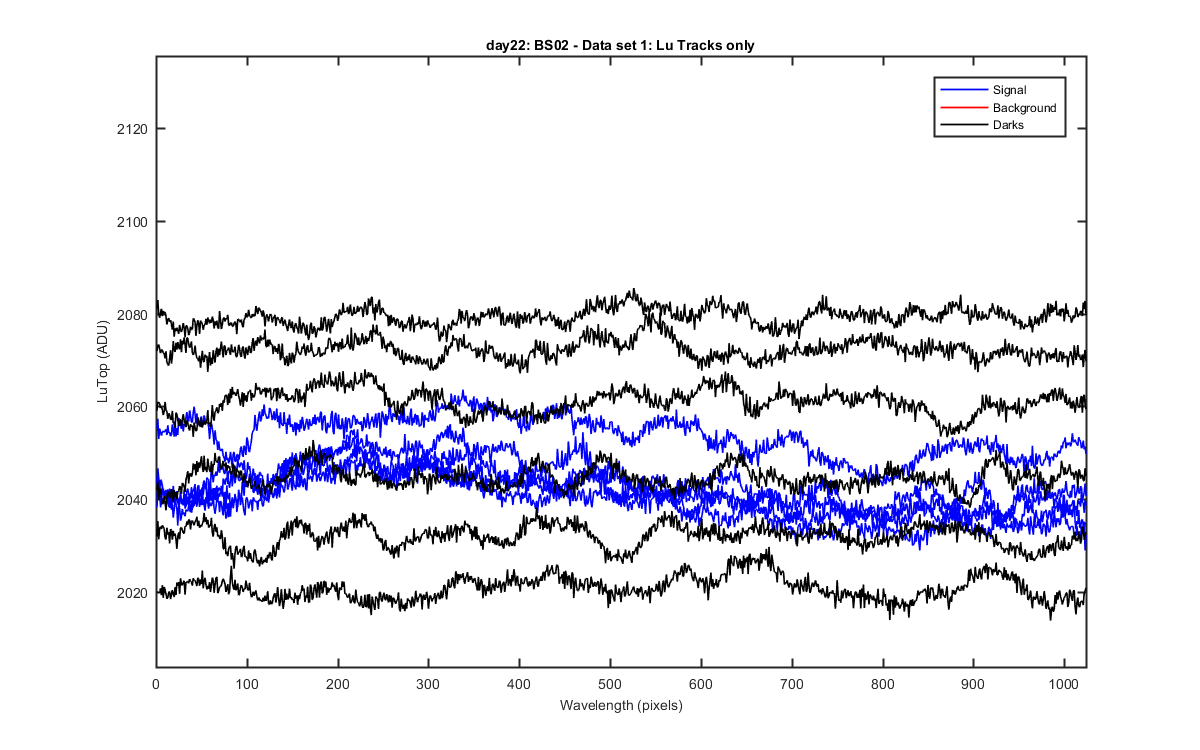
Data set 1 LuTop data and the darks and backgrounds taken before and after the data set. The darks and background vary quite a bit and both have sine waves in them. Some are also too high for the light scans. The temperature was stable at -40C during data collection so why are the darks changing so much with time? PS: the darks where taken closes in time to the lites so those will be used to subtract from the lites to get a net
Figure 1
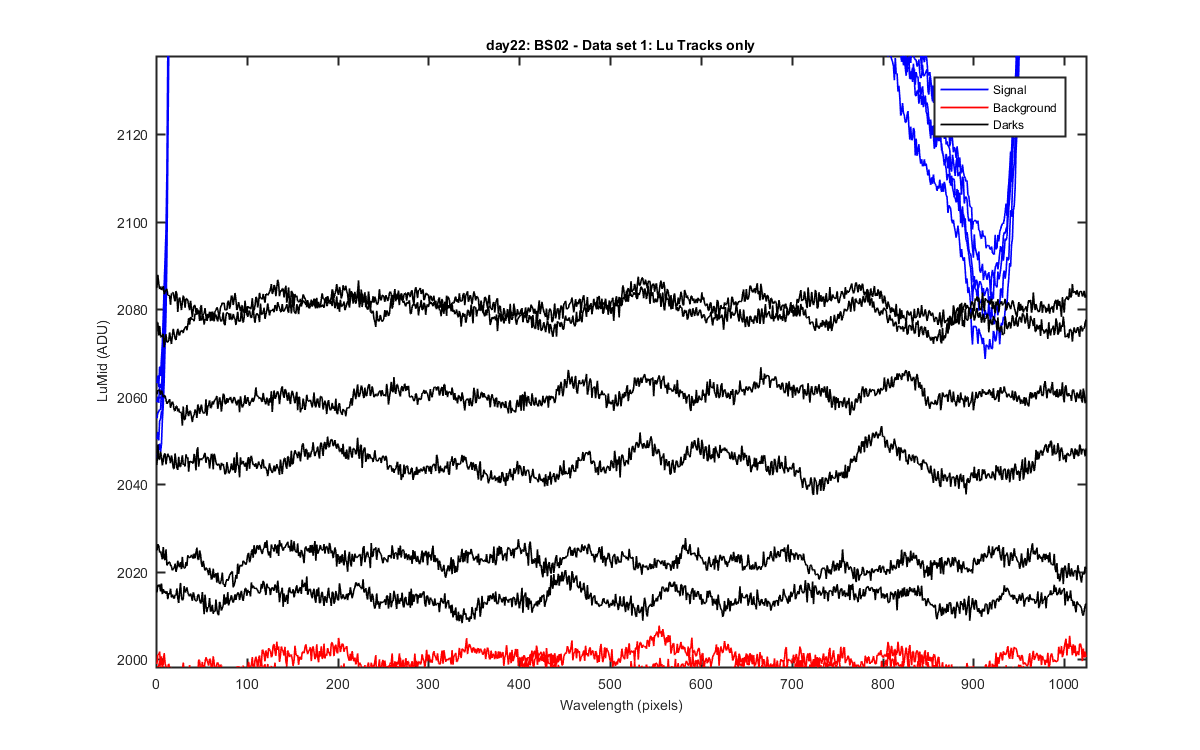
Data set 1 LuMid data and the darks and backgrounds taken before and after the data set. The darks and background vary quite a bit and both have sine waves in them. Some are also too high for the light scans. The temperature was stable at -40C during data collection so why are the darks changing so much with time? PS: the darks where taken closes in time to the lites so those will be used to subtract from the lites to get a net
Figure 2
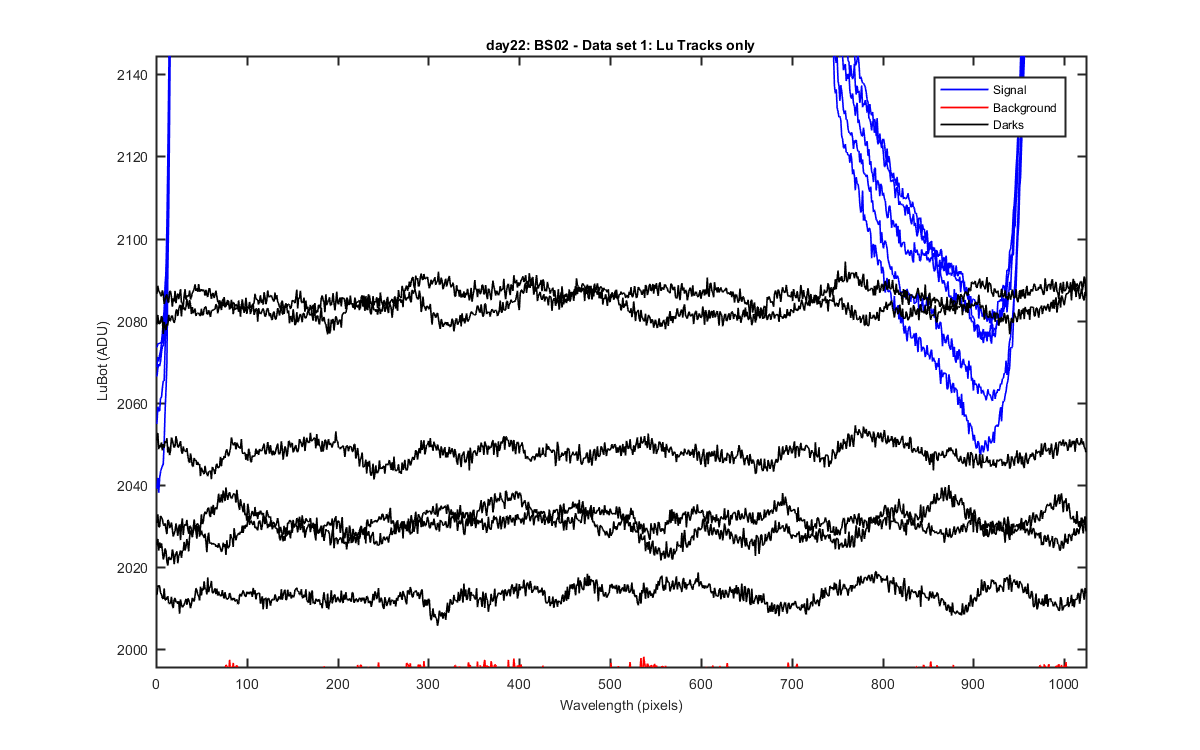
Data set 1 LuBot data and the darks and backgrounds taken before and after the data set. The darks and background vary quite a bit and both have sine waves in them. Some are also too high for the light scans. The temperature was stable at -40C during data collection so why are the darks changing so much with time? PS: the darks where taken closes in time to the lites so those will be used to subtract from the lites to get a net
Figure 3
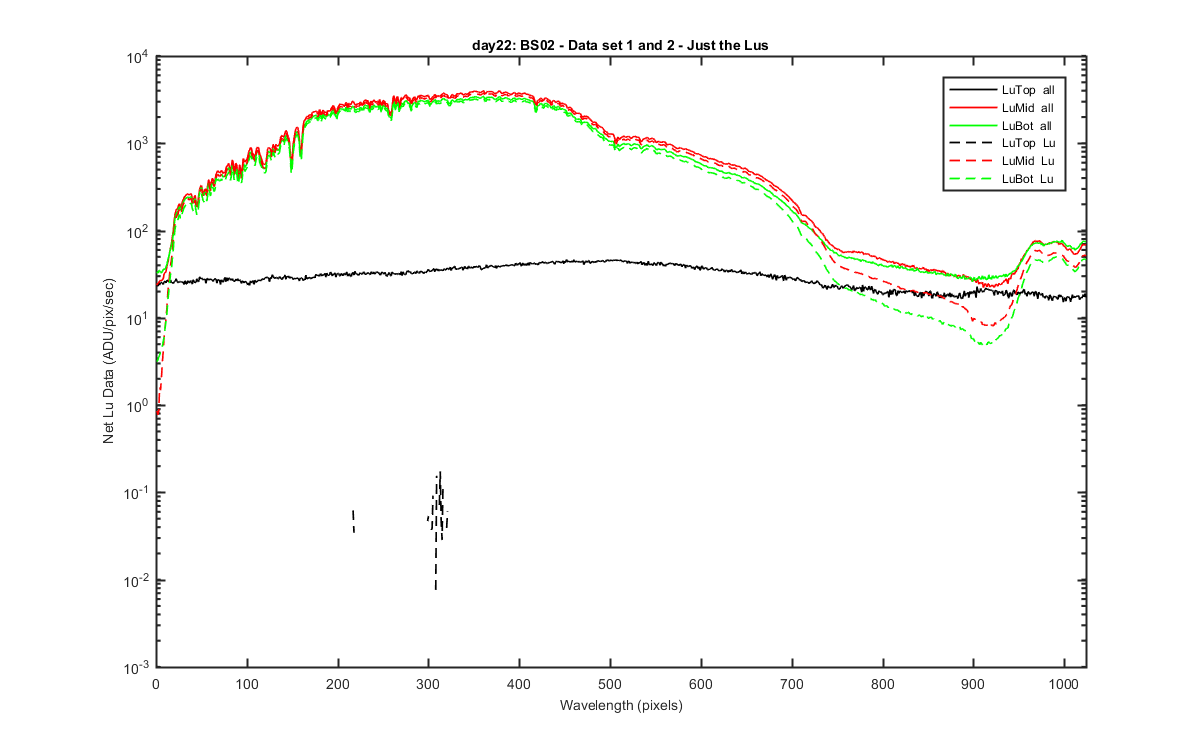
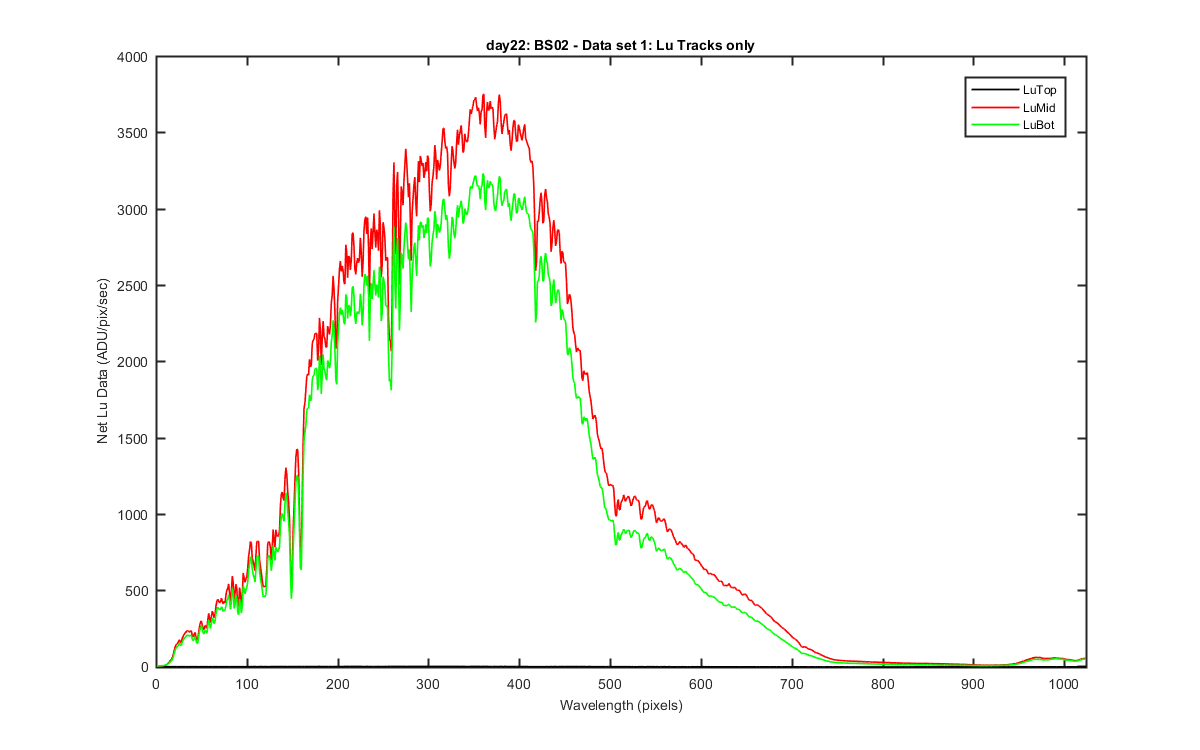
Net signal for each Lu. By net I mean an average of the 5 lites for data set 1 and the 6 darks taken before and after the lites. These where each meaned and then subtracted from each other and divided by int time.
Figure 4
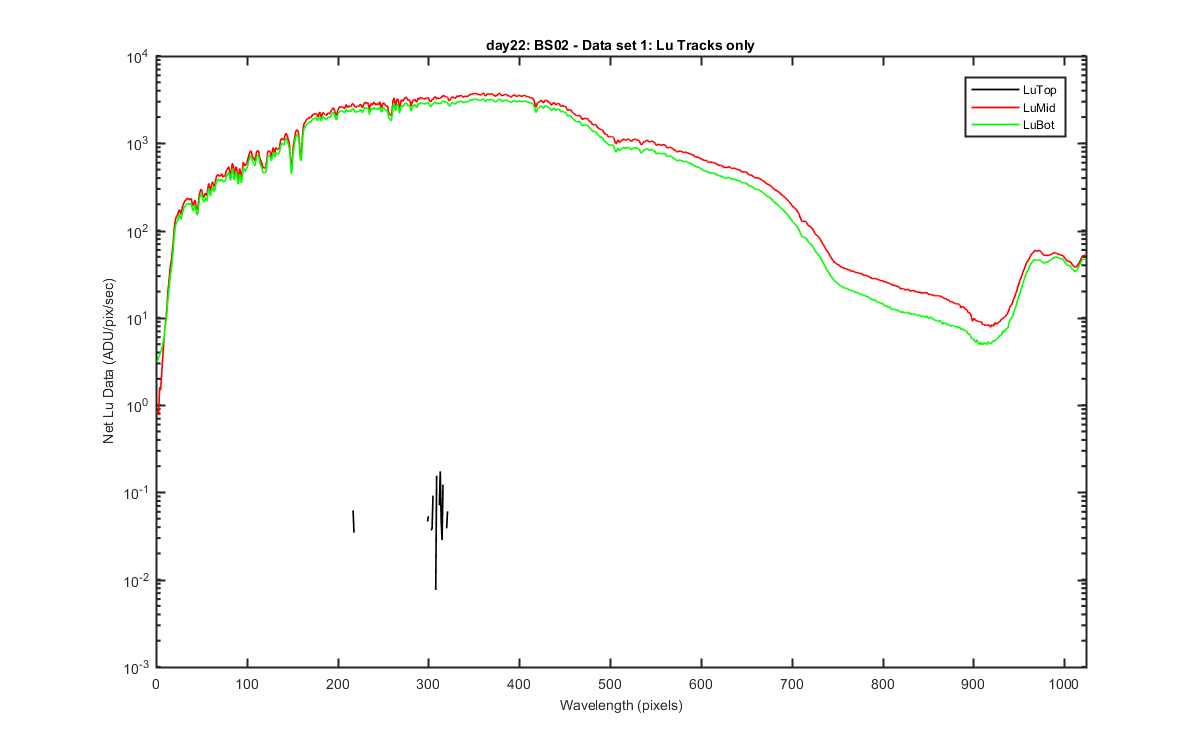
Logged version of the Net data.
Figure 5
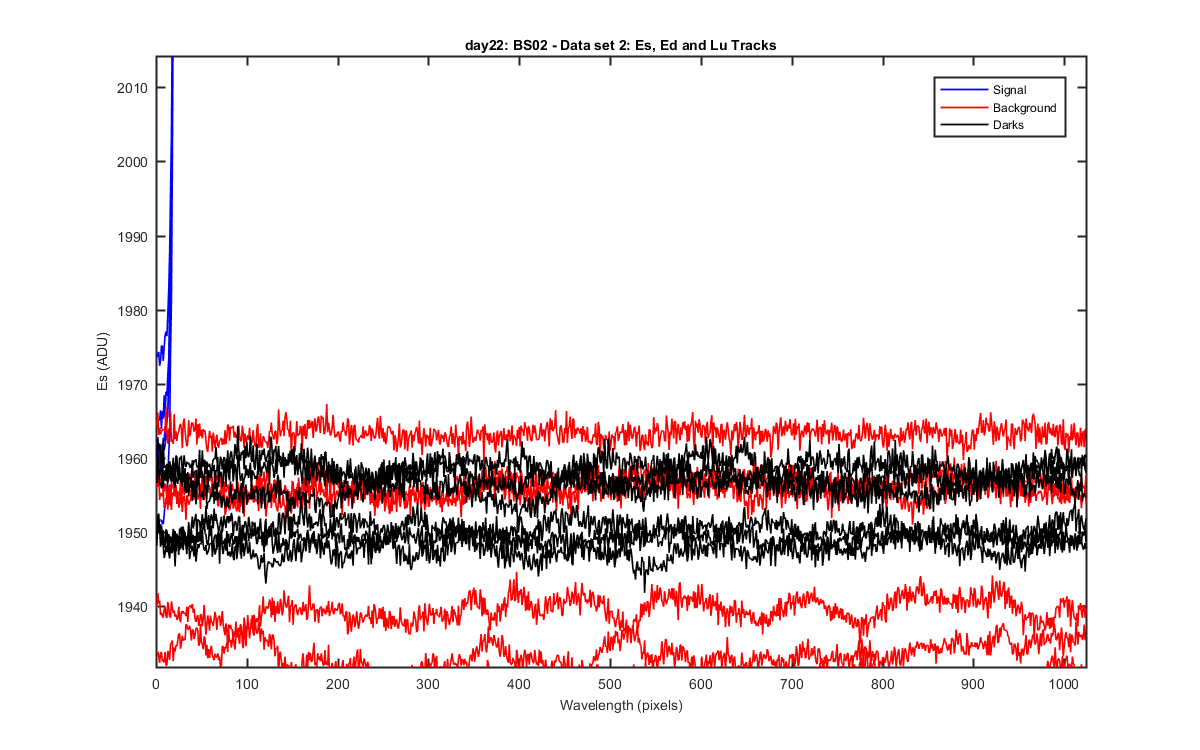
Data set 2 Es data and the darks and backgrounds taken before and after the data set. These are more stable because the ccd has been on longer??? I used the darks for subtraction on these data sets as well.
Figure 6
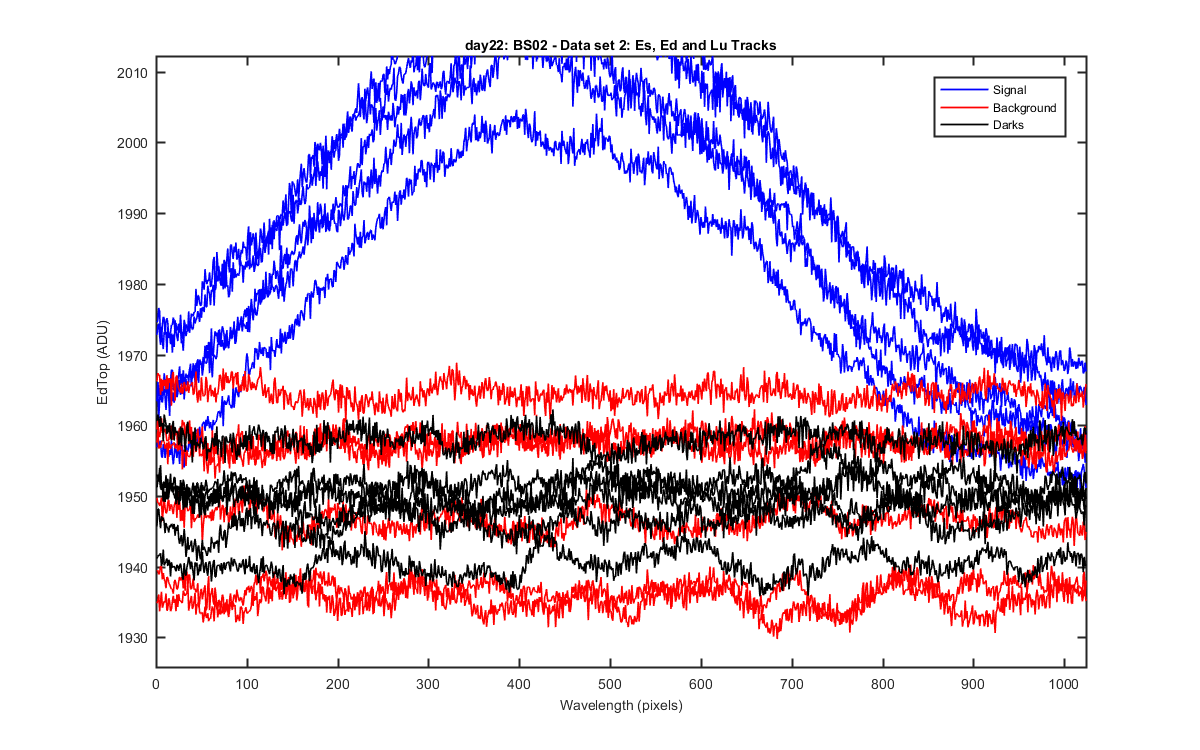
Data set 2 EdTop data and the darks and backgrounds taken before and after the data set. These are more stable because the ccd has been on longer??? I used the darks for subtraction on these data sets as well.
Figure 7
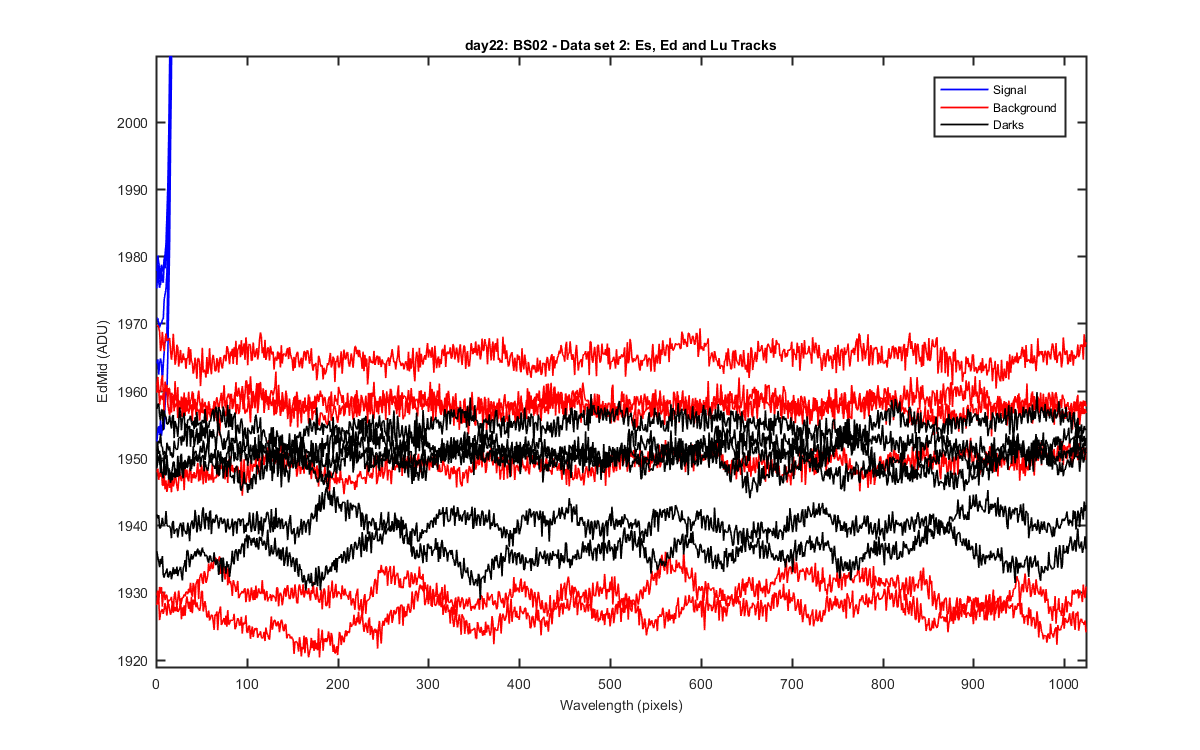
Data set 2 EdMid data and the darks and backgrounds taken before and after the data set. These are more stable because the ccd has been on longer??? I used the darks for subtraction on these data sets as well.
Figure 8
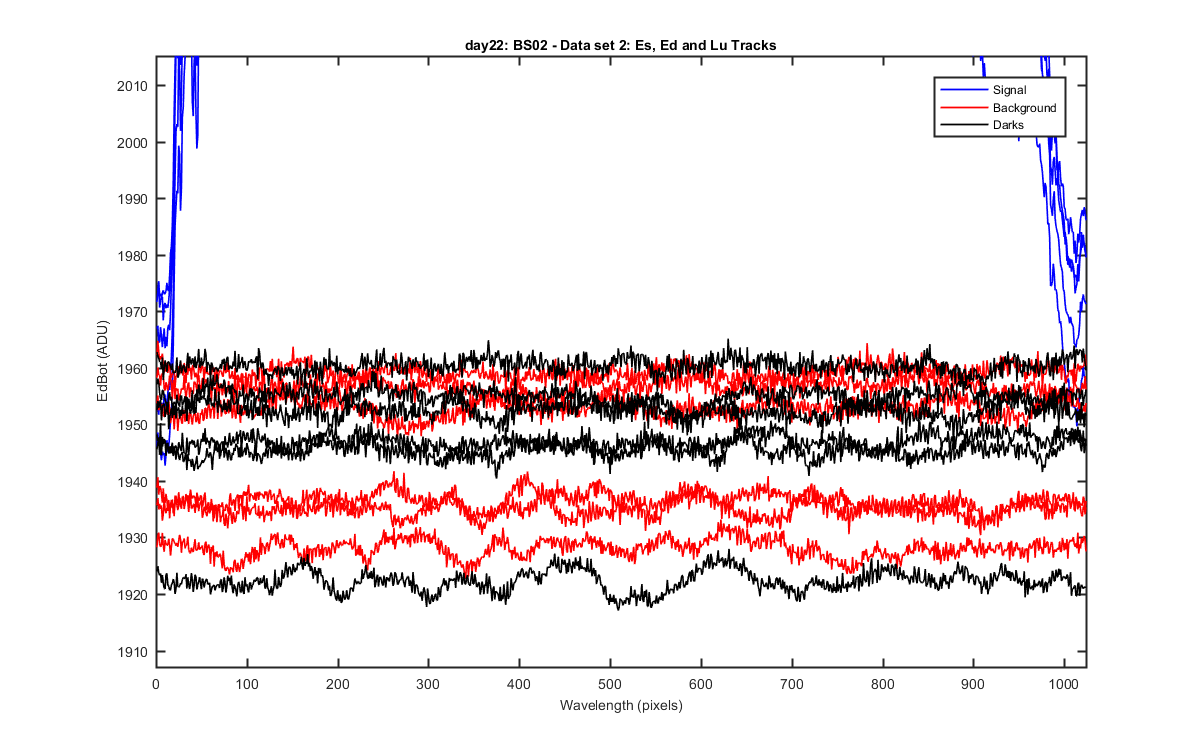
Data set 2 EdBot data and the darks and backgrounds taken before and after the data set. These are more stable because the ccd has been on longer??? I used the darks for subtraction on these data sets as well.
Figure 9
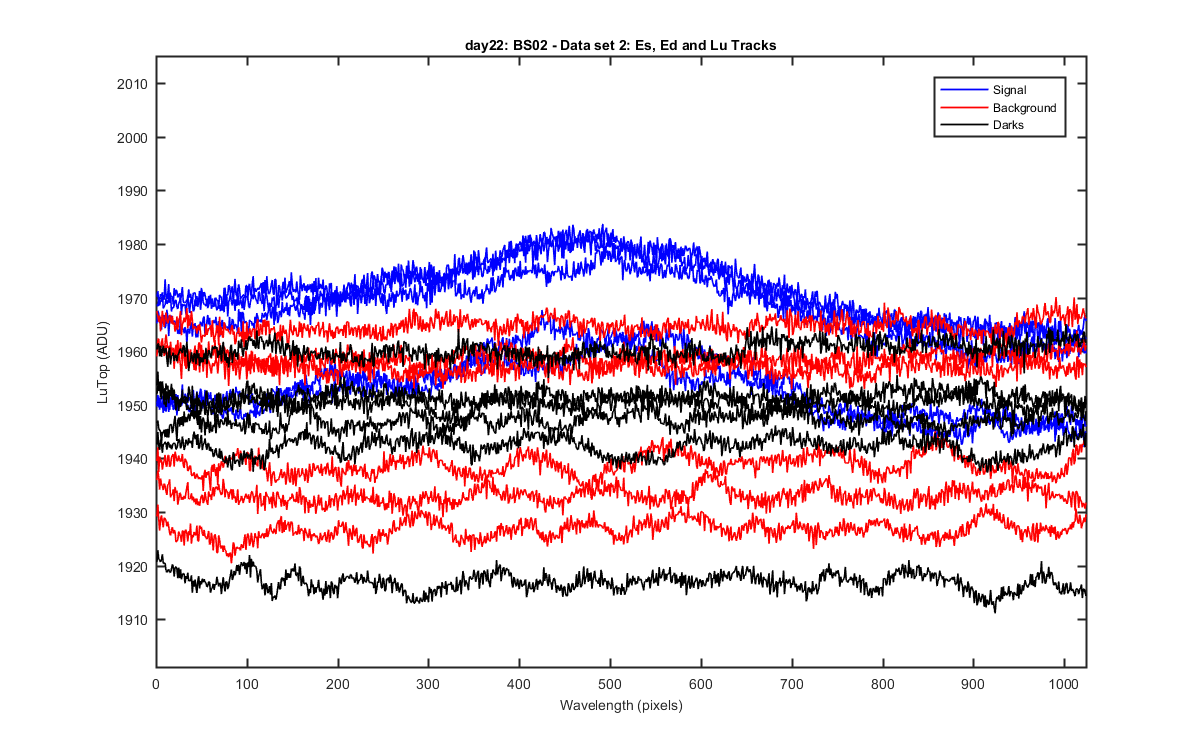
Data set 2 LuTop data and the darks and backgrounds taken before and after the data set. These are more stable because the ccd has been on longer??? I used the darks for subtraction on these data sets as well.
Figure 10
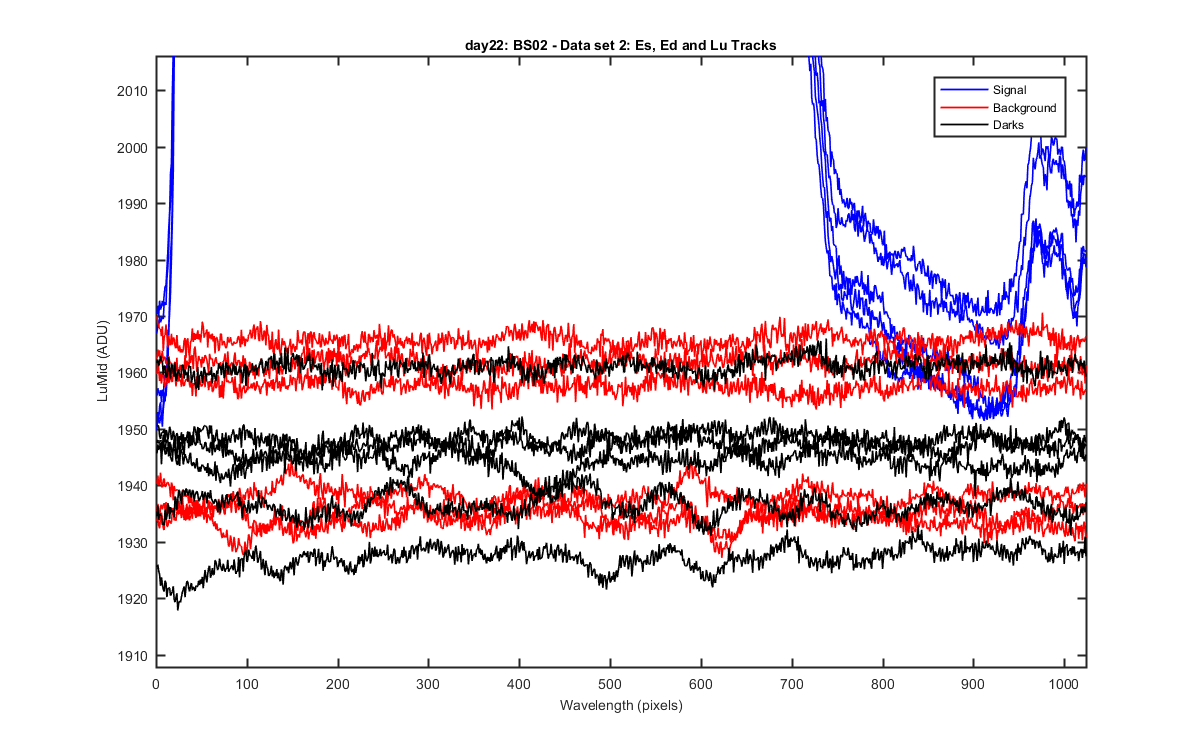
Data set 2 LuMid data and the darks and backgrounds taken before and after the data set. These are more stable because the ccd has been on longer??? I used the darks for subtraction on these data sets as well.
Figure 11
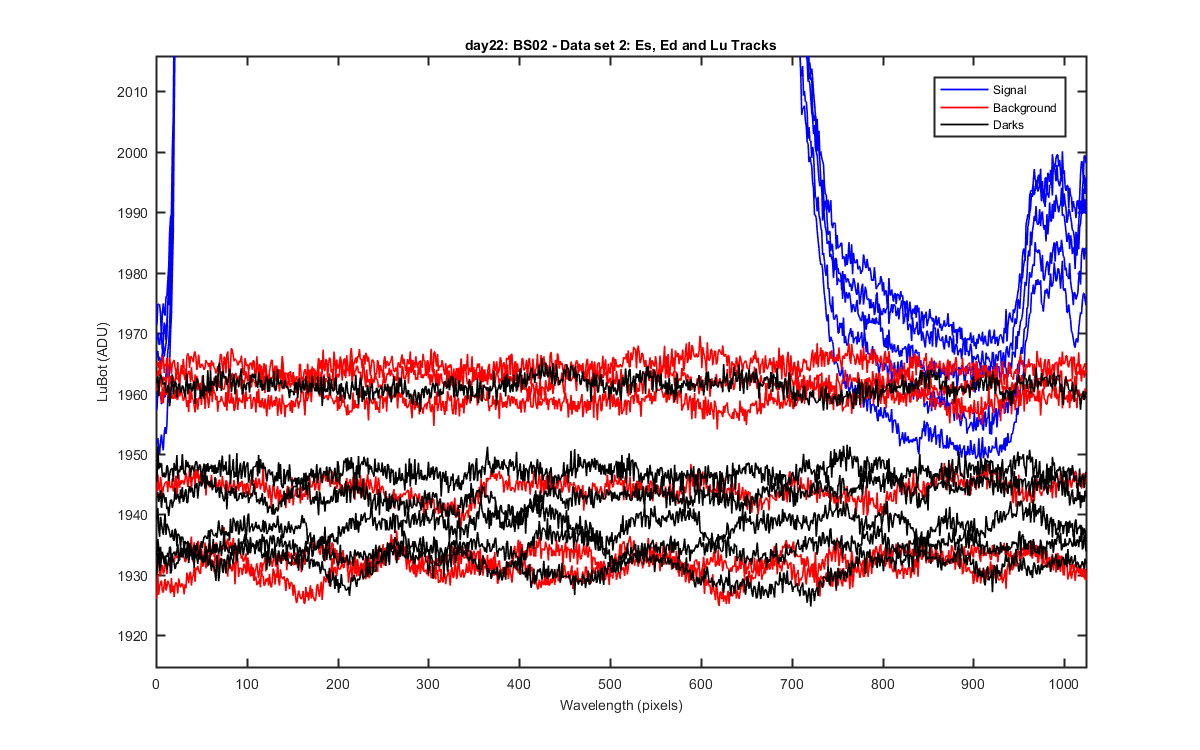
Data set 2 LuBot data and the darks and backgrounds taken before and after the data set. These are more stable because the ccd has been on longer??? I used the darks for subtraction on these data sets as well.
Figure 12
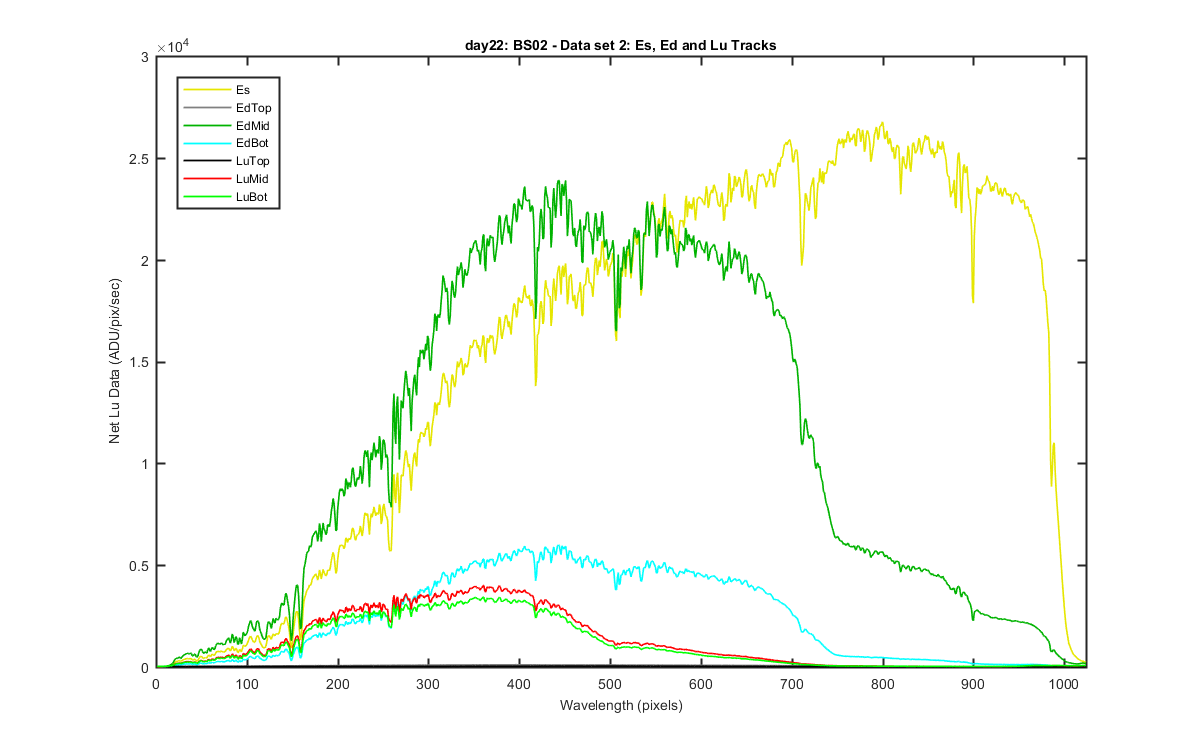
Net signal for each Es, Ed and Lu in data set 2. By net I mean an average of the 5 lites for data set 1 and the 6 darks taken before and after the lites. These where each meaned and then subtracted from each other and divided by int time.
Figure 13
Logged version of the Net data for data set 2.
Figure 14
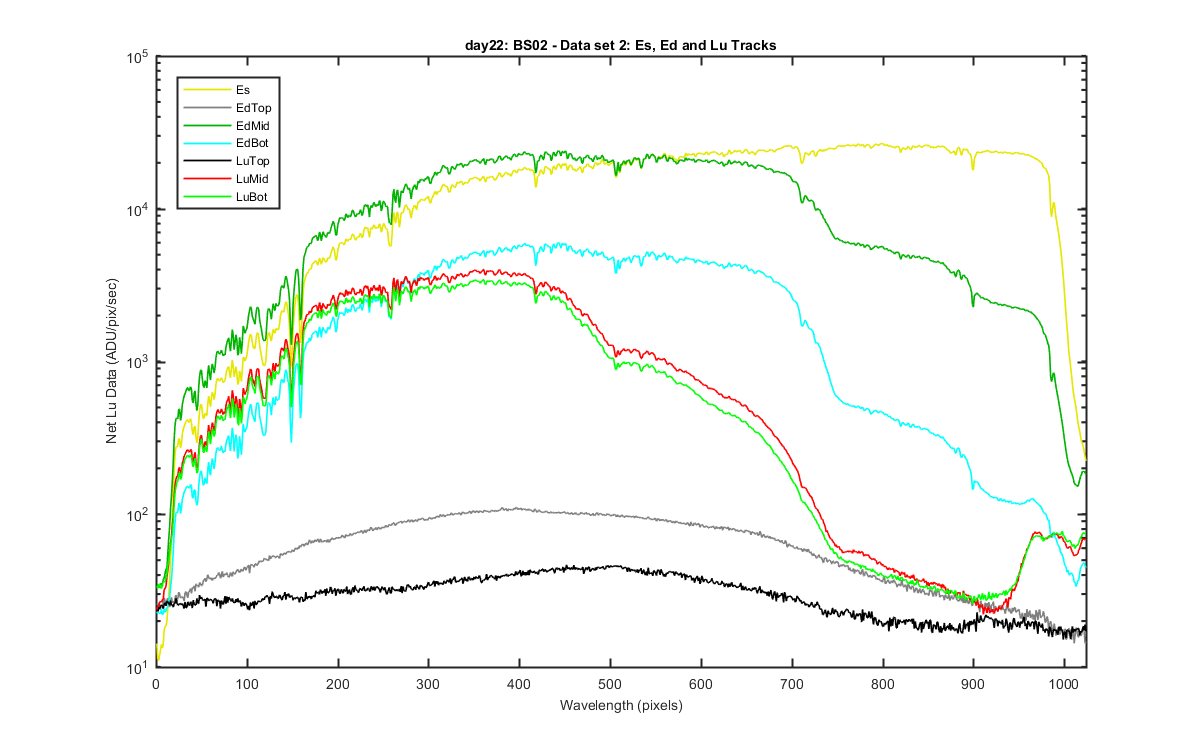
Figure 15
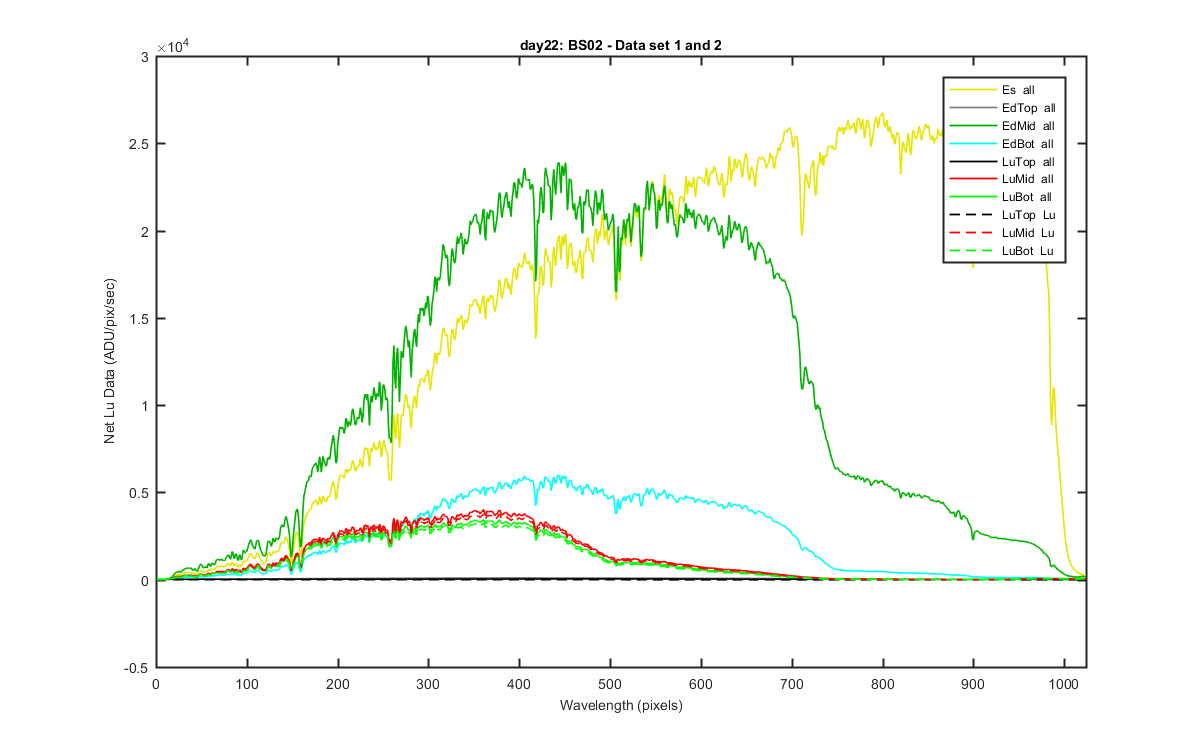
Figure 16
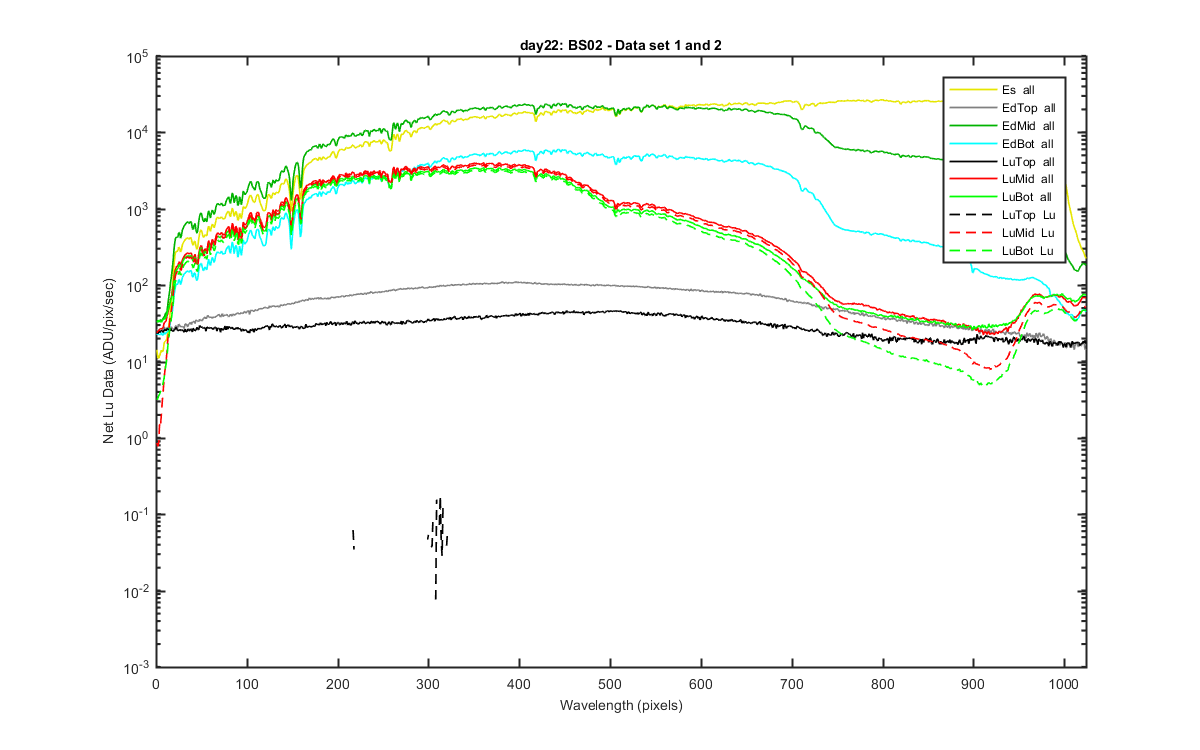
Figure 17