REVISION DATE: 18-Sep-2017 13:03:37
Looks at track movement for in-water data collected so far, the is no data from before deployment so we can not compare that. This is only for the tracks with light on them so the unused tracks are not included. For each file and track I normalized the track to its max value and plotted this for each file. Then I found where the right and left edge of each track crossed the 50% line. These track positions are plotted on the right panel below. I removed track with the shutters closed and tracks that where saturated (if any).
Ken asked: "when the tracks move, do they move evenly (all with the same delta) or does it vary? Do the track widths stay constant?" So I added a track width graph at the bottom that is normalized to the mean of the track width so you can compare the track width changes of all the tracks on one graph. The mean Track width is in the legend.
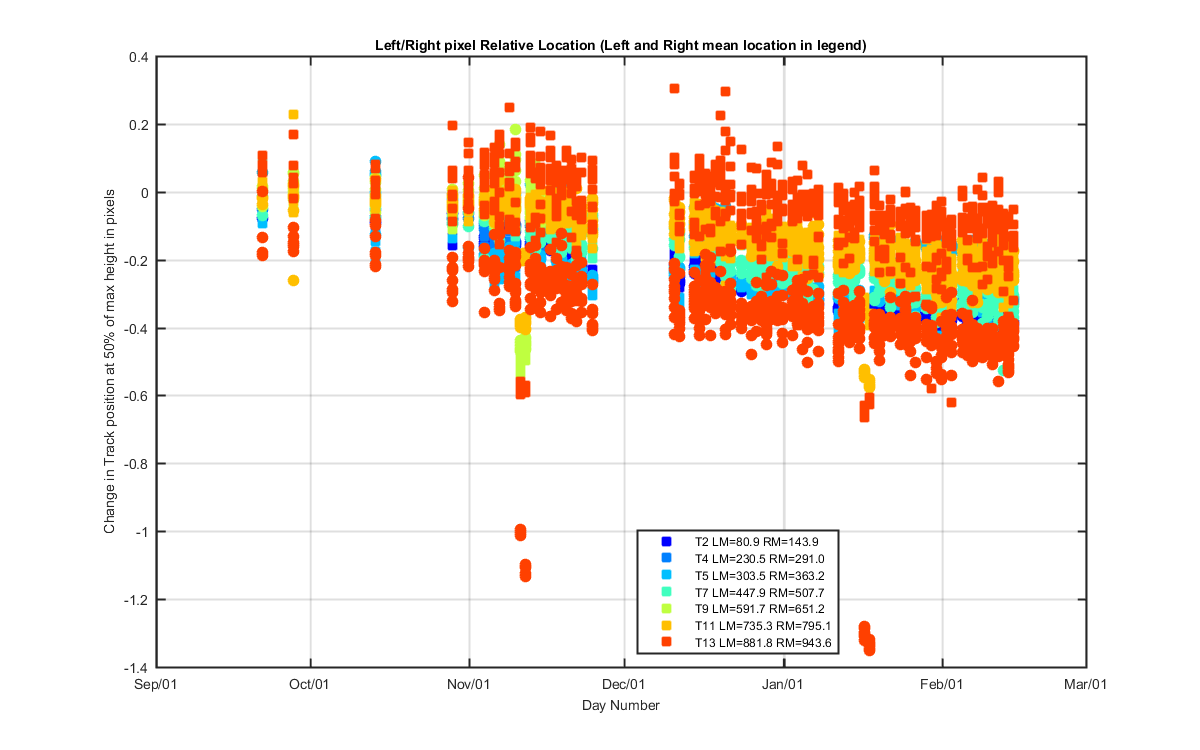
And I added a similar graph for the track left and right edges to show the relative change in position On 19 Jan 2017 I fixed the program so the data is not normalized by each day and track but just by track. This graphs makes more sense.
Figure 1
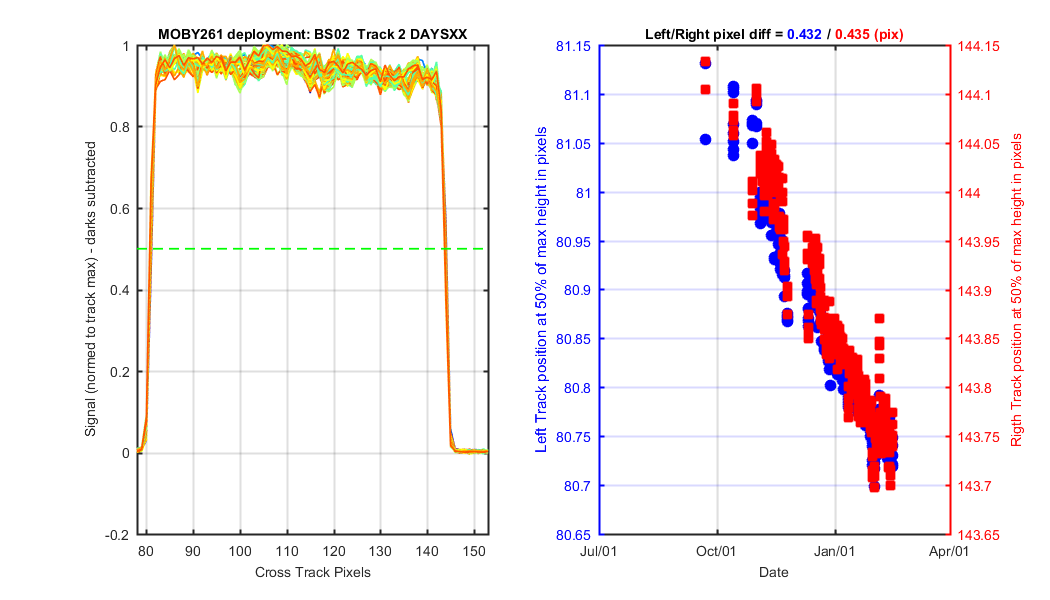
Figure 2
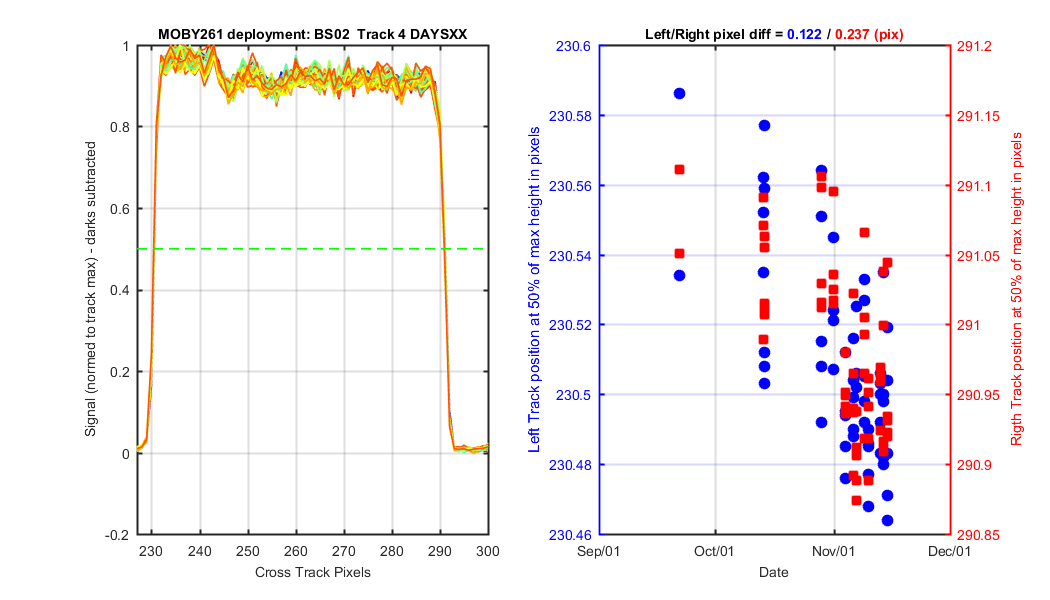
Figure 3
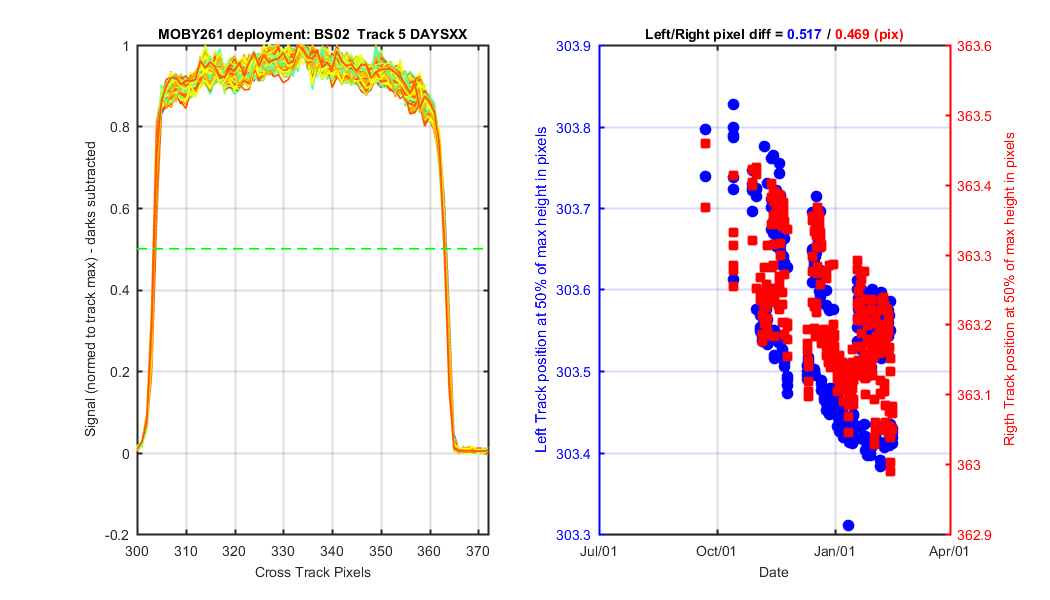
Figure 4
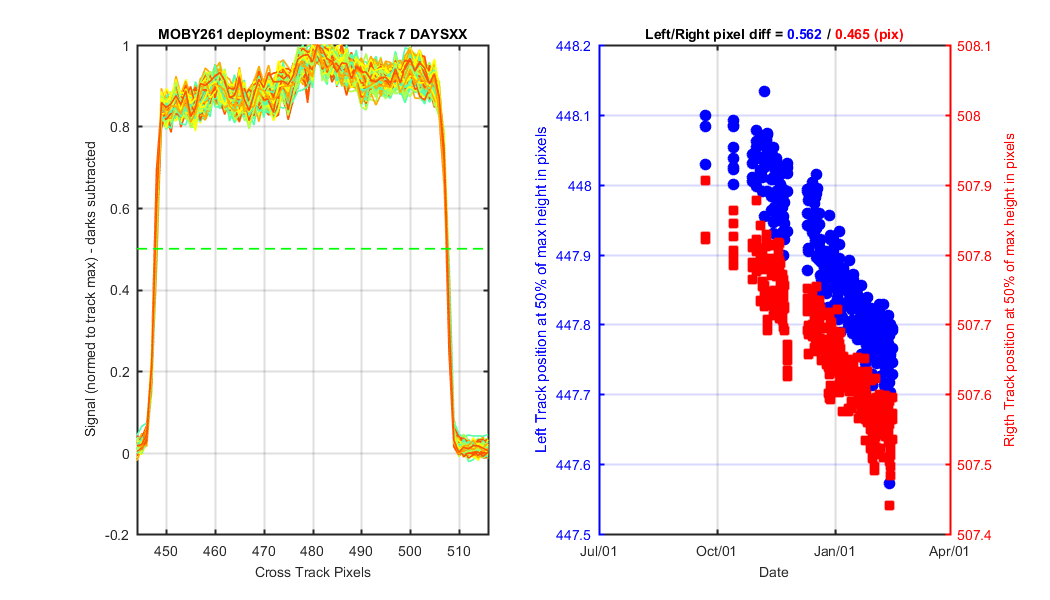
Figure 5
Figure 6
Figure 7
Figure 8