REVISION DATE: 31-Oct-2017 13:45:04
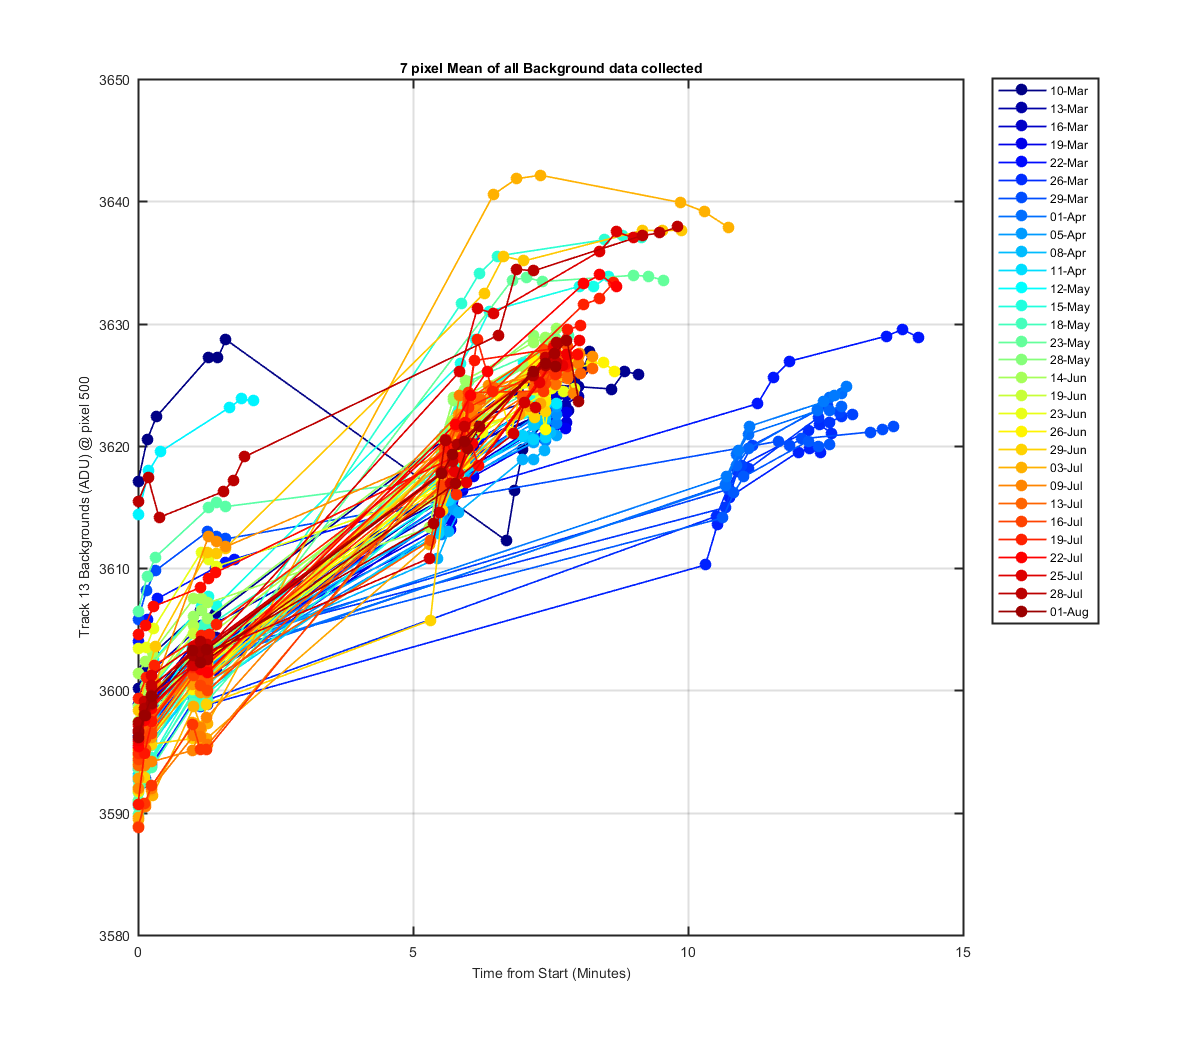
The in-water data time series backgrounds. This shows all the backgrounds collected from all the in-water data. A 7 pixels mean was calculated for each background, day, track, and pixel. A standard deviation was also calculted.
The 7 pxiels mean for each of the tracks with a sensor attached plotted against the time since the first data set in the file. This allows you to see the change in the darks during in-water data collection. The blue/green lines which extend out past 10 minutes was and experiment. Once the camera said it was stable, Art added a 5 minute pause to data collection to see if letting the camera settle a little more would affect the darks. Seems like it only starts the darks a little lower but the increase is the same.
Figure 1
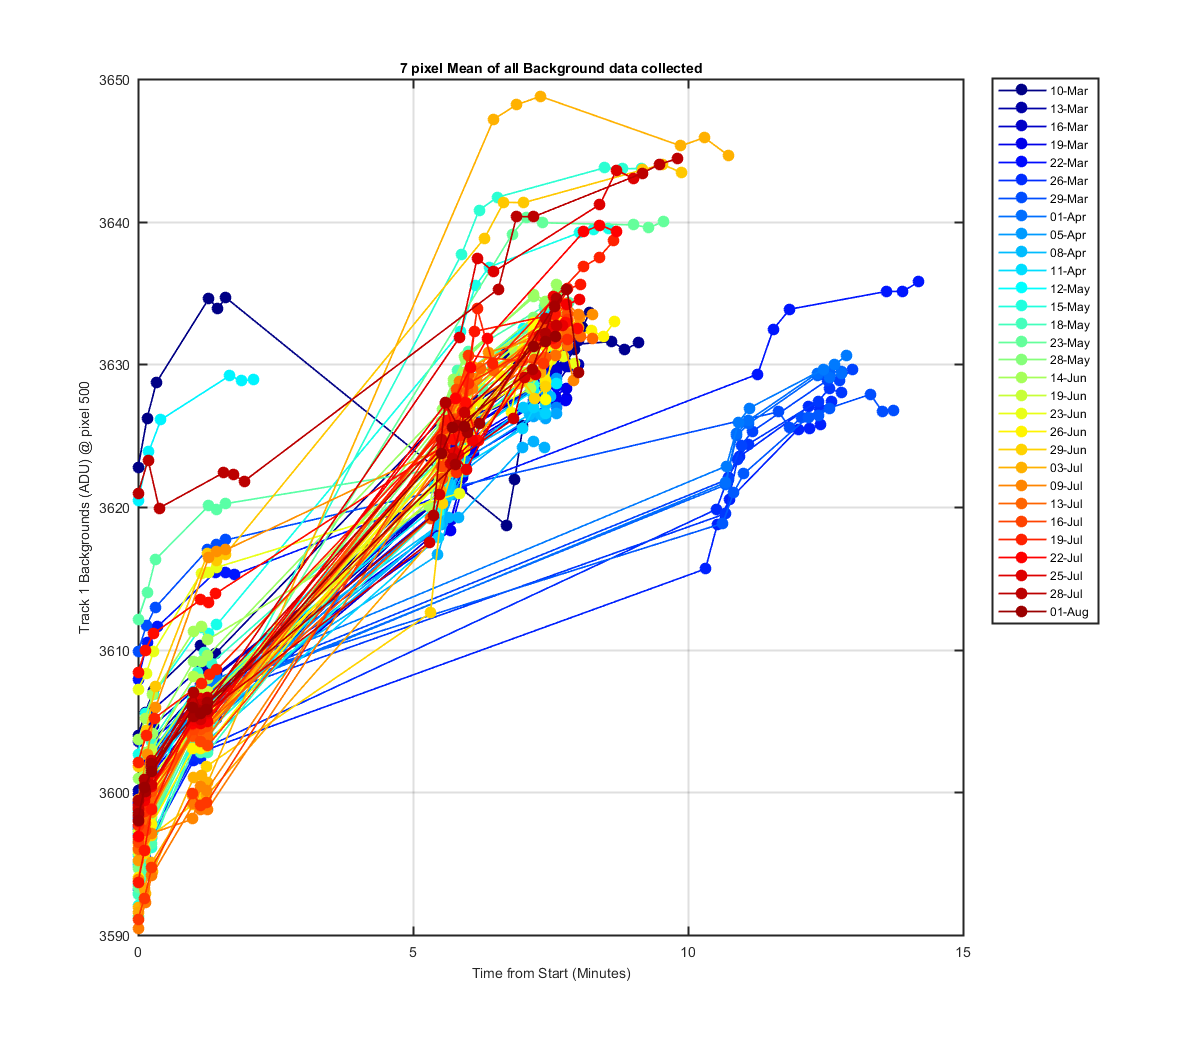
Figure 2
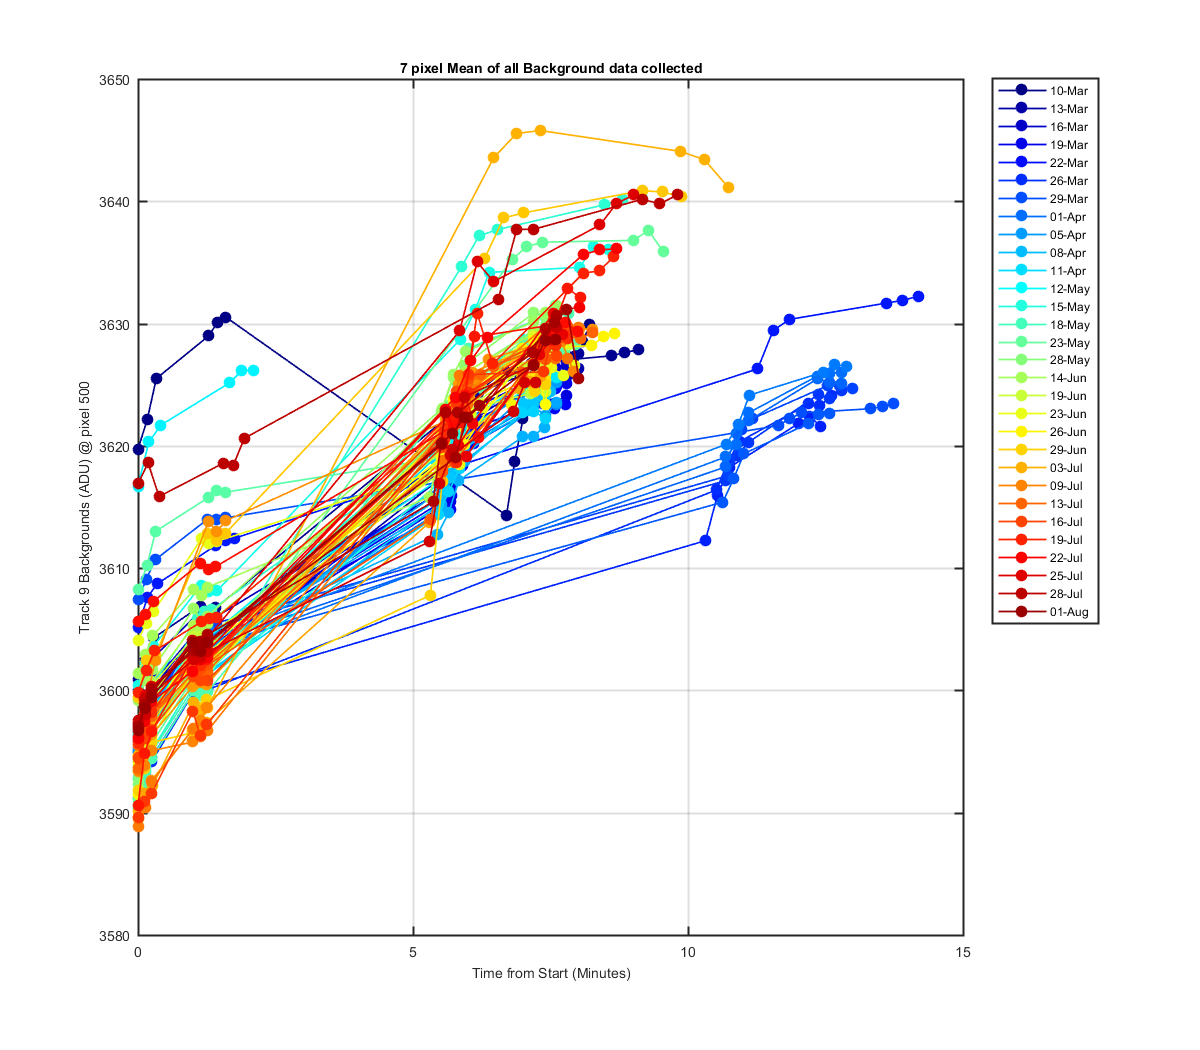
Figure 3
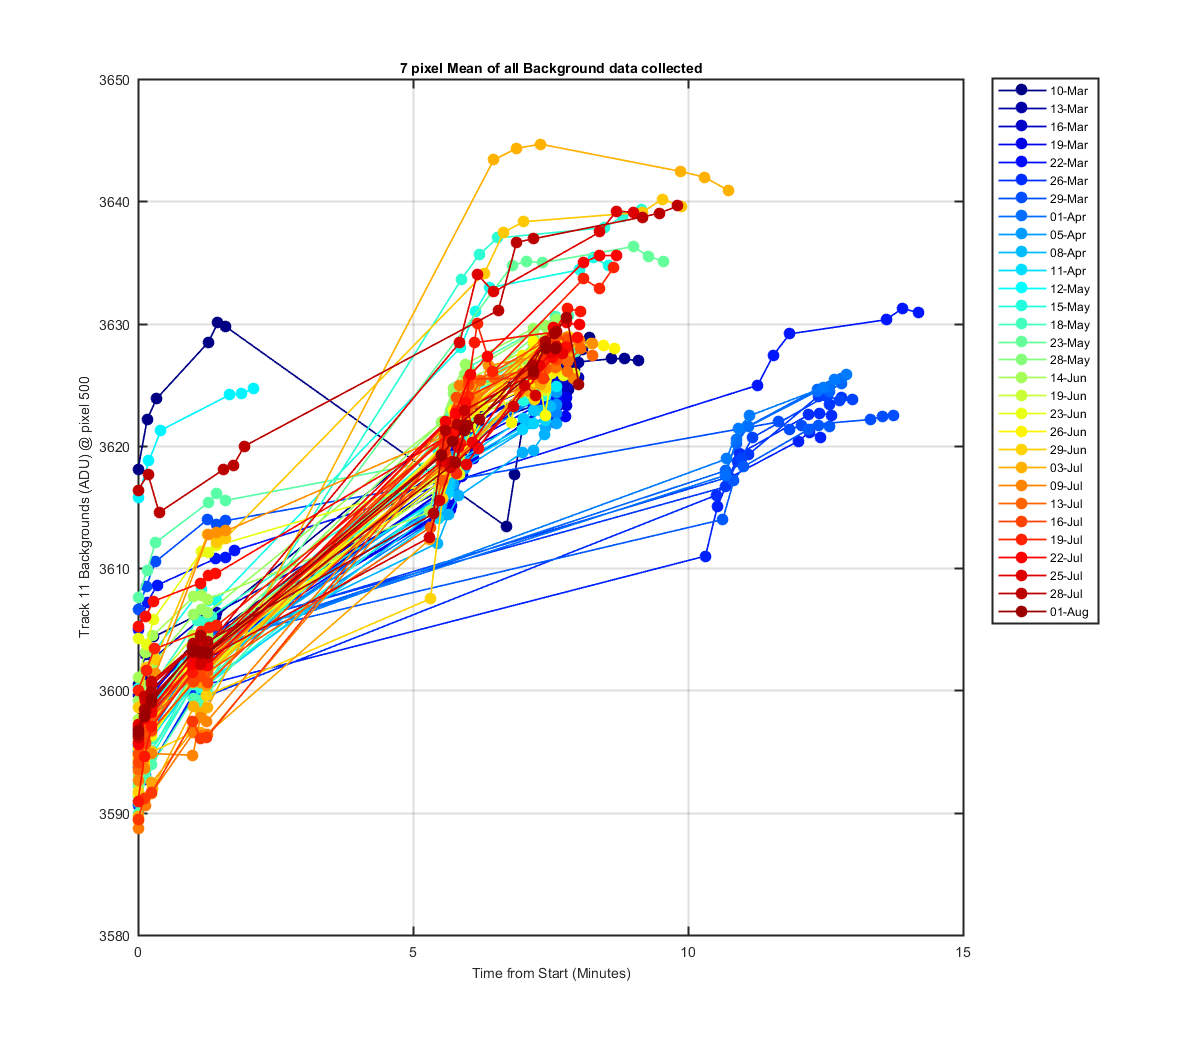
Figure 4
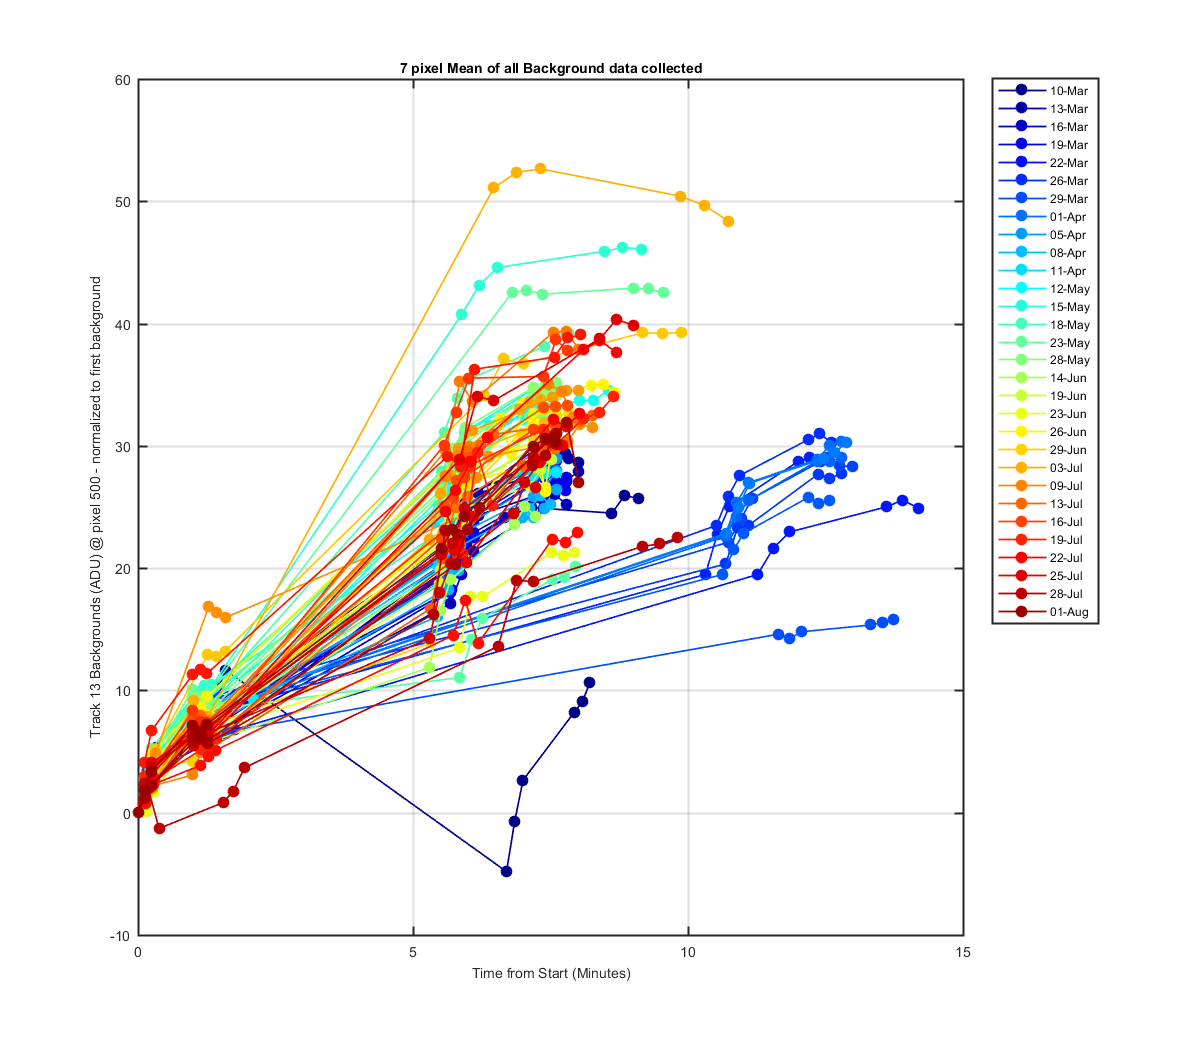
The same 7 pxiel mean as the previous graphs but I have subtracted off the first dark, so you can see the number of ADU change during the file. Starting them all at 0 ADU makes it easier to see how the files increase in darks compares.
Figure 5
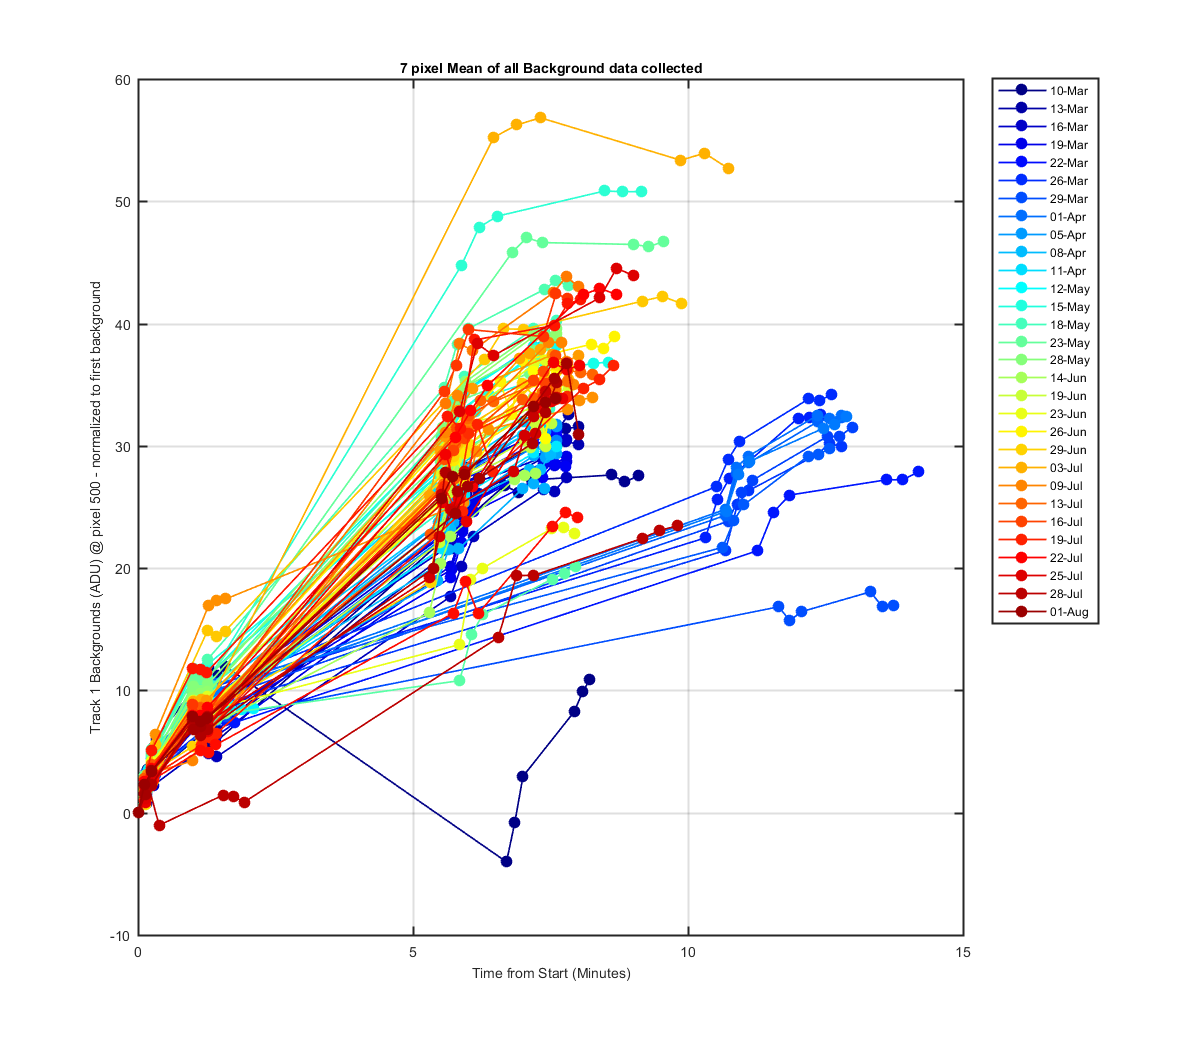
Figure 6

Figure 7
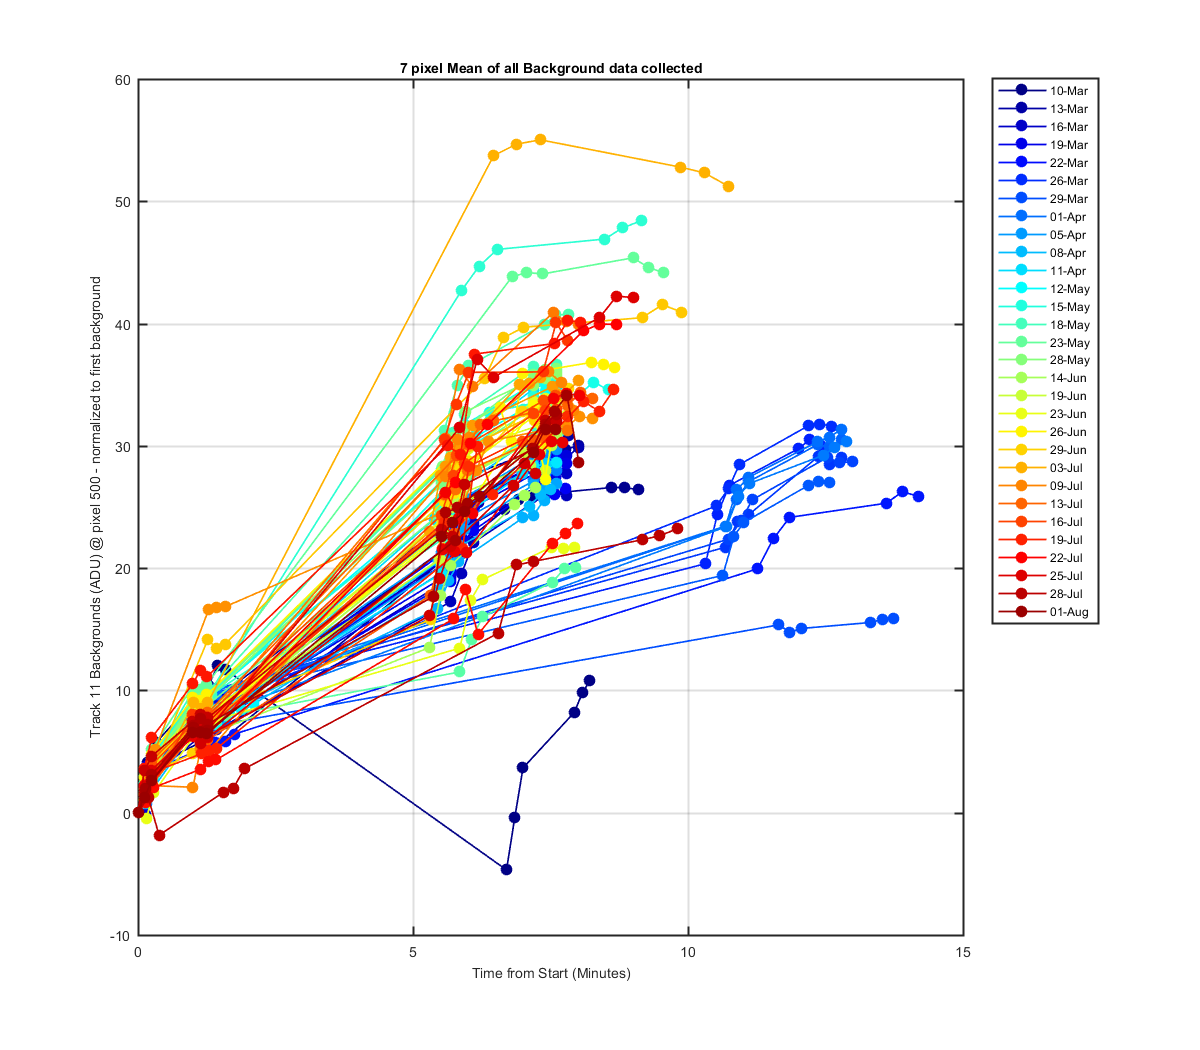
Figure 8
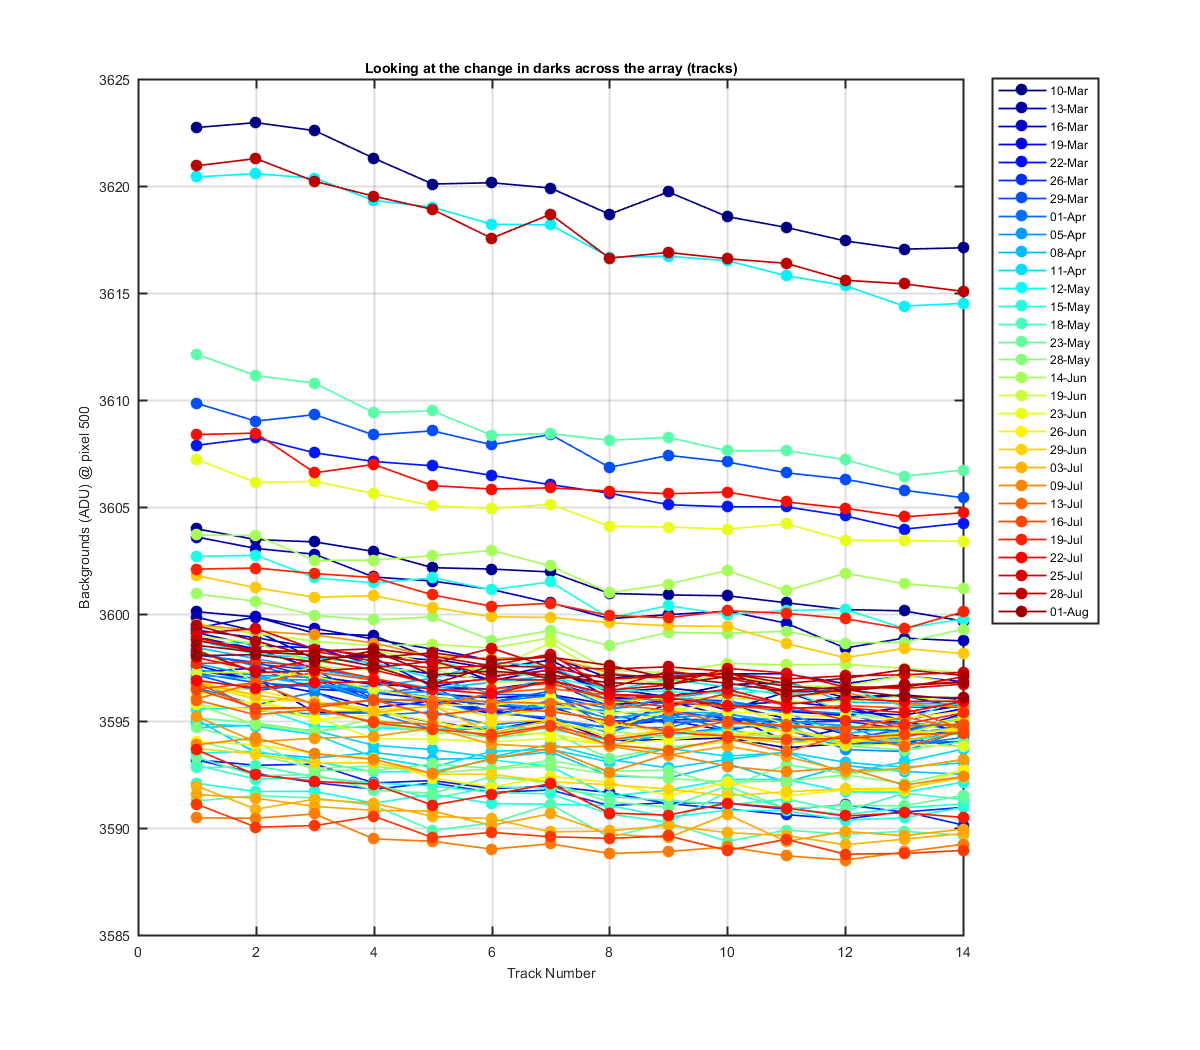
I wanted to see the change in the darks across the array (in the track direction). THis show the first data set taken for all the track for each file. Darks on the image are highest on track 1 and decrease to track 14.
Figure 9
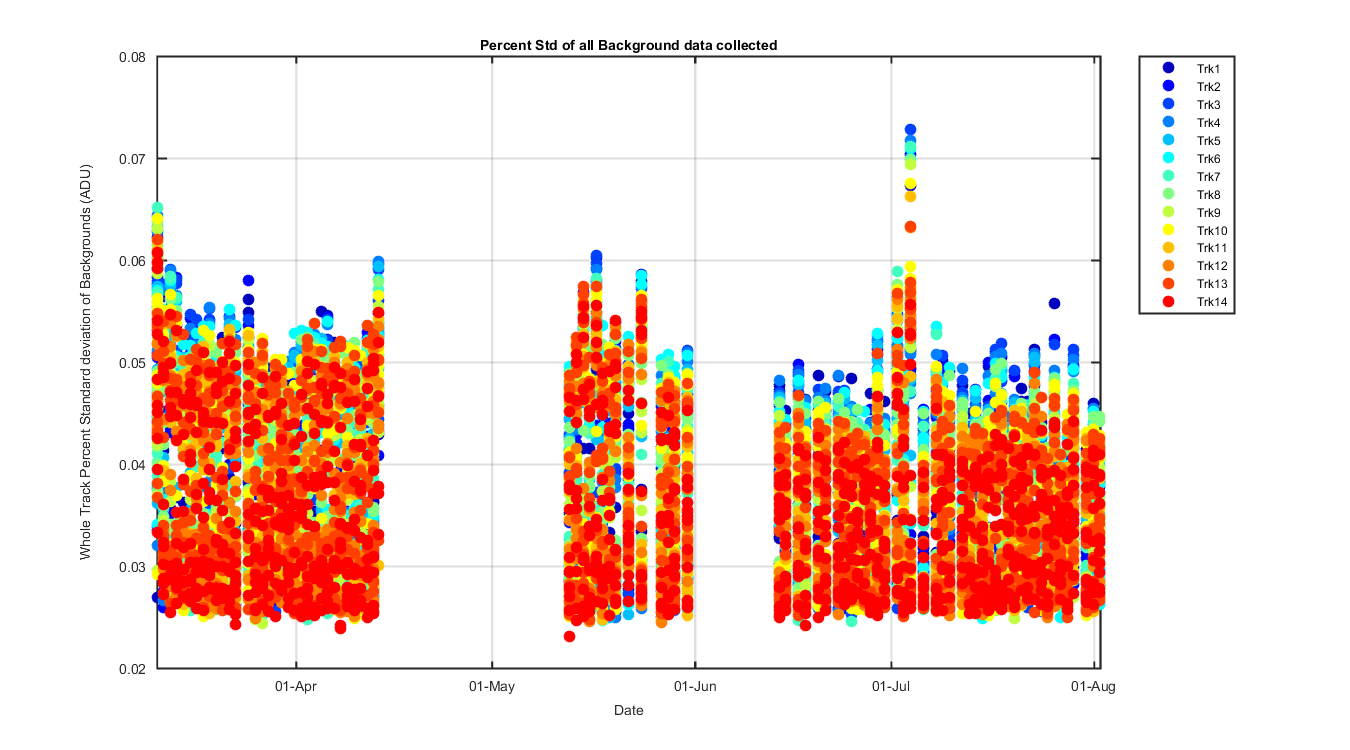
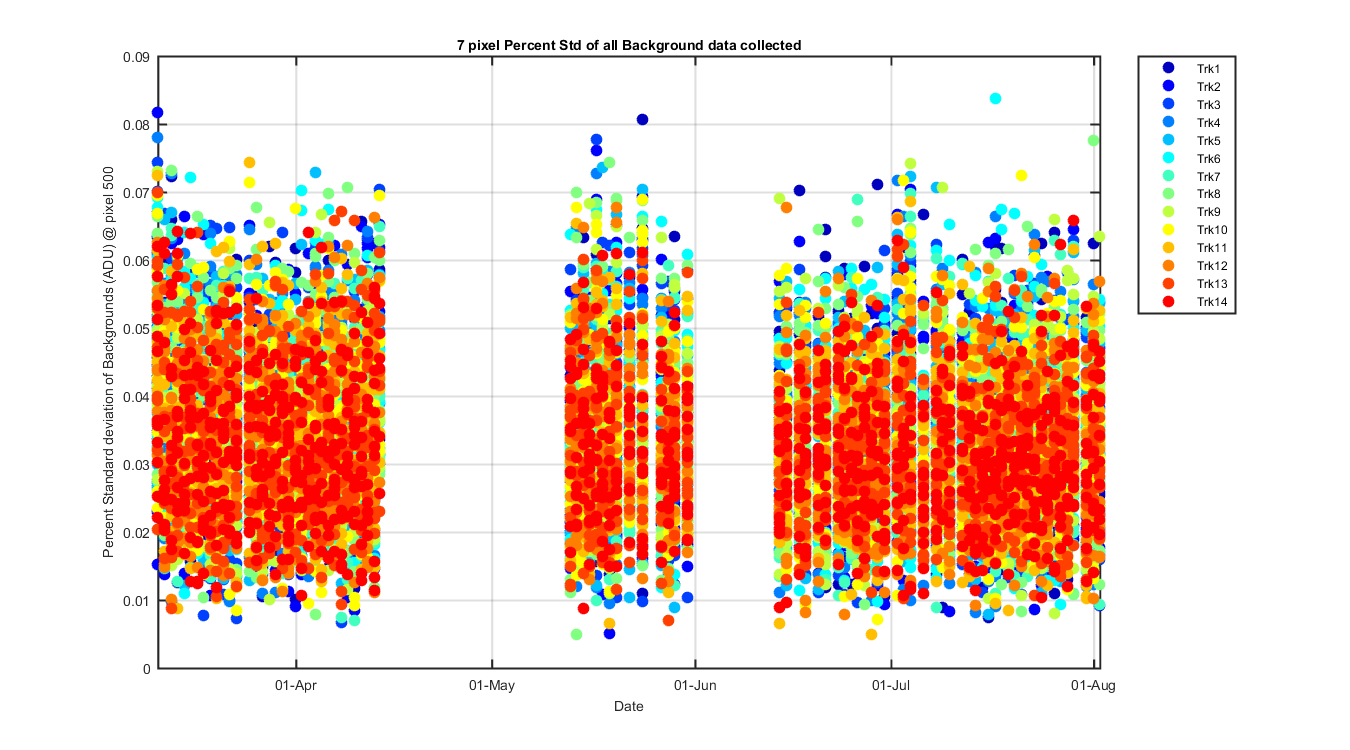
7 pixel mean for all tracks and all days of data. Just trying to see the change if any over time. The second graph is the percent standard deviation of the 7 pixels
Figure 10
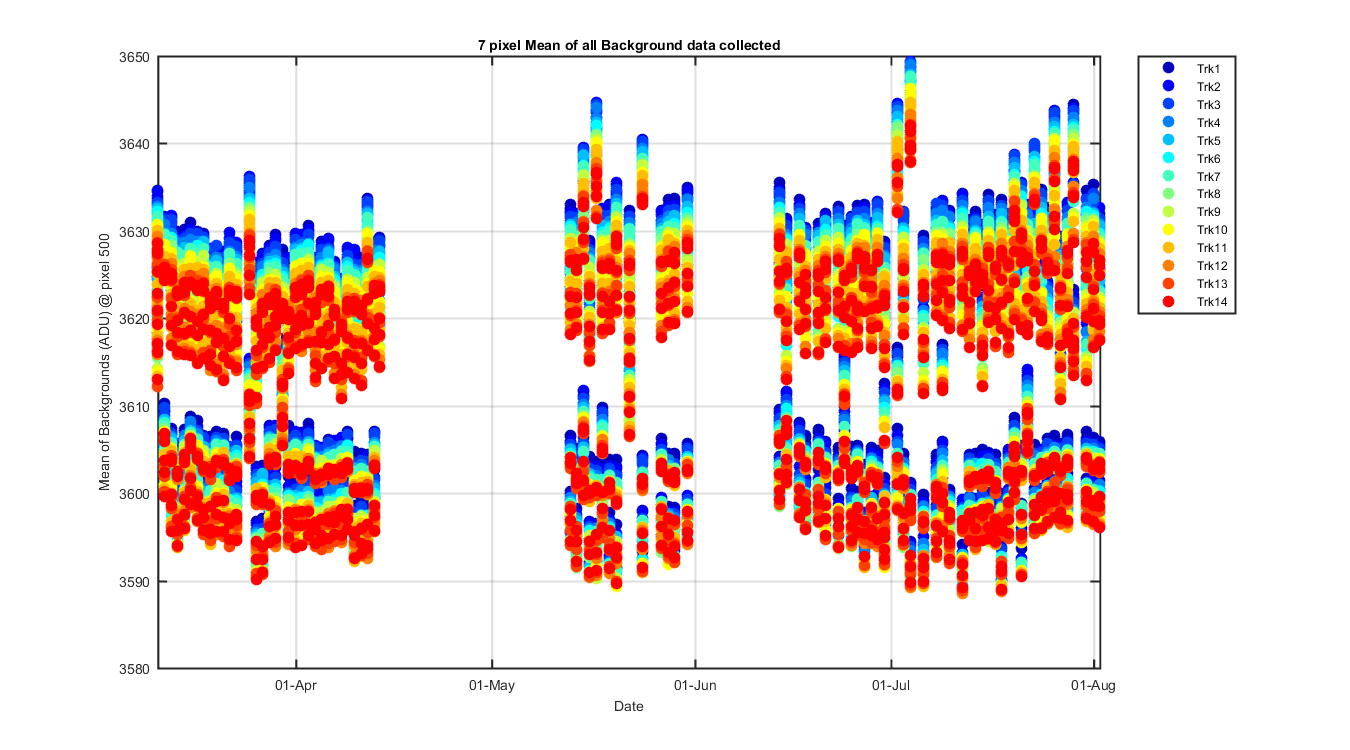
Figure 11
Whole track mean for all tracks and all days of data. Just trying to see the change if any over time and if the whole track is noisier (sine waves?) than the 7 pixel mean. The second graph is the percent standard deviation of the entire track.
Figure 12
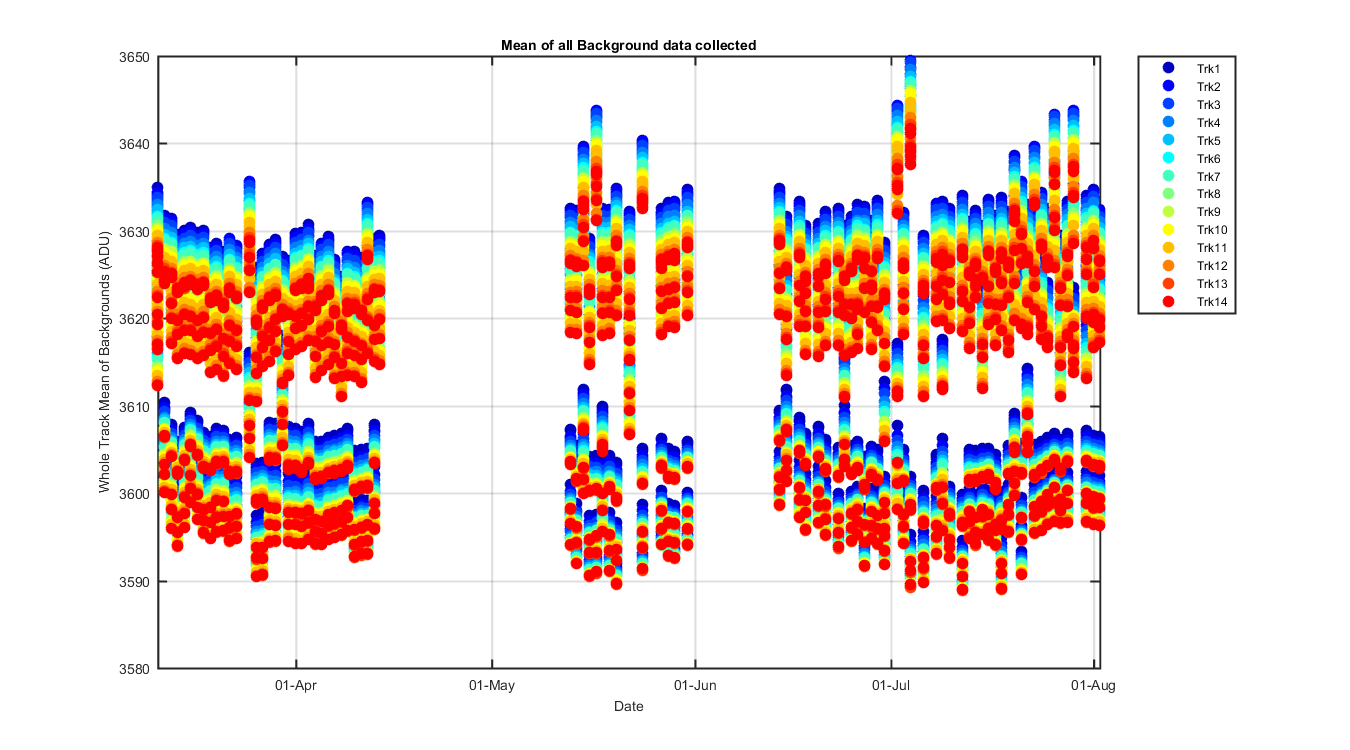
Figure 13