REVISION DATE: 31-Oct-2017 13:46:31
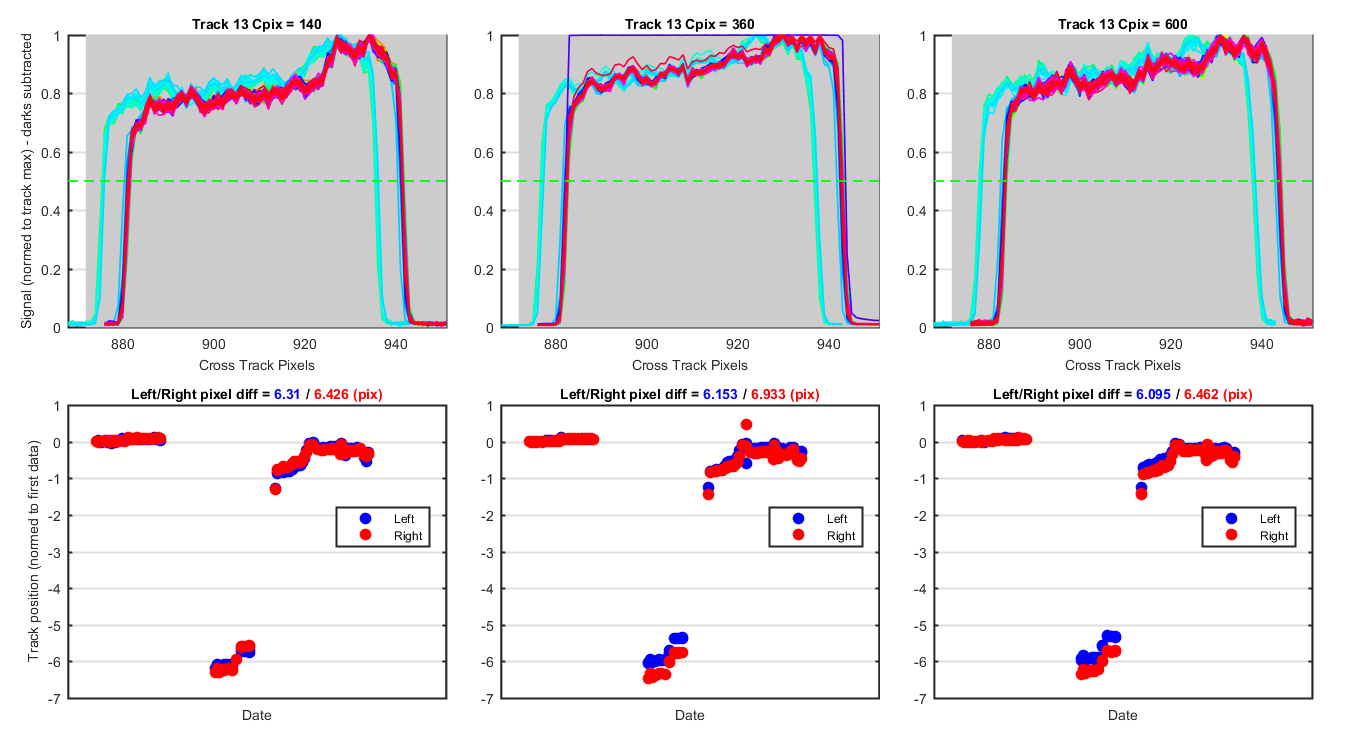
Looks at track movement for in-water data collected so far, the is no data from before deployment so we can not compare that. This is only for the tracks with light on them so the unused tracks are not included. For each file and track I normalized the track to its max value and plotted this for each file. Then I found where the right and left edge of each track crossed the 50% line. These track positions are plotted on the right panel below. I removed track with the shutters closed and tracks that where saturated (if any).
Track Defintions (grey patchs below):
Track   #:  Left   Right
        1:     1      77
        2:    72     150
        3:   146     224
        4:   220     297
        5:   293     369
        6:   365     441
        7:   437     513
        8:   509     586
        9:   582     658
       10:   652     730
       11:   726     803
       12:   797     876
       13:   872     951
       14:   945    1024
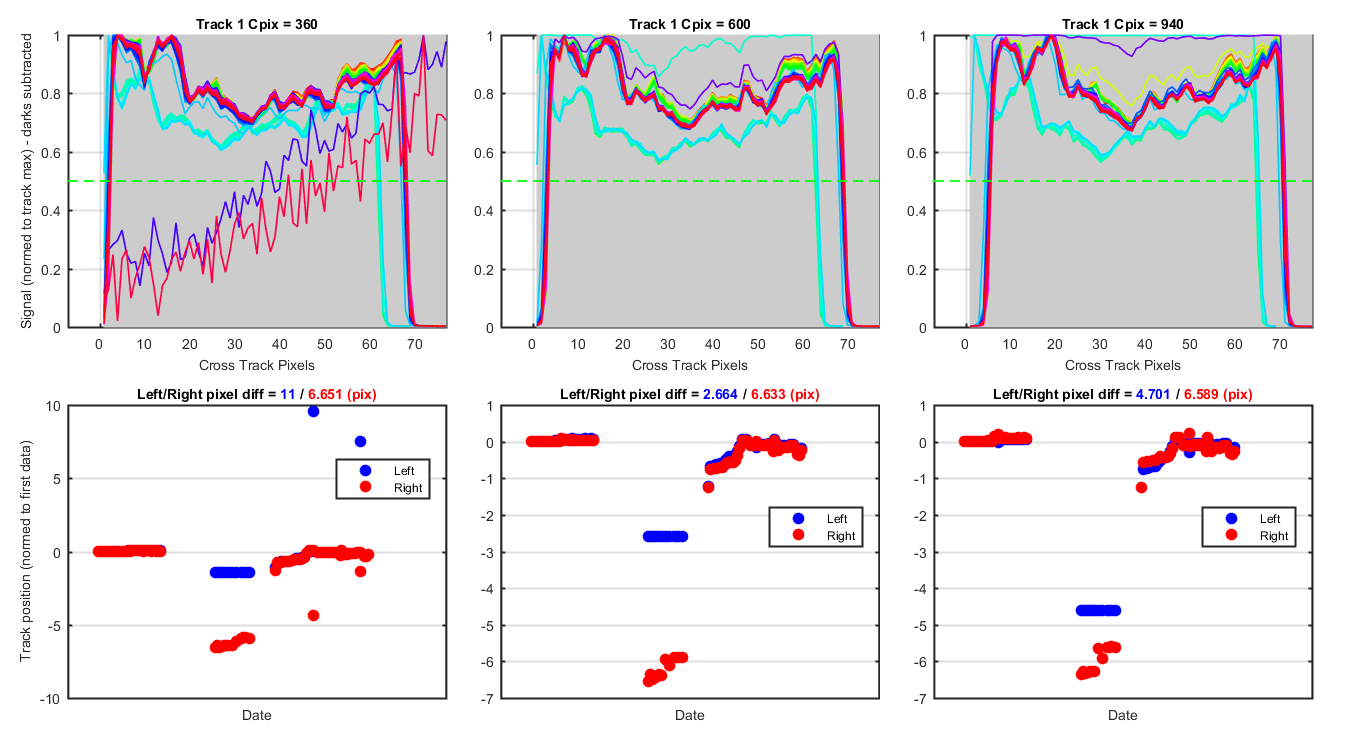
Es - Track 1 - Track movement for 3 cross track pixels. The top graphs show the track for each cross track pixel (Cpix) so you can see how the tracks move as three locations on the track. Each track is normalized to the max. And then the place it crosses the 0.5 line is calculated. The bottom three graphs show the number of pixels the track has moved relative to the first track of the deployment.
Figure 1
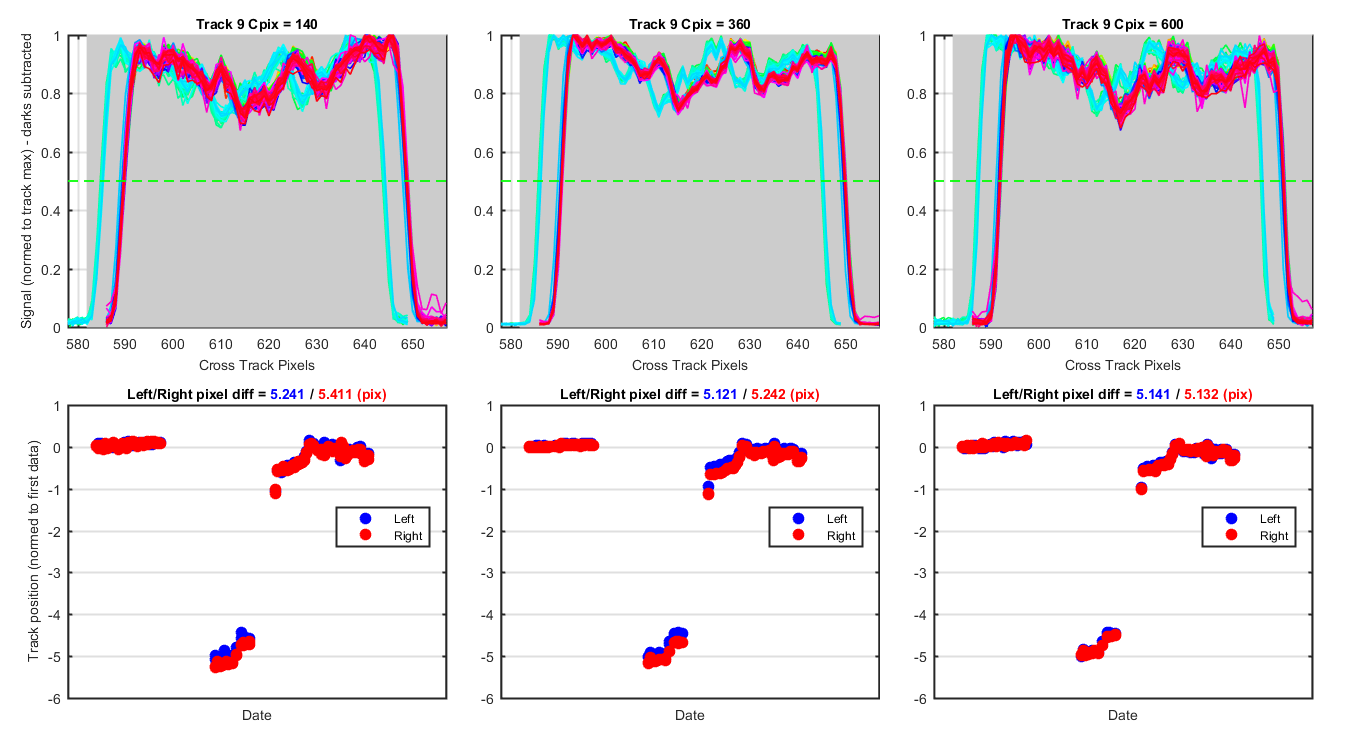
LuTop - Track 9 - Track movement for 3 cross track pixels.
Figure 2
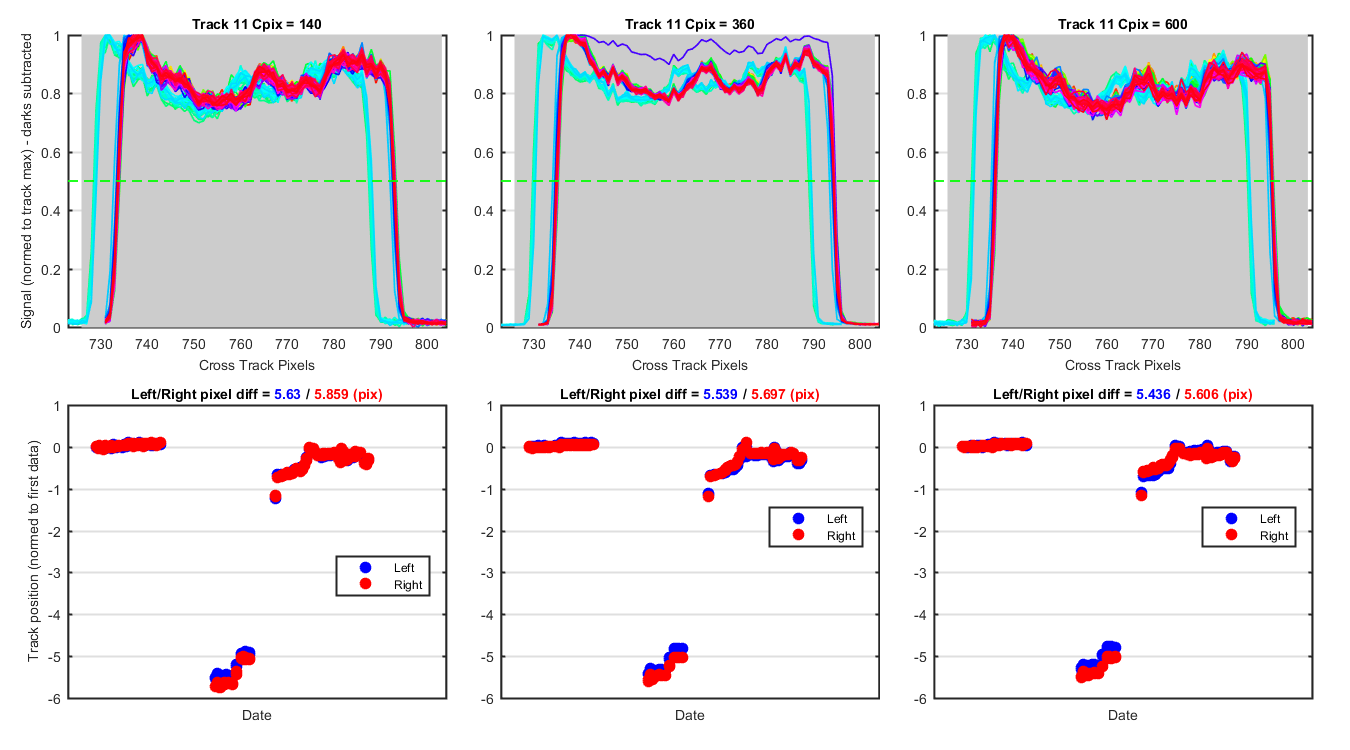
LuMid - Track 11 - Track movement for 3 cross track pixels.
Figure 3
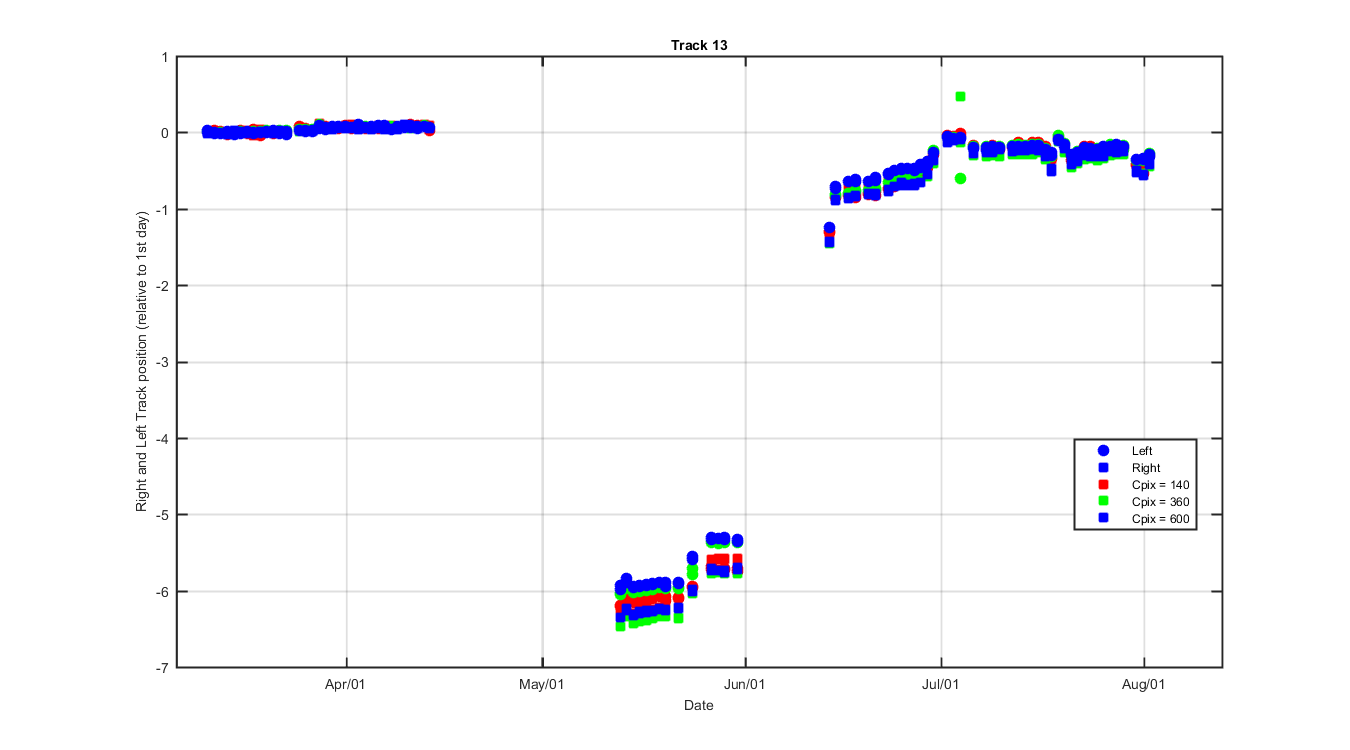
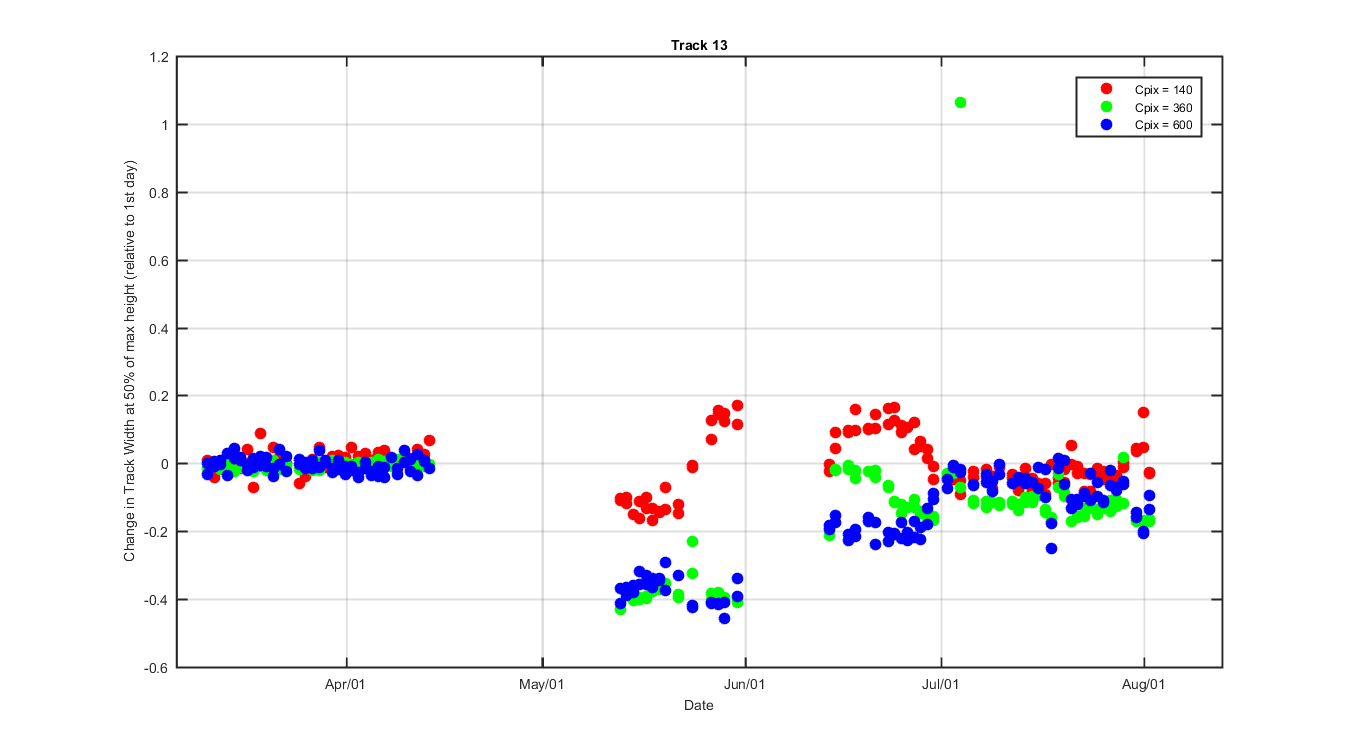
LuBot - Track 13 - Track movement for 3 cross track pixels.
Figure 4
Relative change in track width for each track and cross track pixel
Figure 5
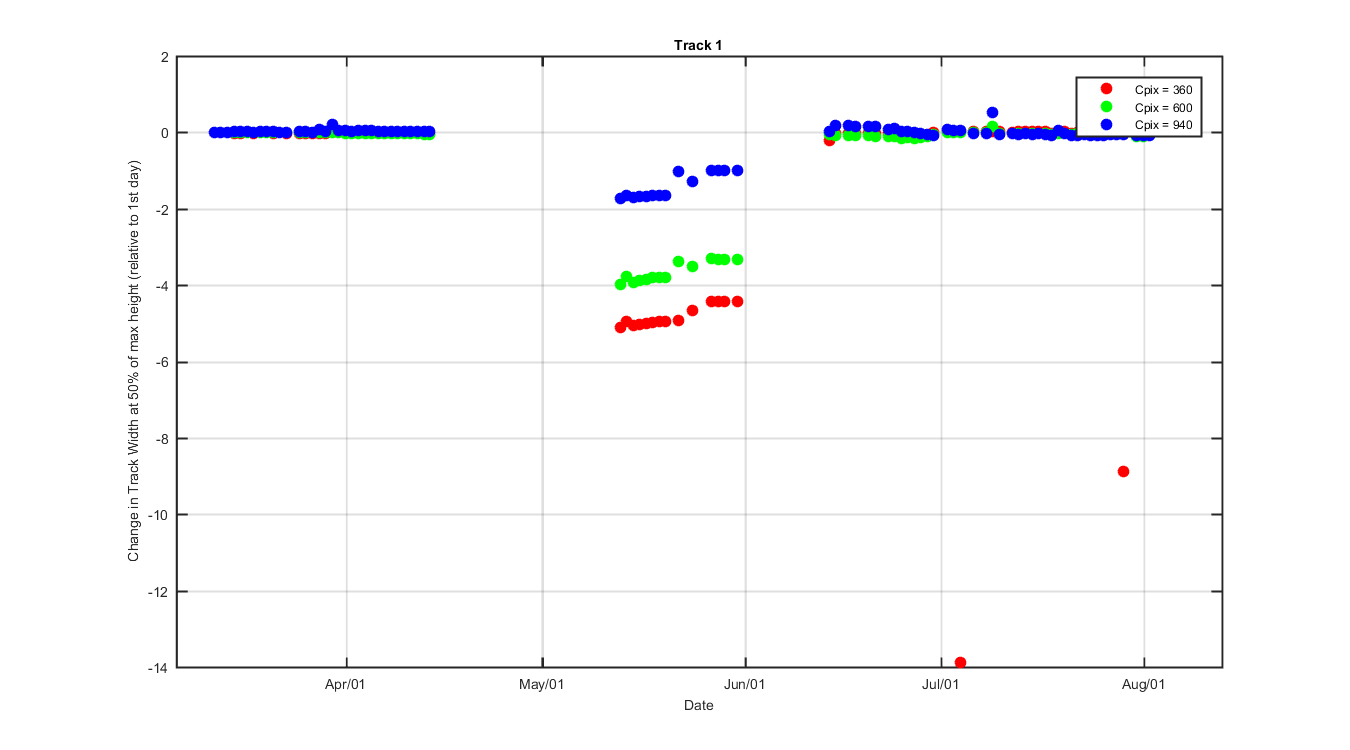
Figure 6
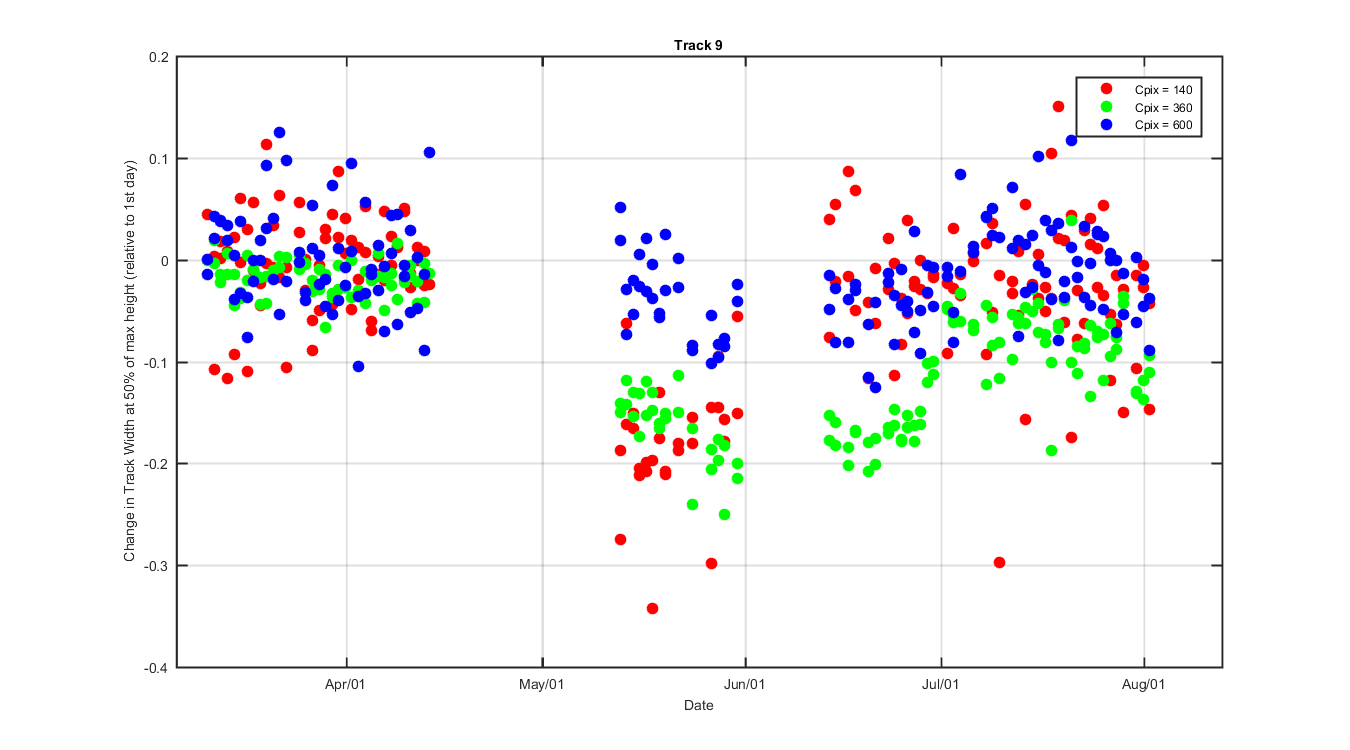
Figure 7
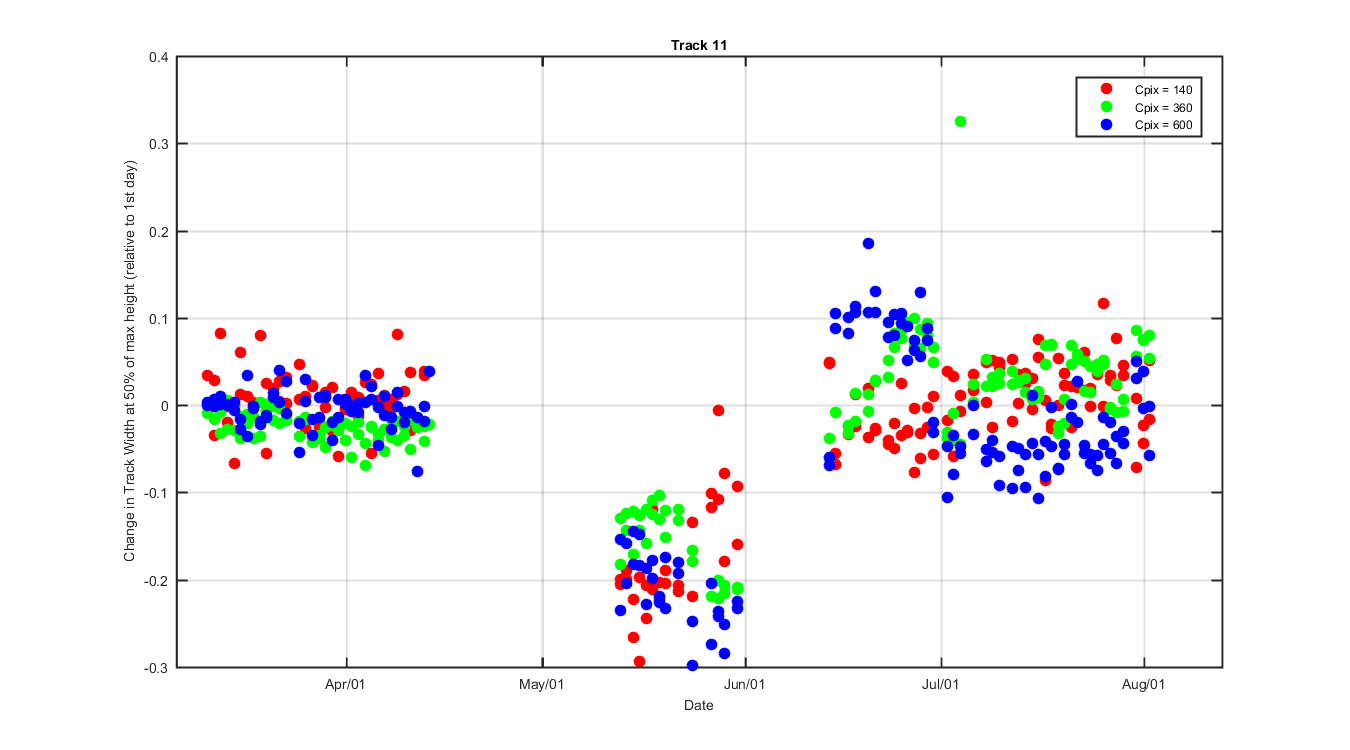
Figure 8
Relative change in left and right track position for each track and cross track pixel
Figure 9
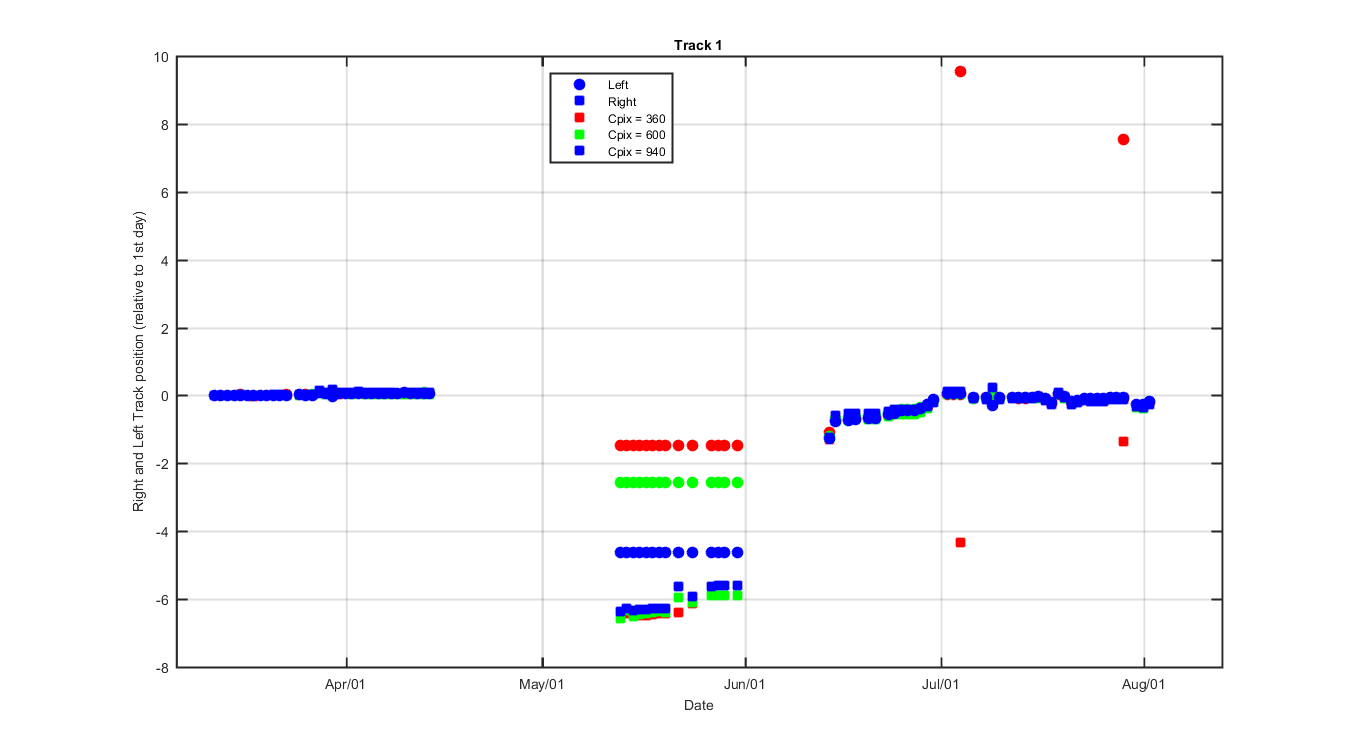
Figure 10
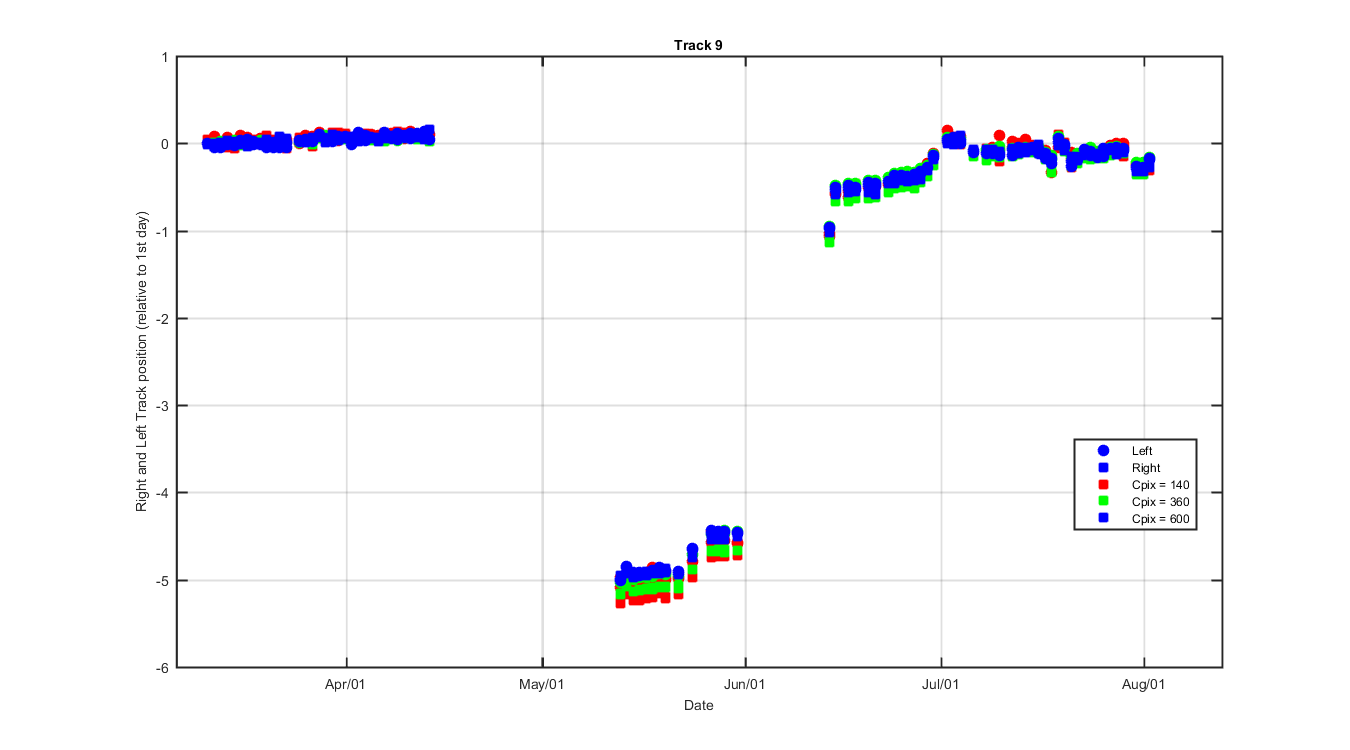
Figure 11
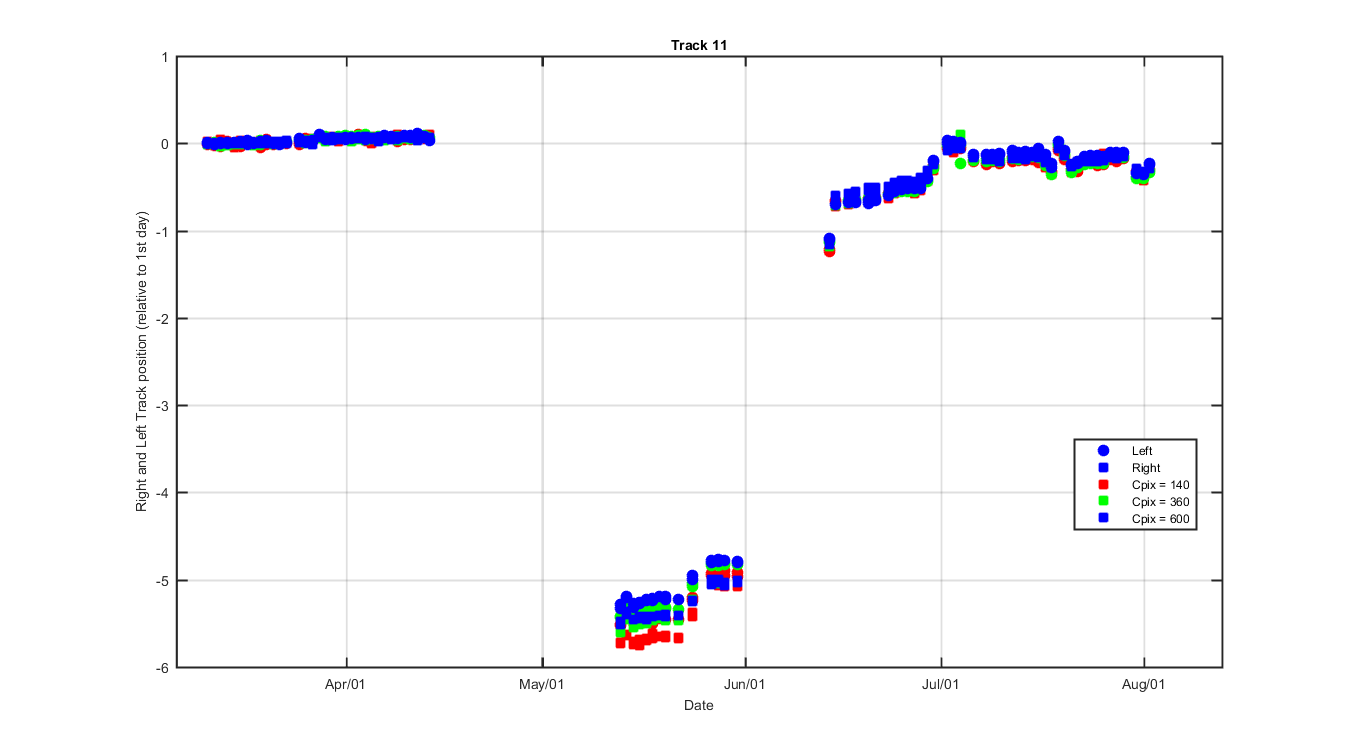
Figure 12