REVISION DATE: 23-Sep-2019 20:46:32
Orientation modules graphs. Negative pitch would be tilting the arms downward. Negative roll would be rotating the buoy clockwise when facing the same way as the arms. Marks MOBY X and Y tilt definitions from an 2009 email: X is the most in line with the arms. +X = arms tilting up. + Y = buoy tilt to the left when facing the arms head on. The tilt planes are also rotated relative to the plane of the arms. Looking down on the buoy from above, the arms are rotated clockwize relative to the X plane. It is the same number as the compass I think it is 15 deg. So best I can tell the pitch = MOBY x-tilt and roll = MOBY y-tilt. According to Mikes drawing the OM modules is lined up with the arms. So there is a ~15 degree difference in where the two are pointed.
The bottom of the OM modules relative to the chime is 11.4270 meters. I am assuming the pressure sensor is on the bottom of the OM.
←Previous 20170717_204447 Next 20170717_235140 →
ASCII log file: 20170717_221534.log
| Start Time | Length (sec) | Roll (deg) Mean / std |
Pitch (deg) Mean / std |
Tilt (deg) Mean / std |
Azimuth (deg) Mean / std |
Pressure (bar) Mean / std |
Depth (m) - Lanai Mean / std |
|---|---|---|---|---|---|---|---|
| 17-Jul-2017 22:15:34 | 312.5 | 0.068109 / 1.1637 | 4.5903 / 0.70068 | 4.733 / 0.71841 | 174.3002 / 1.1408 | 2.1304 / 0.016299 | 11.0521 / 0.16198 |
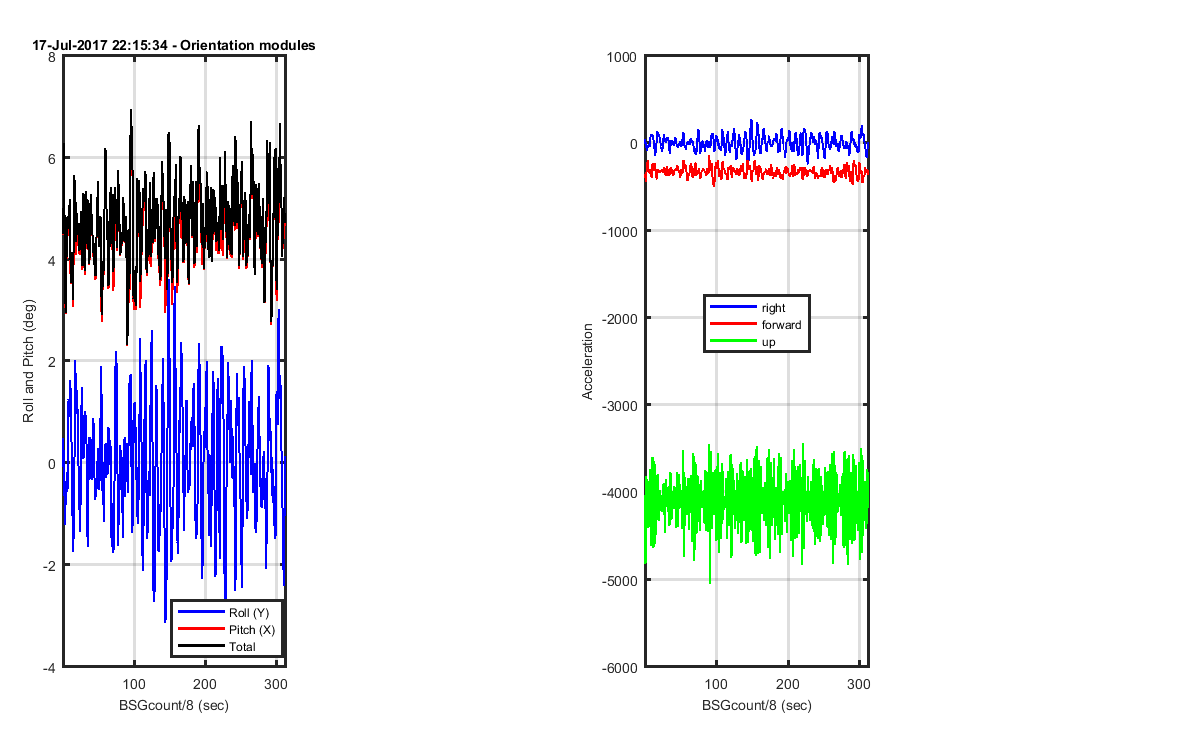
Figure 1: Each of the orientation modules data sets. BSGcount/8 on the x-axis is my guess at getting time in seconds. BSGcount it just sequenctial numbers in the file. I think I heard someone say the file is ~5 minutes worth of data. If I divide by 8 that gets us close to 5 minutes.
The pressure in bars is converted to depth in meters using the UNESCO Tech Paper Mar Sci 44 (1983), Latitude is 21 degrees North. There are three surface or "deck" pressures used to get three different depths. The Matlab code to convert is Z = depth_(10.*(PRESSURE-DECKPRESSURE),21); The Dck Press (Deck Pressure) is the mean untilted pressures from the 8 May experiment. The honolulu is the pressure from the airport on 8 May 2017 (the day of the experiment). And Lanai is the Lanai airport reading taken on the day and the closest hour to the reading. The Dck Press and Honolulu pressures are fixed numbers. The Lanai pressure will change depending on the day.
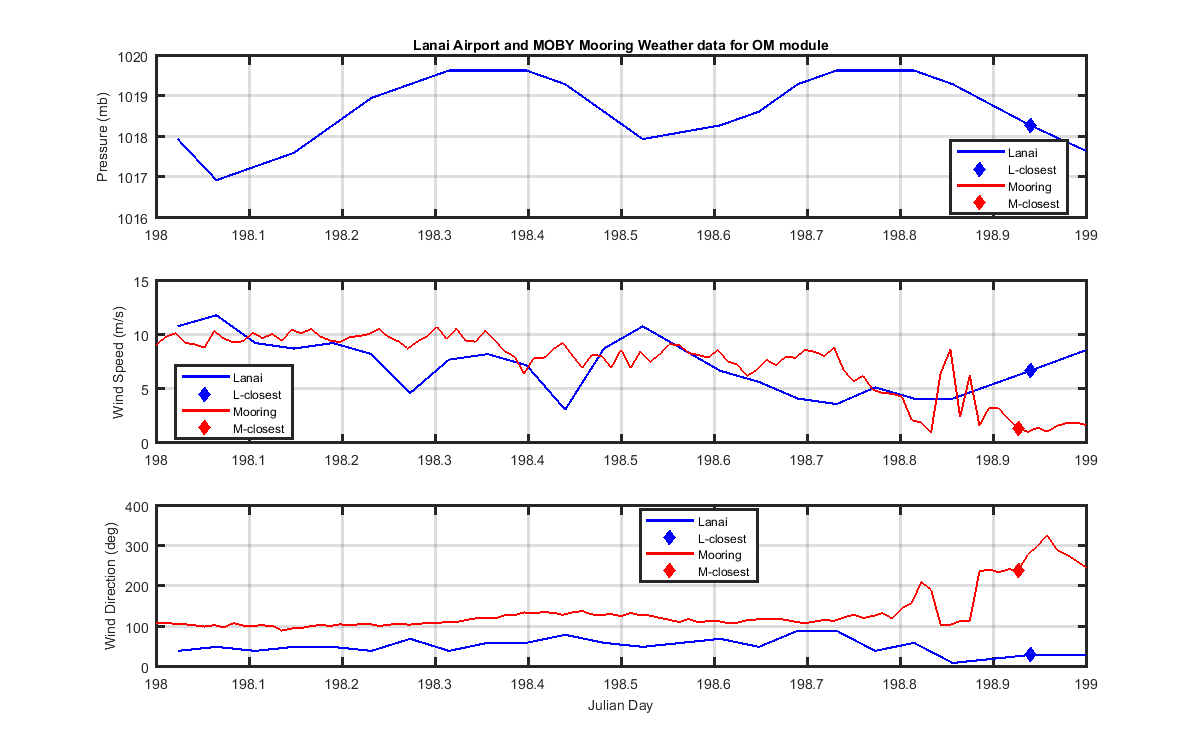
Figure 2: Lanai and MOBY Mooring weather data. Diamonds are the data closest in time to the OM data.
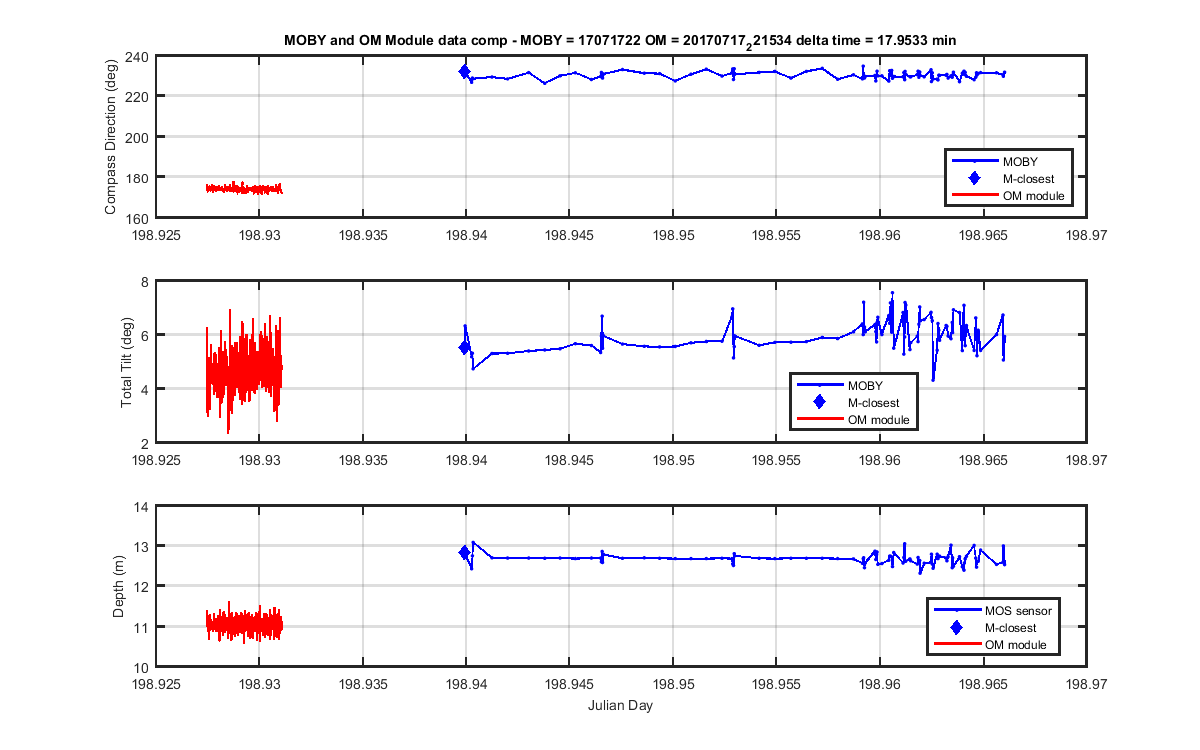
Figure 3: OM modules and the closest MOBY file. The MOBY compas data are corrected (although no cals have been done to confirm the corrections) and the OM data are not. The MOBY depth data plotted are from the MOS sensor. The even buoys data are not correct but I thought it could give an idea of the up and down movement even if the actual number is wrong.
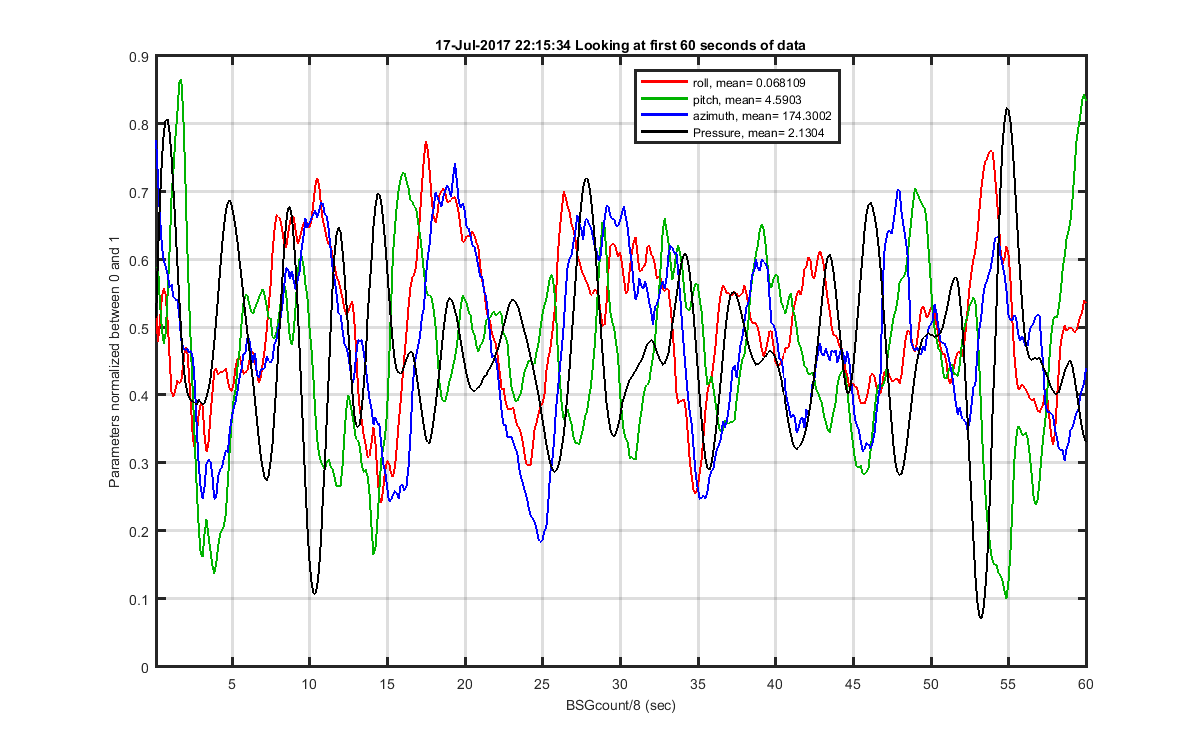
Figure 4: I wanted to look at the 4 main signals to see the lag from one to the other. So I normalized them all between 0 and 1 and plotted the first 60 seconds of the data.
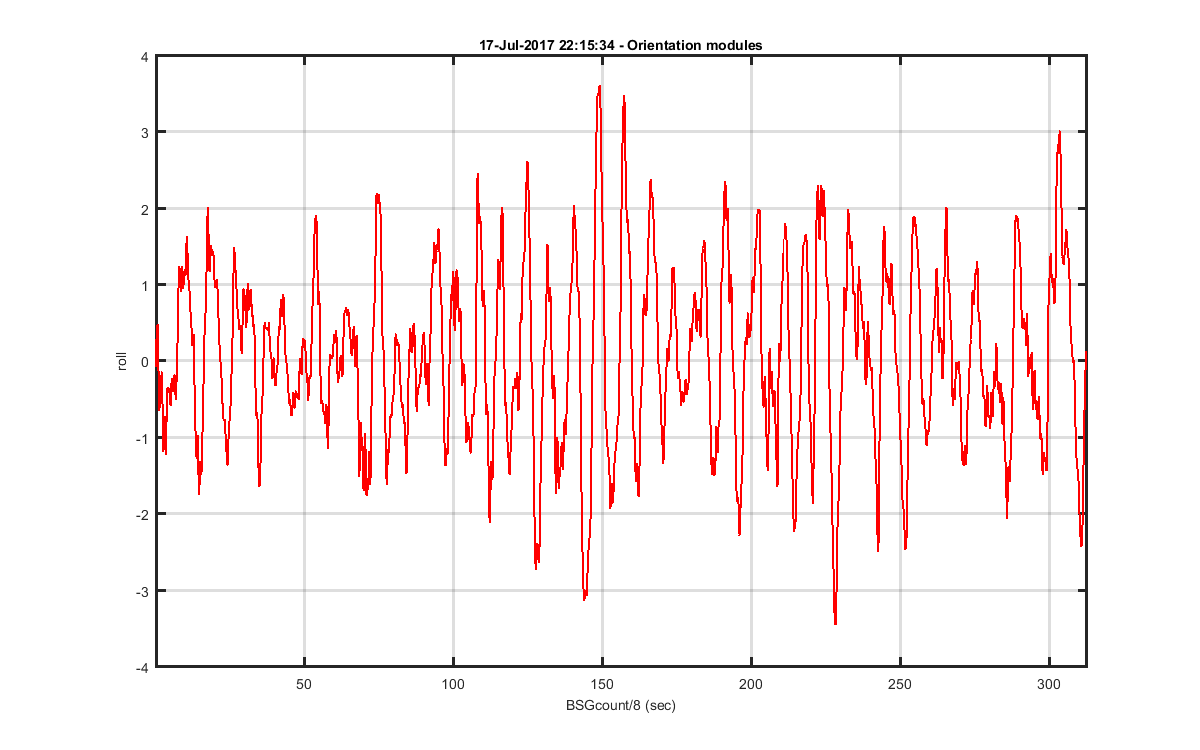
Figure 5
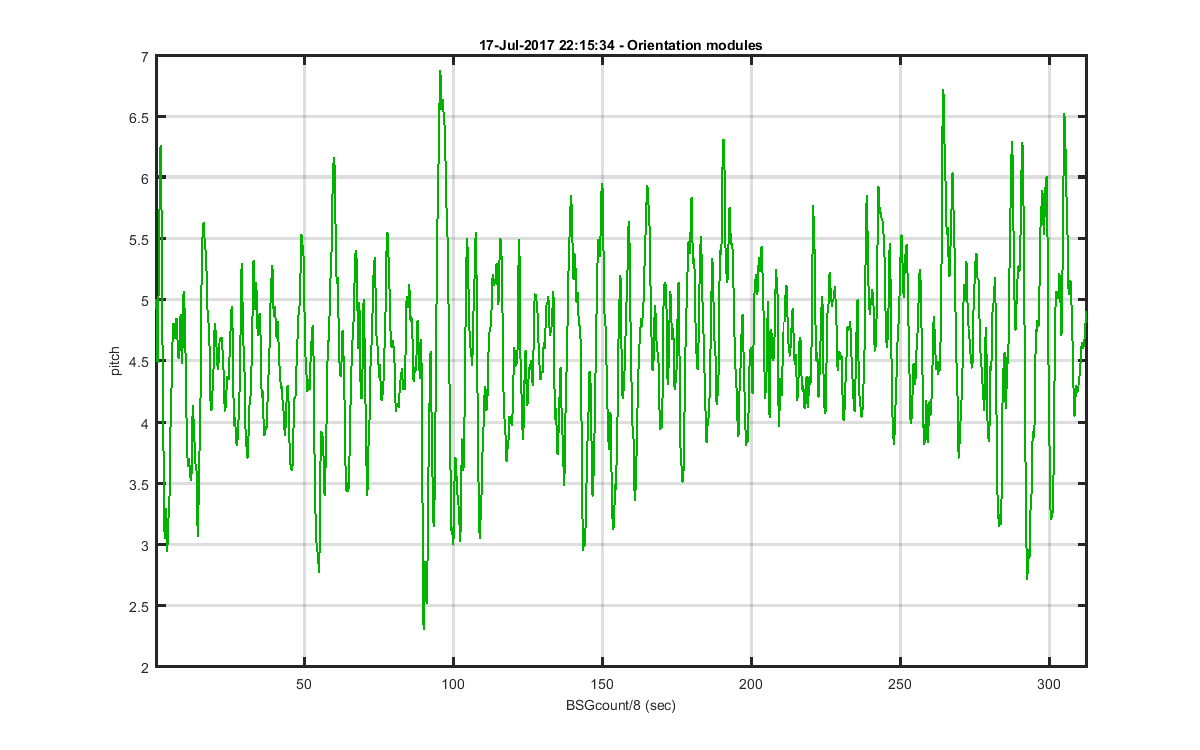
Figure 6
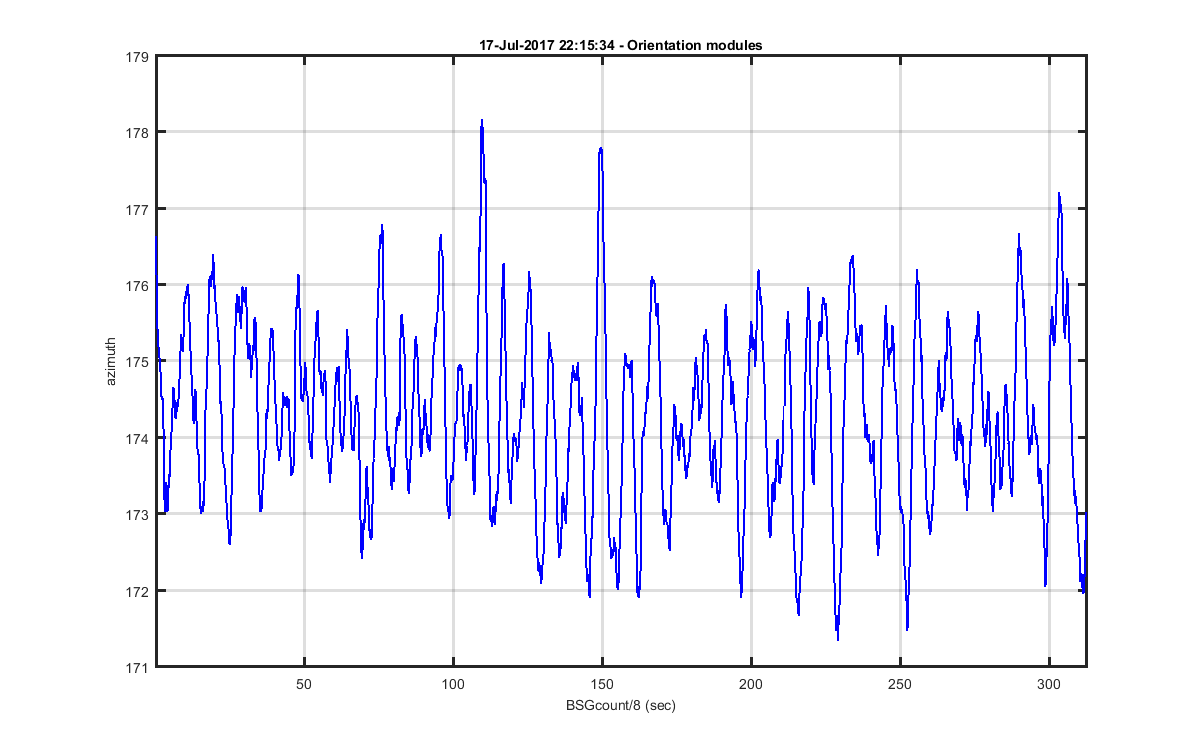
Figure 7
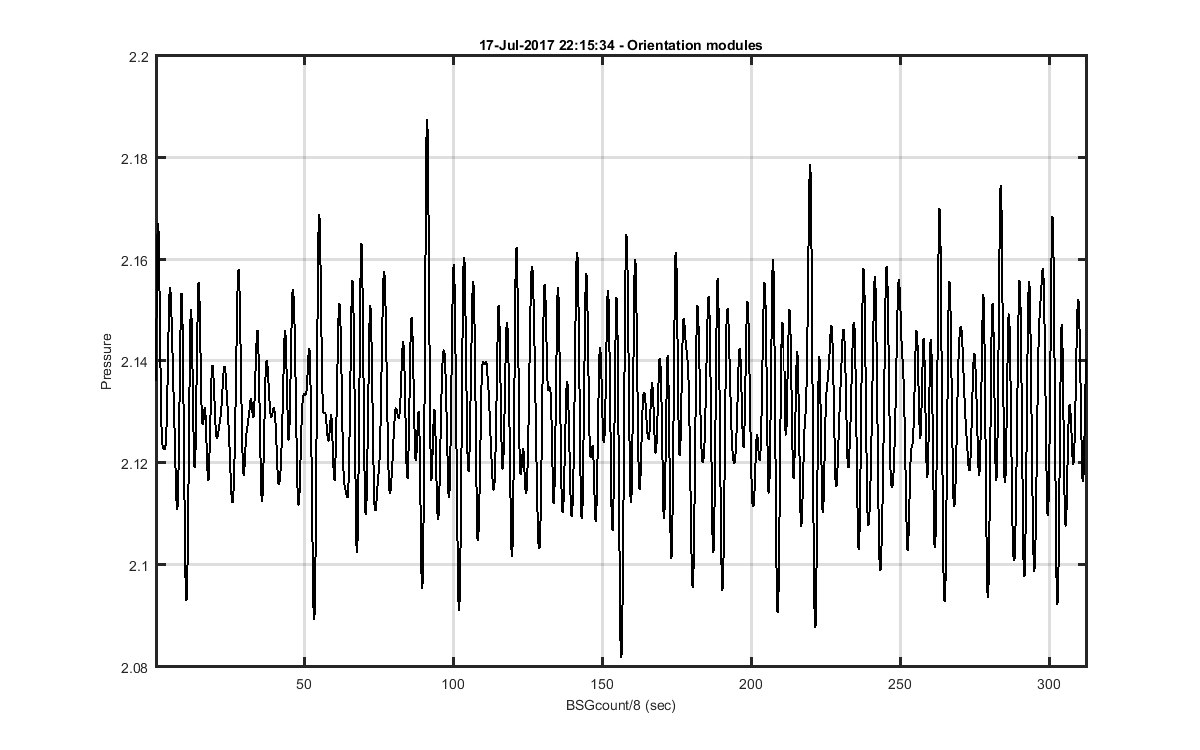
Figure 8
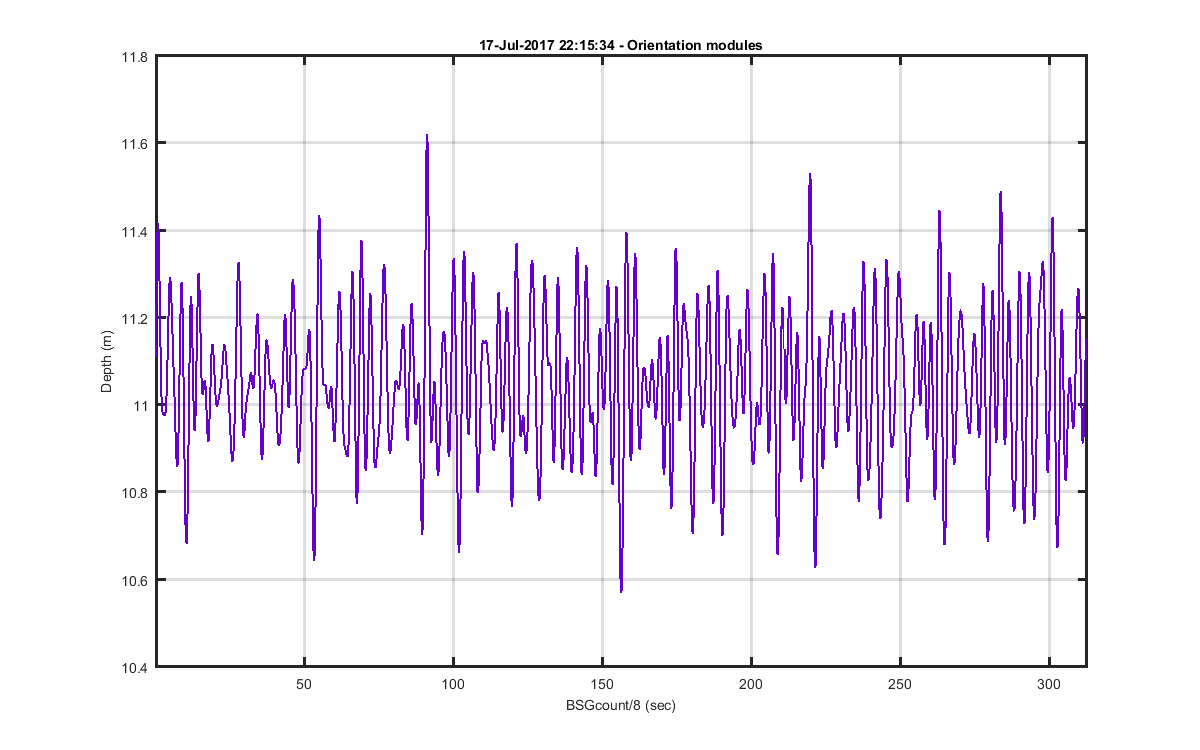
Figure 9
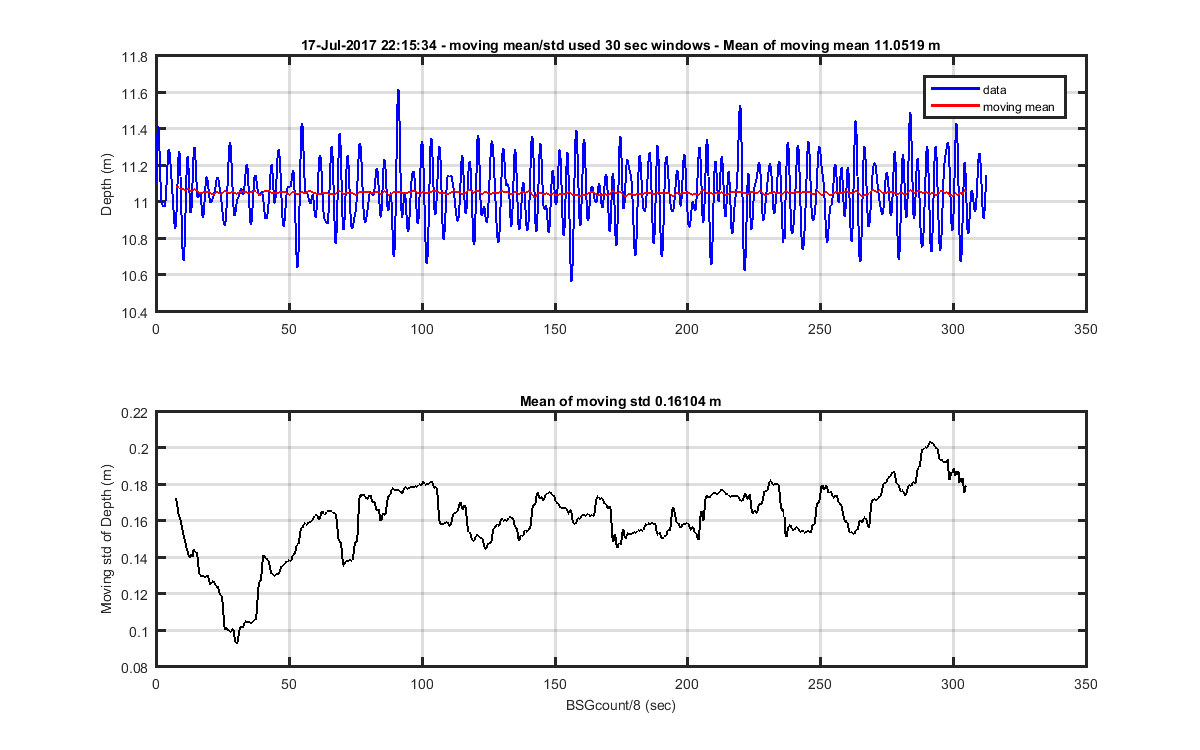
Figure 10