REVISION DATE: 29-Jan-2018 15:55:18
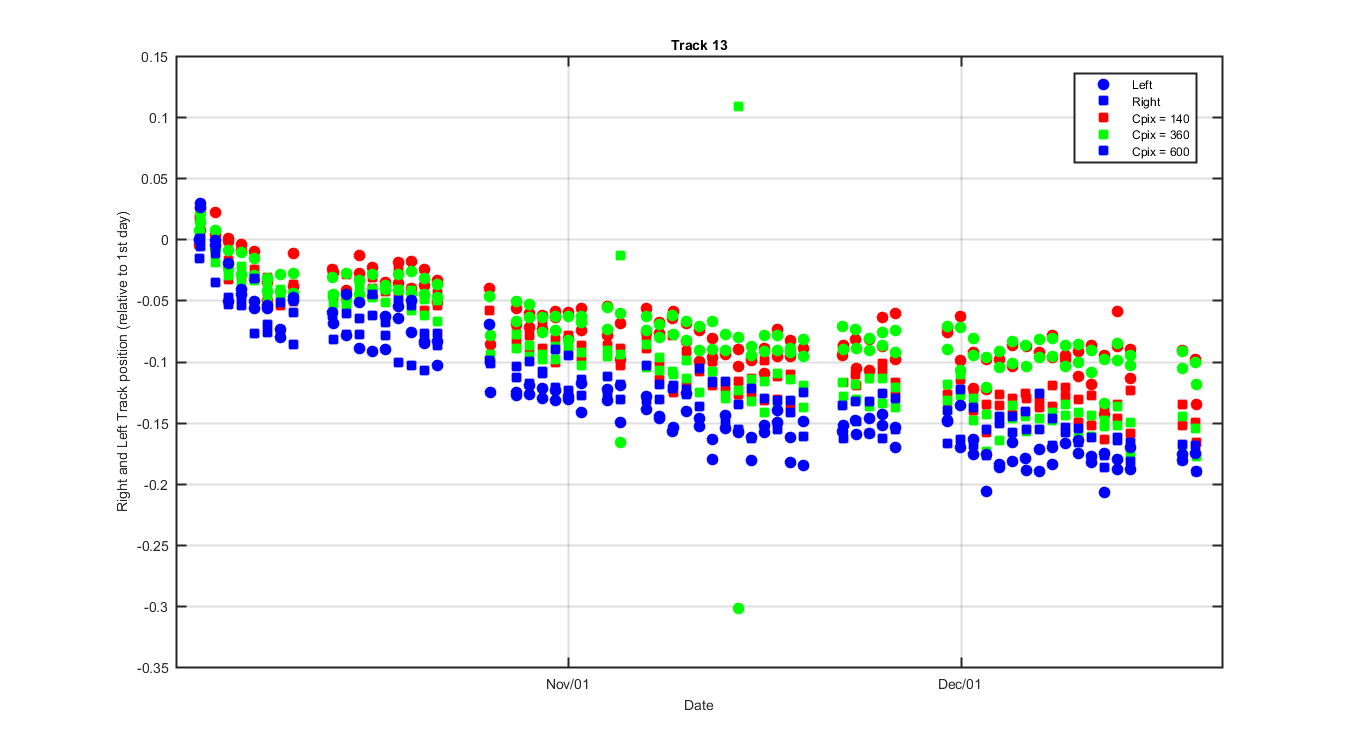
Looks at track movement for in-water data collected so far. This is only for the tracks with light on them so the unused tracks are not included. For each file and track I normalized the track to its max value and plotted this for each file. Then I found where the right and left edge of each track crossed the 50% line. These track positions are plotted on the right panel below. I removed track with the shutters closed and tracks that where saturated (if any).
Track Defintions (grey patchs below):
Track   #:  Left   Right
        1:     1      76
        2:    93     135
        3:   152     229
        4:   243     280
        5:   298     373
        6:   386     425
        7:   440     515
        8:   531     571
        9:   585     658
       10:   673     713
       11:   728     799
       12:   818     858
       13:   876     946
       14:   964    1010
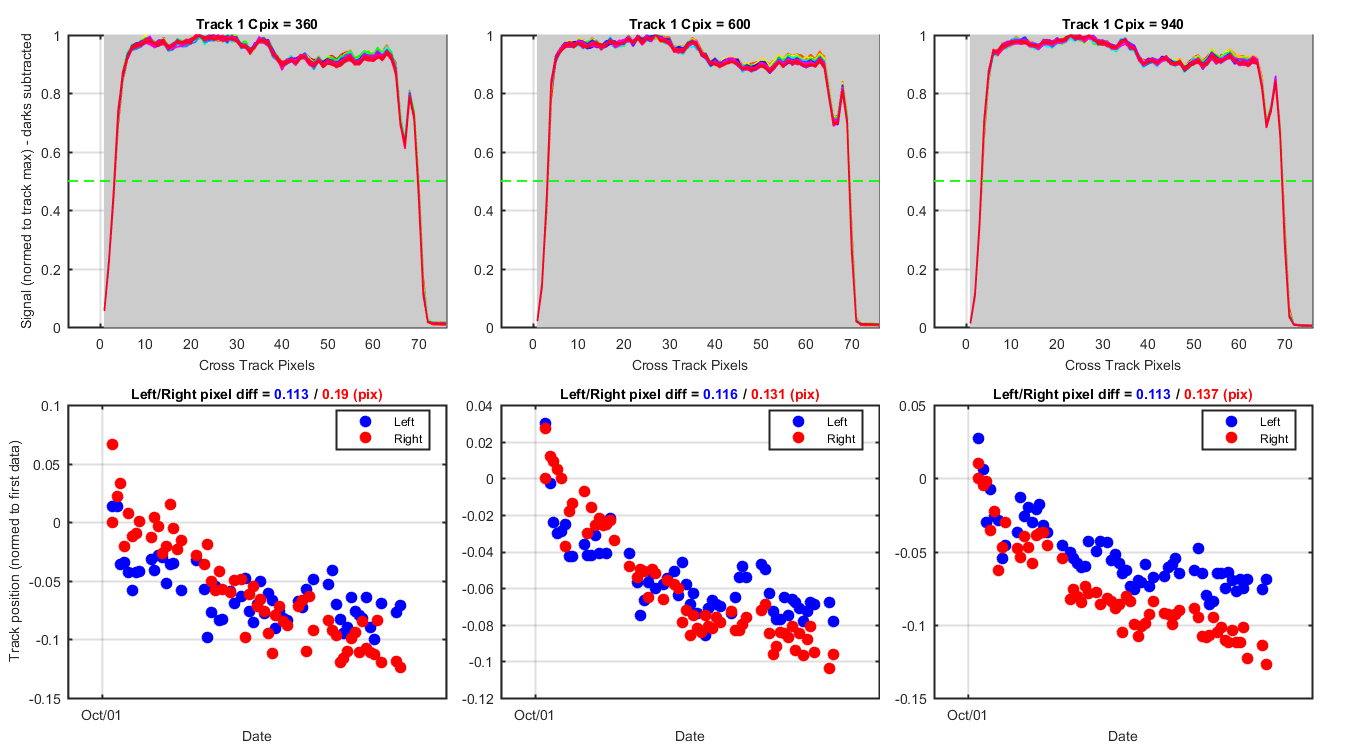
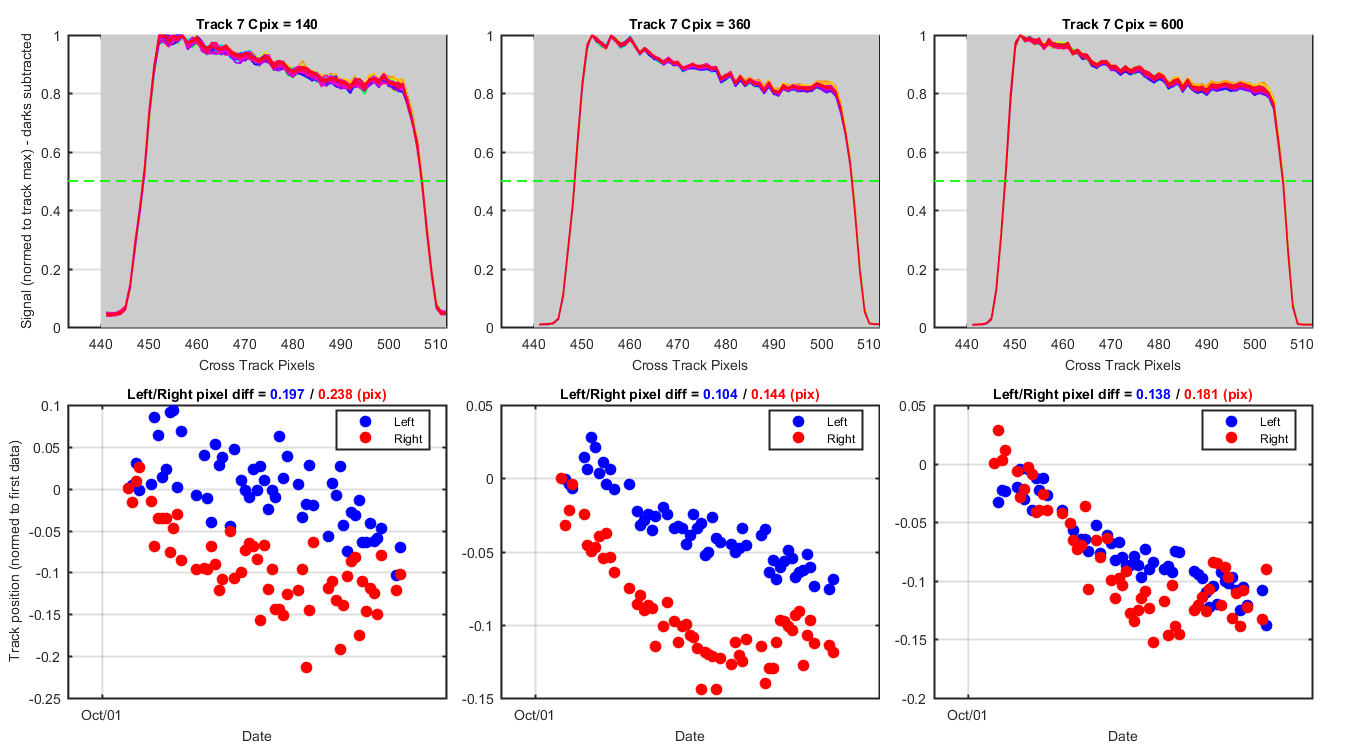
Es - Track 1 - Track movement for 3 cross track pixels. The top graphs show the track for each cross track pixel (Cpix) so you can see how the tracks move as three locations on the track. Each track is normalized to the max. And then the place it crosses the 0.5 ( or a lower number in the case of some tracks with a "knife" saddle shape) line is calculated. The bottom three graphs show the number of pixels the track has moved relative to the first track of the deployment.
Figure 1
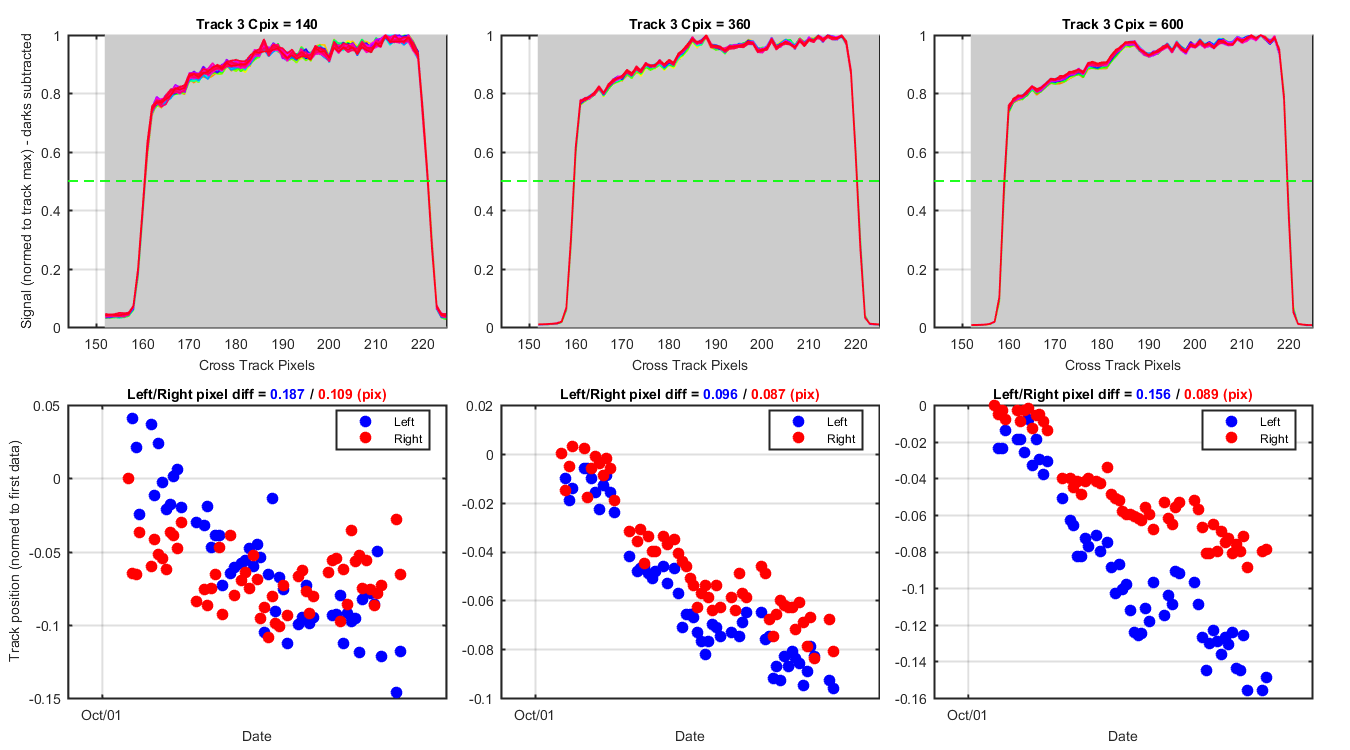
EdTop - Track 3 - Track movement for 3 cross track pixels.
Figure 2
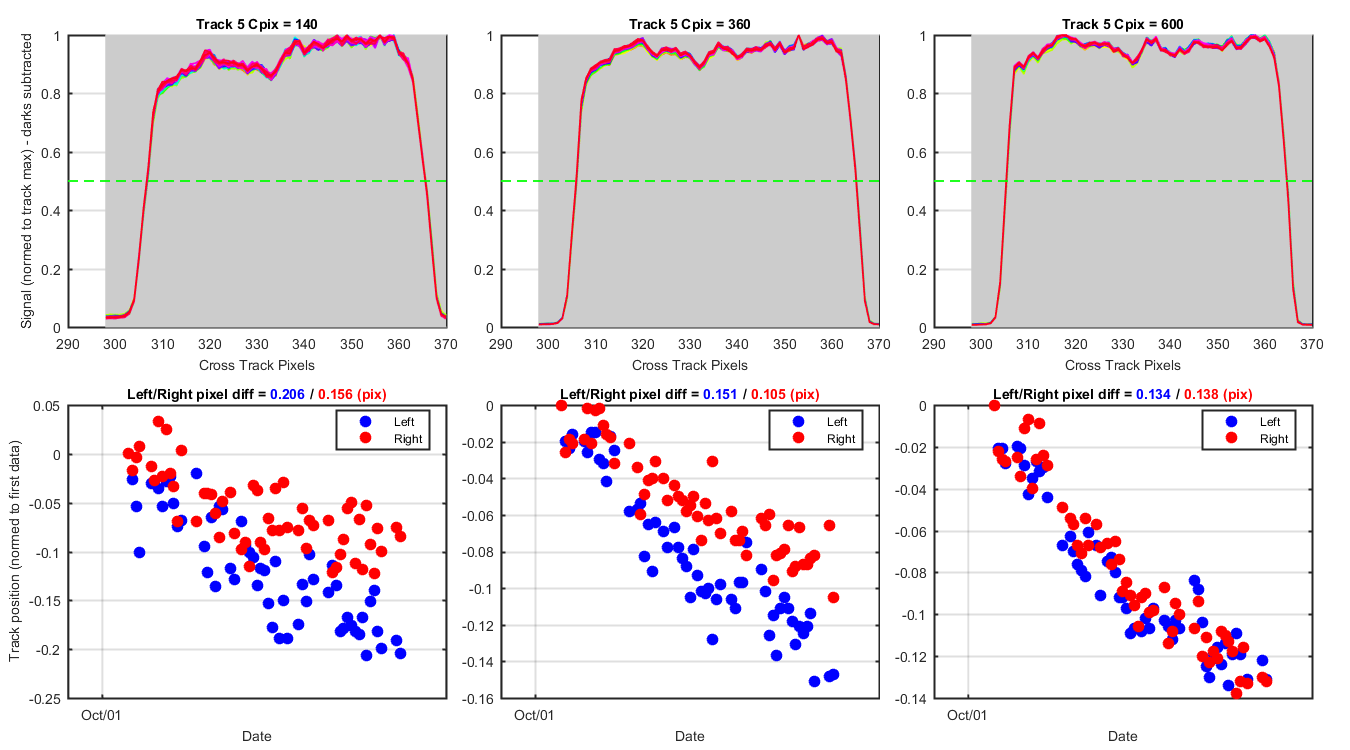
EdMid - Track 5 - Track movement for 3 cross track pixels.
Figure 3
EdBot - Track 7 - Track movement for 3 cross track pixels.
Figure 4
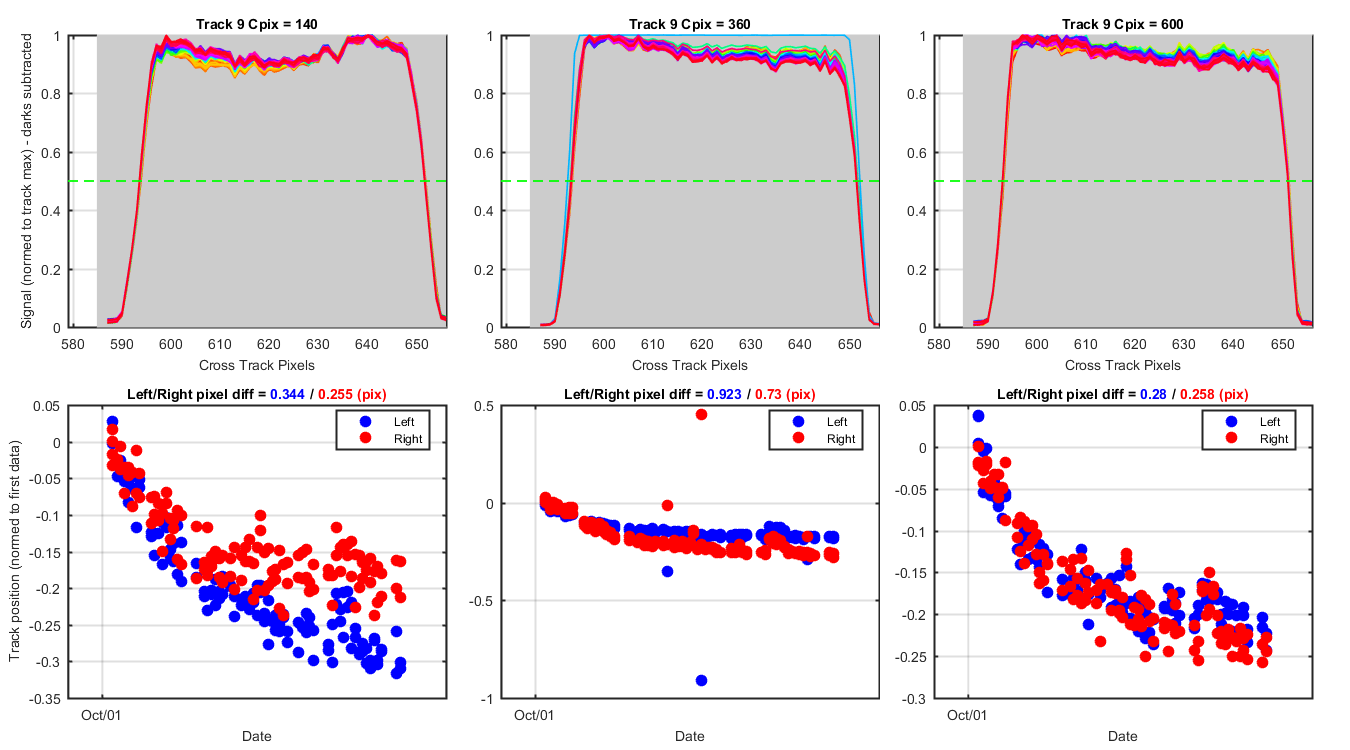
LuTop - Track 9 - Track movement for 3 cross track pixels.
Figure 5
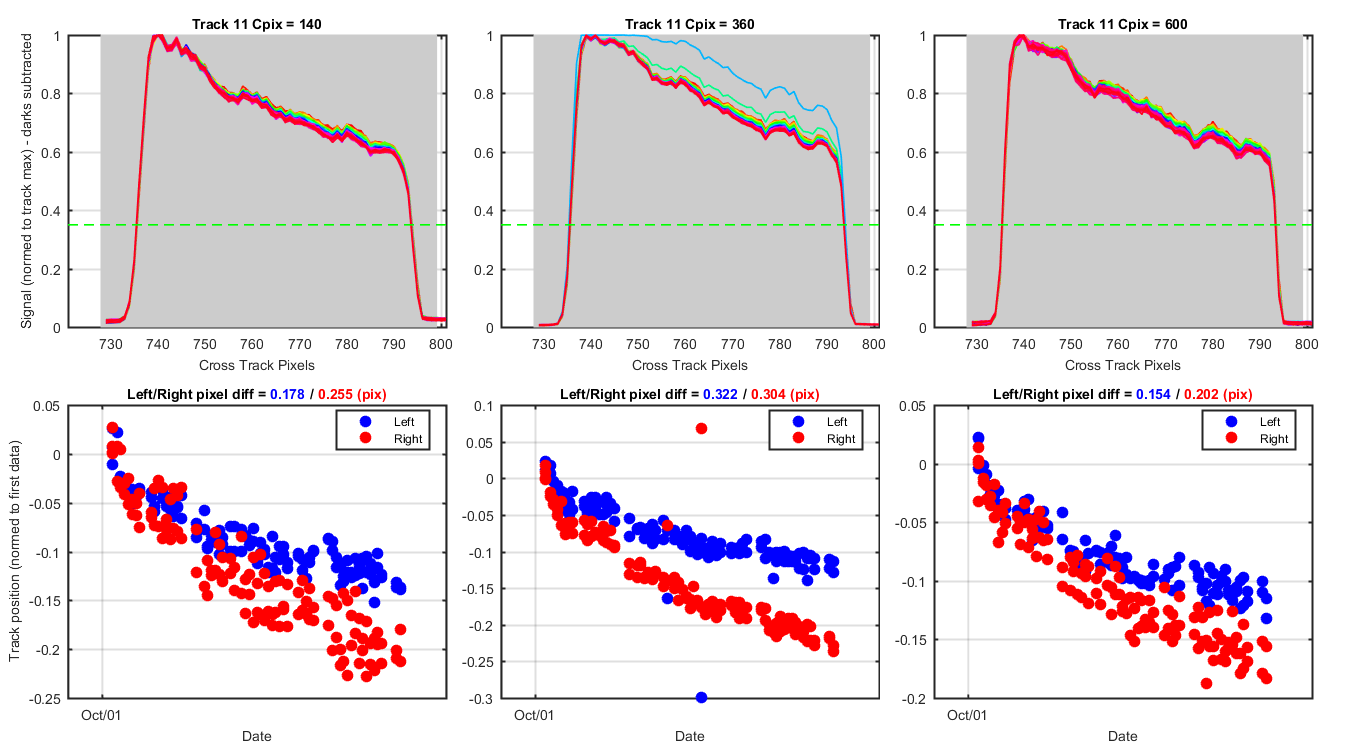
LuMid - Track 11 - Track movement for 3 cross track pixels.
Figure 6
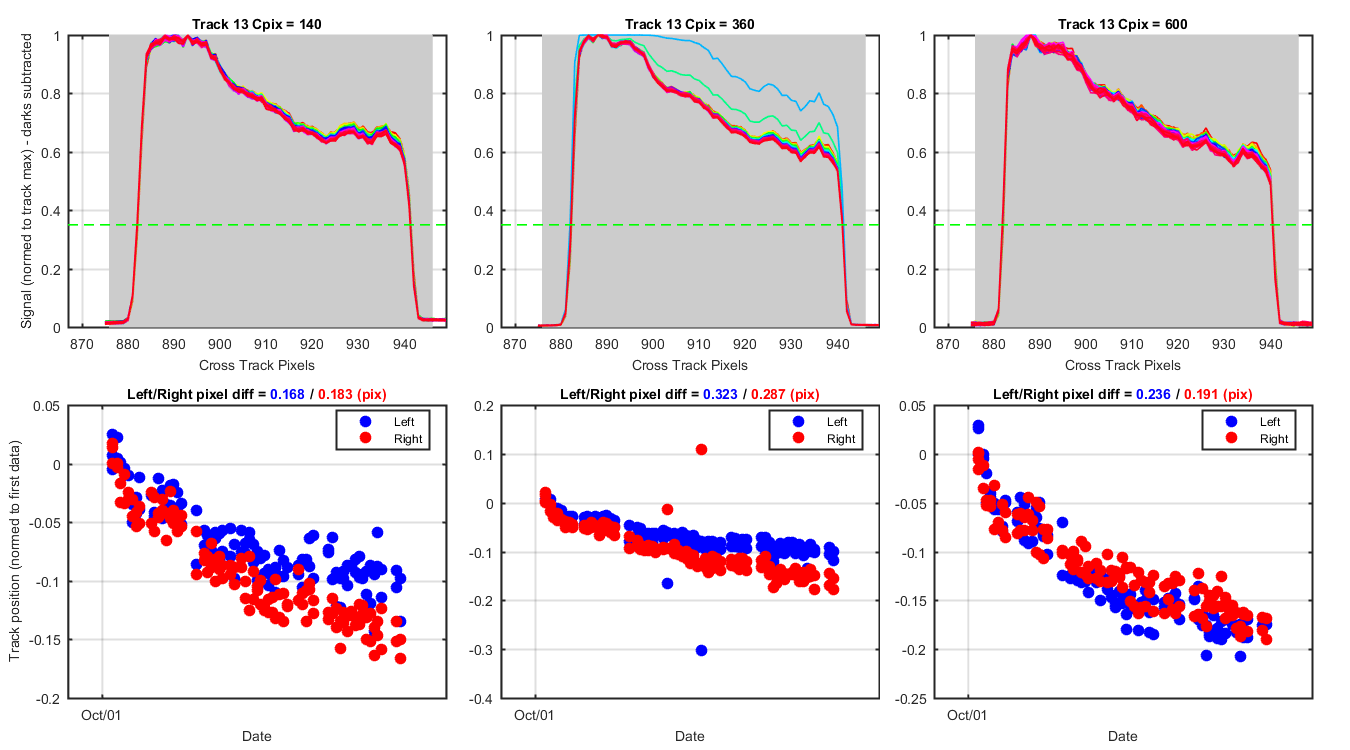
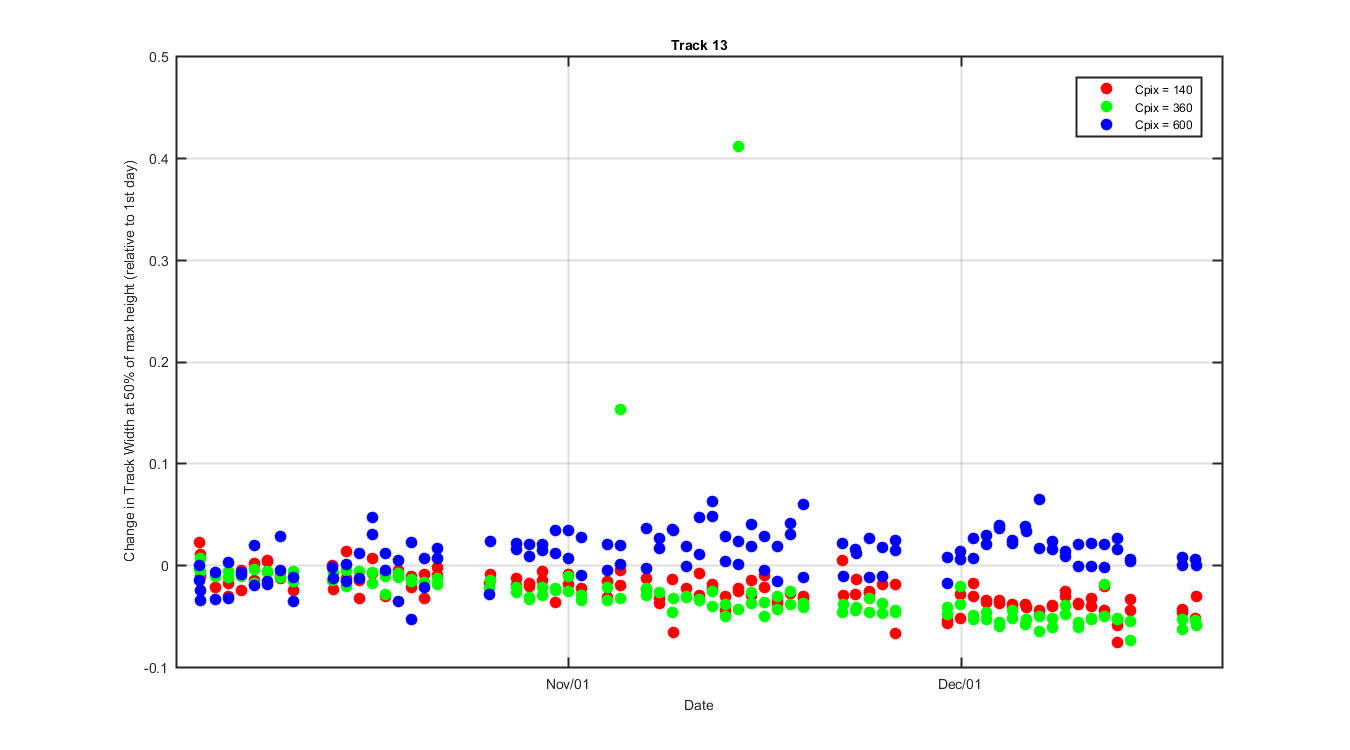
LuBot - Track 13 - Track movement for 3 cross track pixels.
Figure 7
Relative change in track width for each track and cross track pixel
Figure 8
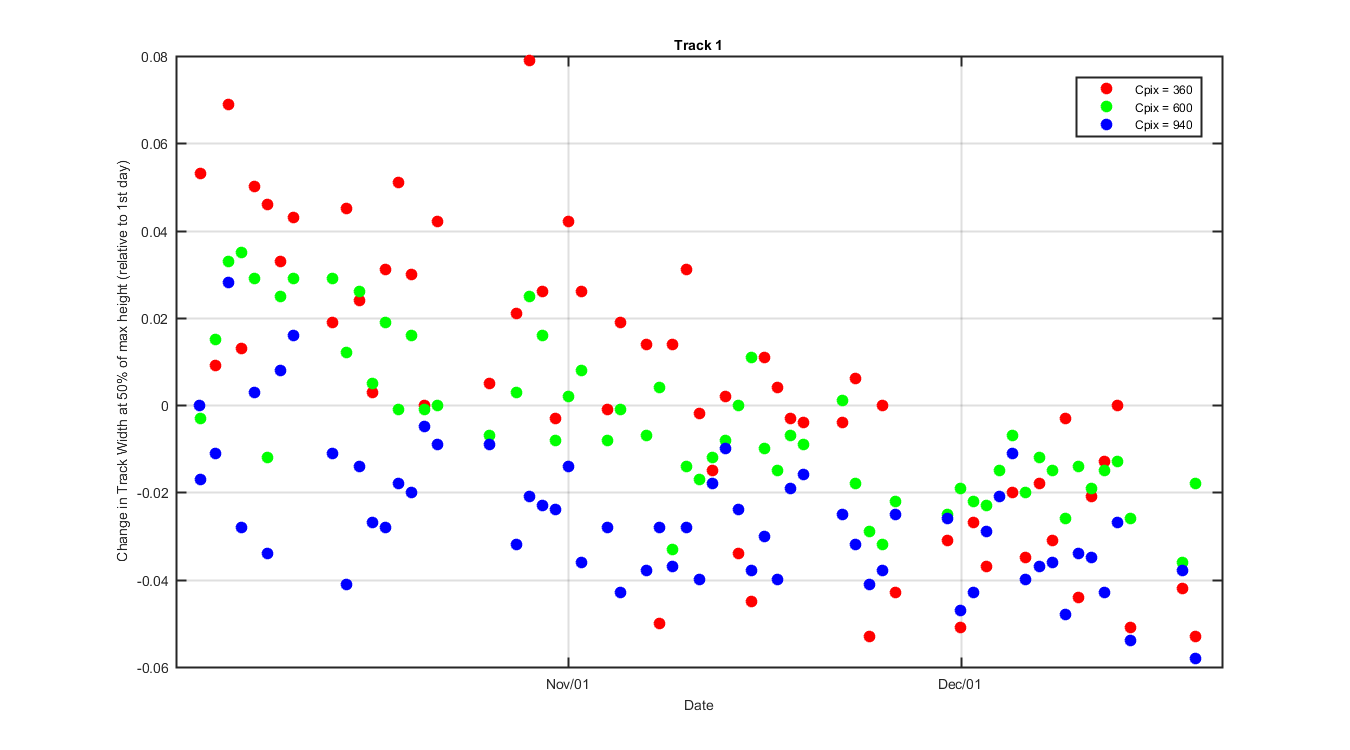
Figure 9
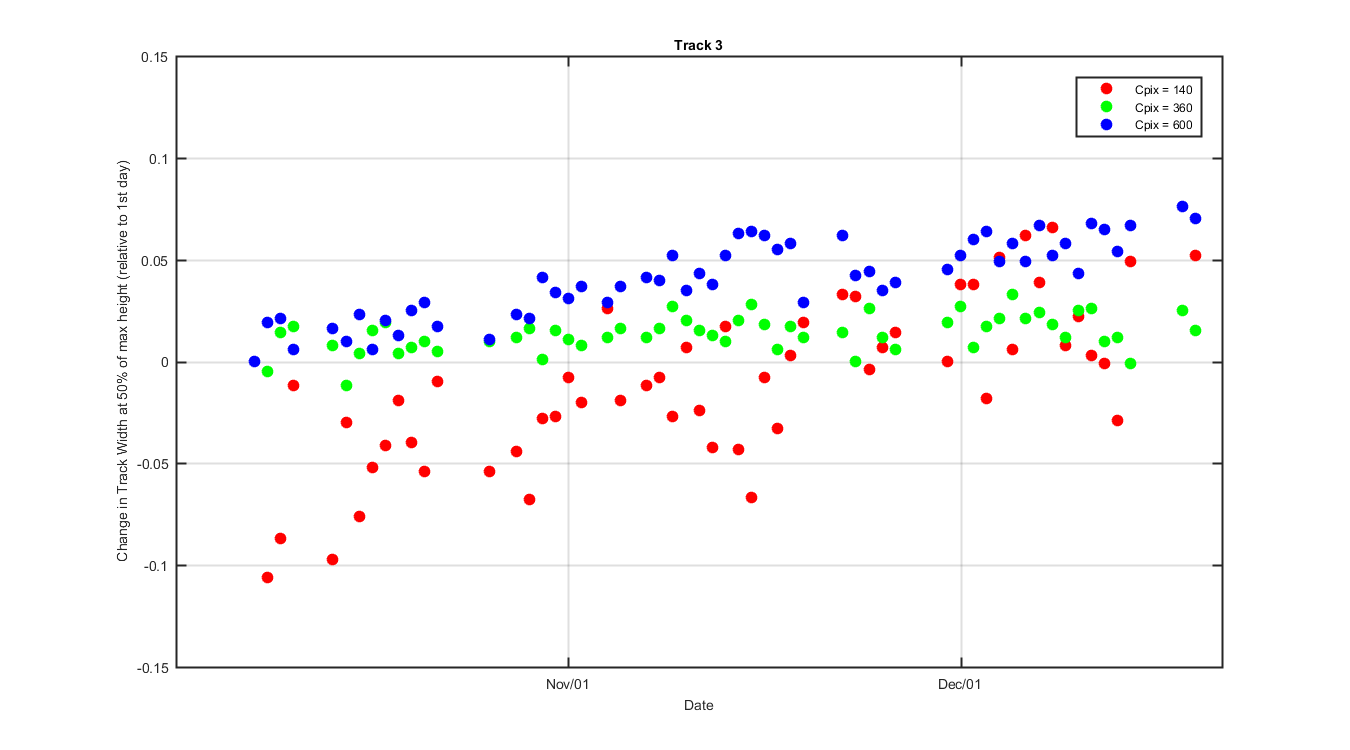
Figure 10
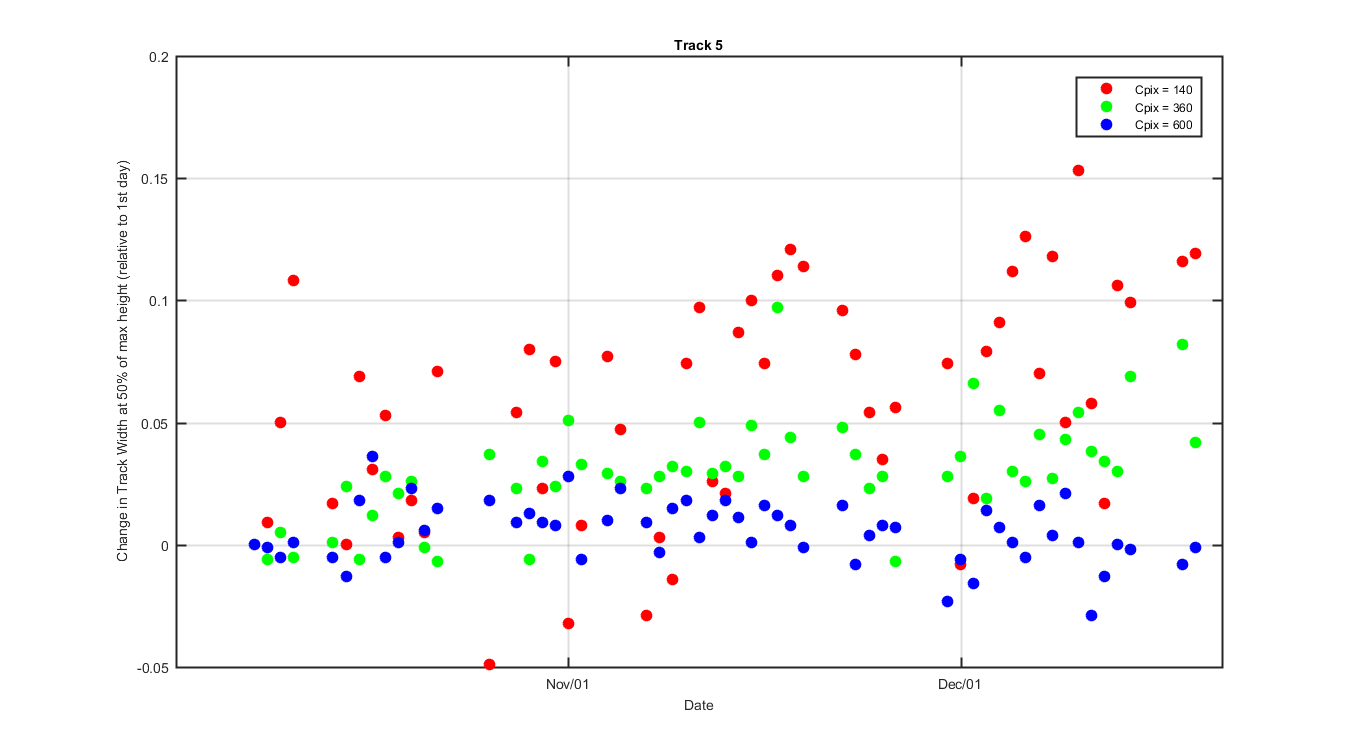
Figure 11
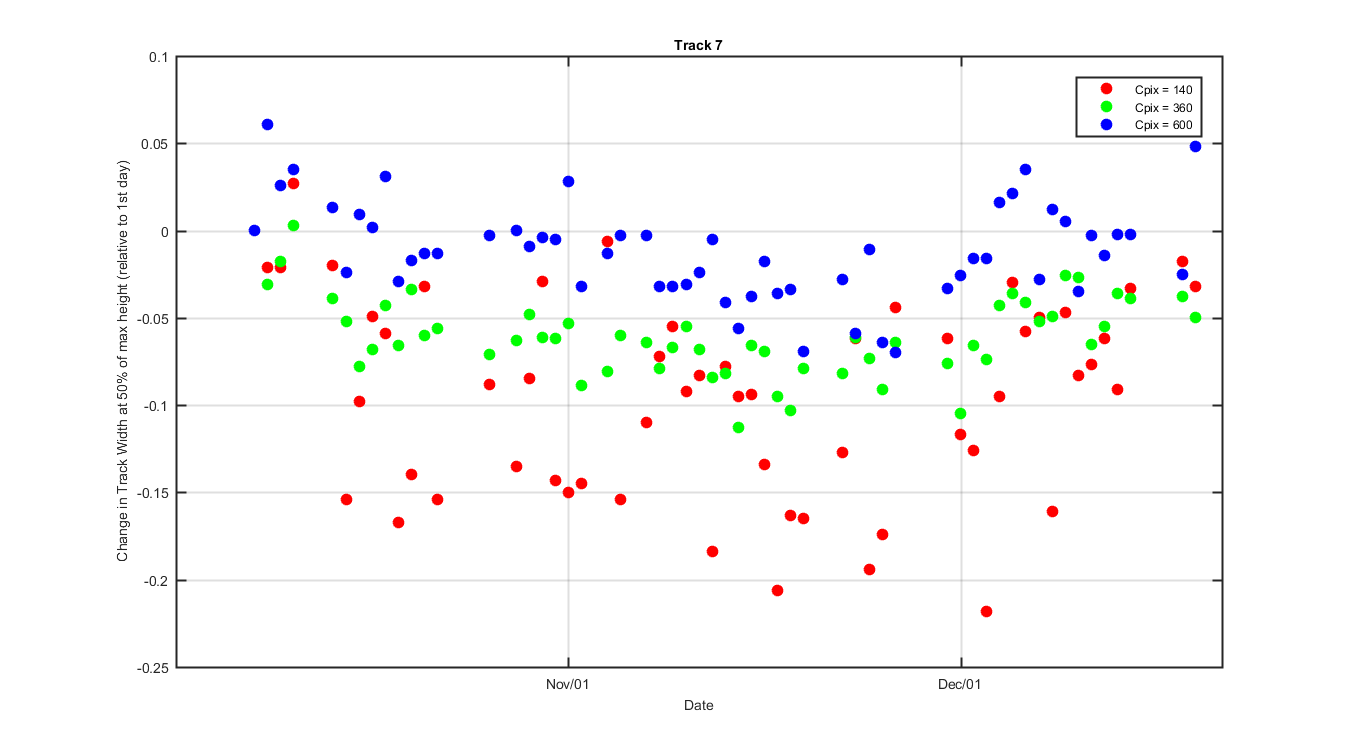
Figure 12
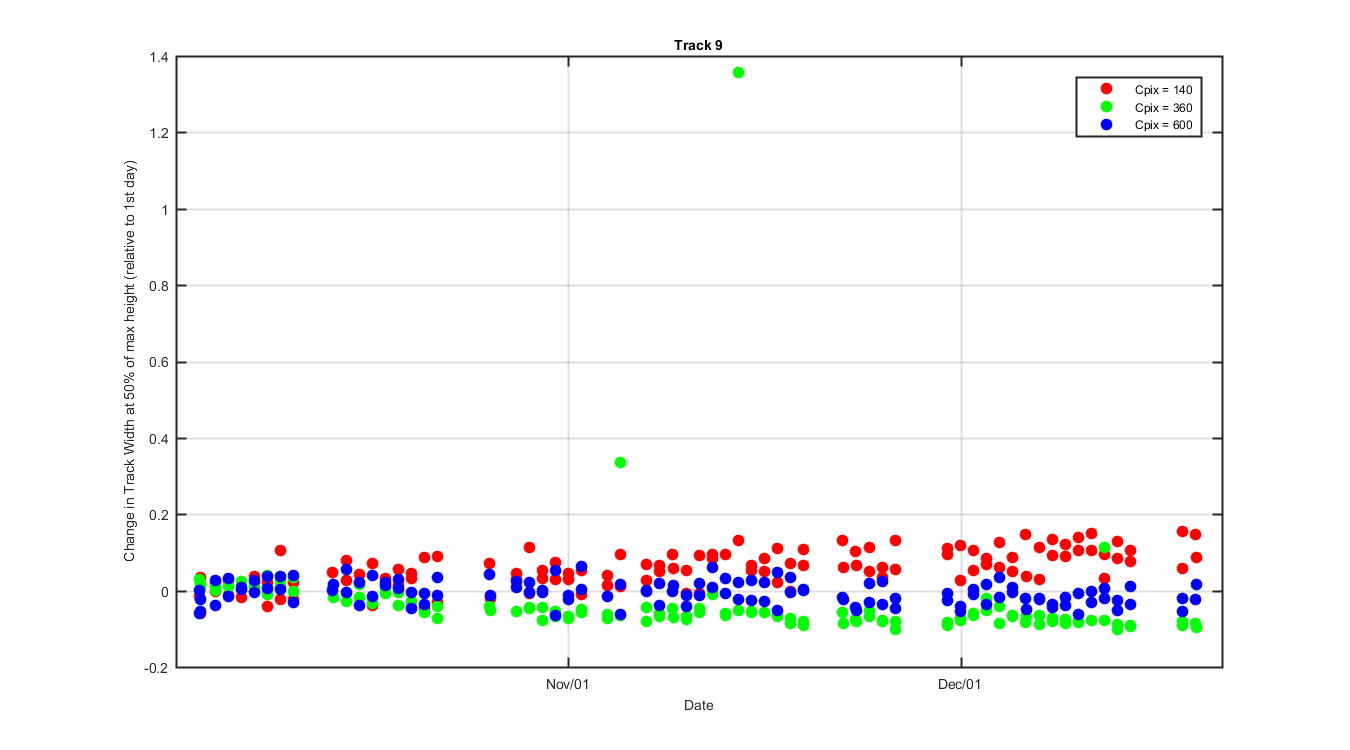
Figure 13
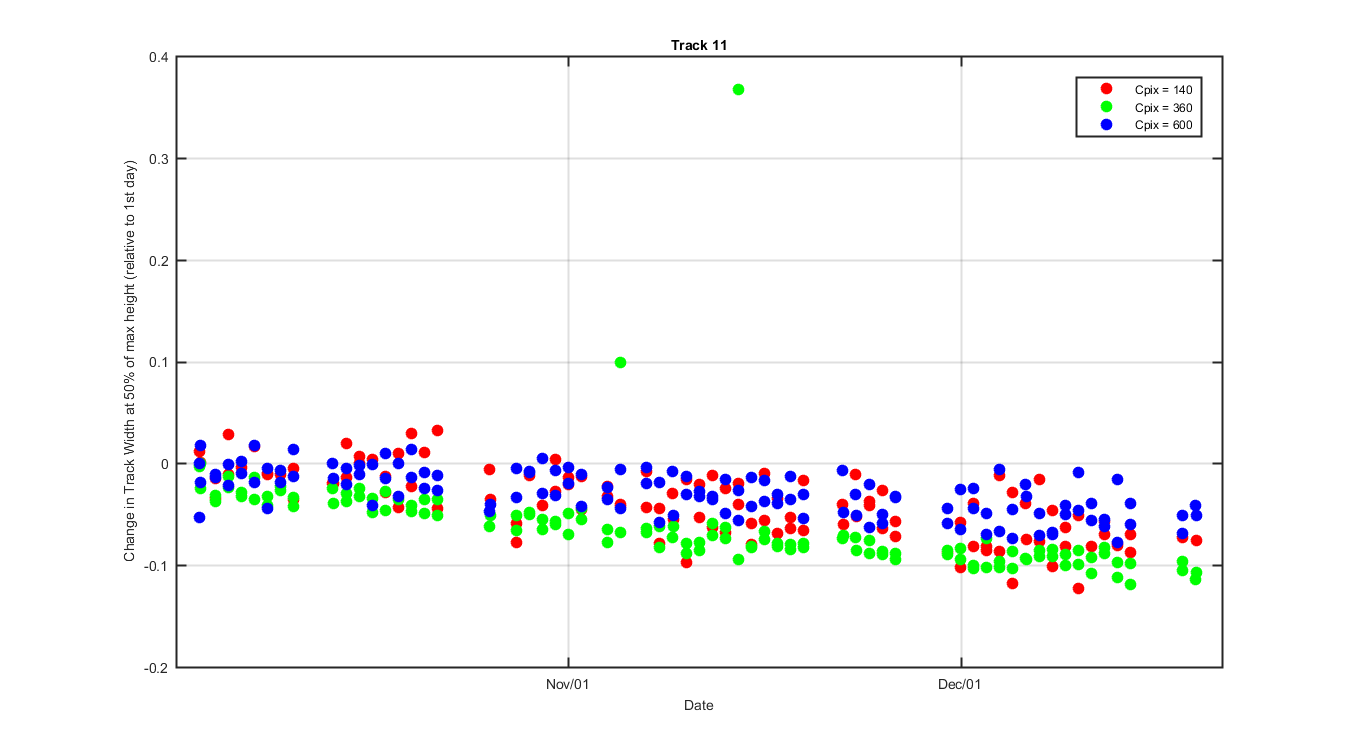
Figure 14
Relative change in left and right track position for each track and cross track pixel
Figure 15
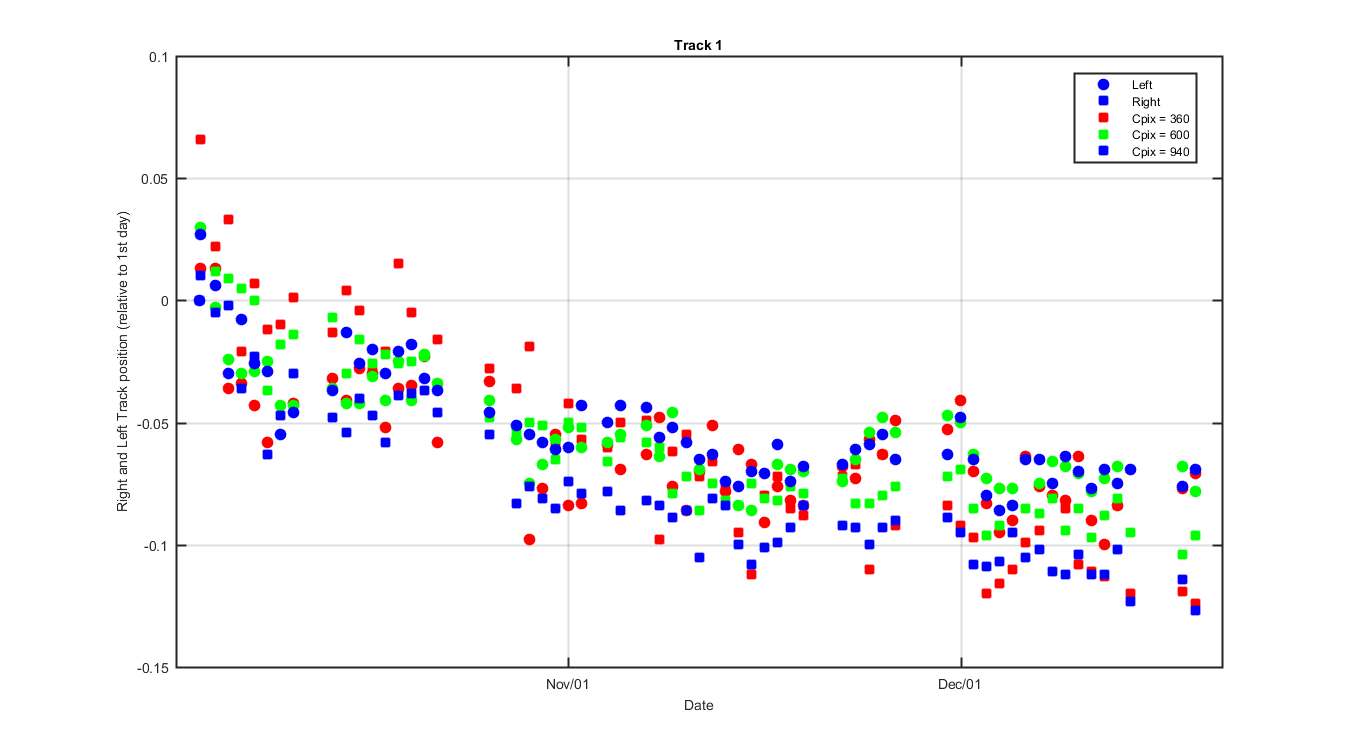
Figure 16
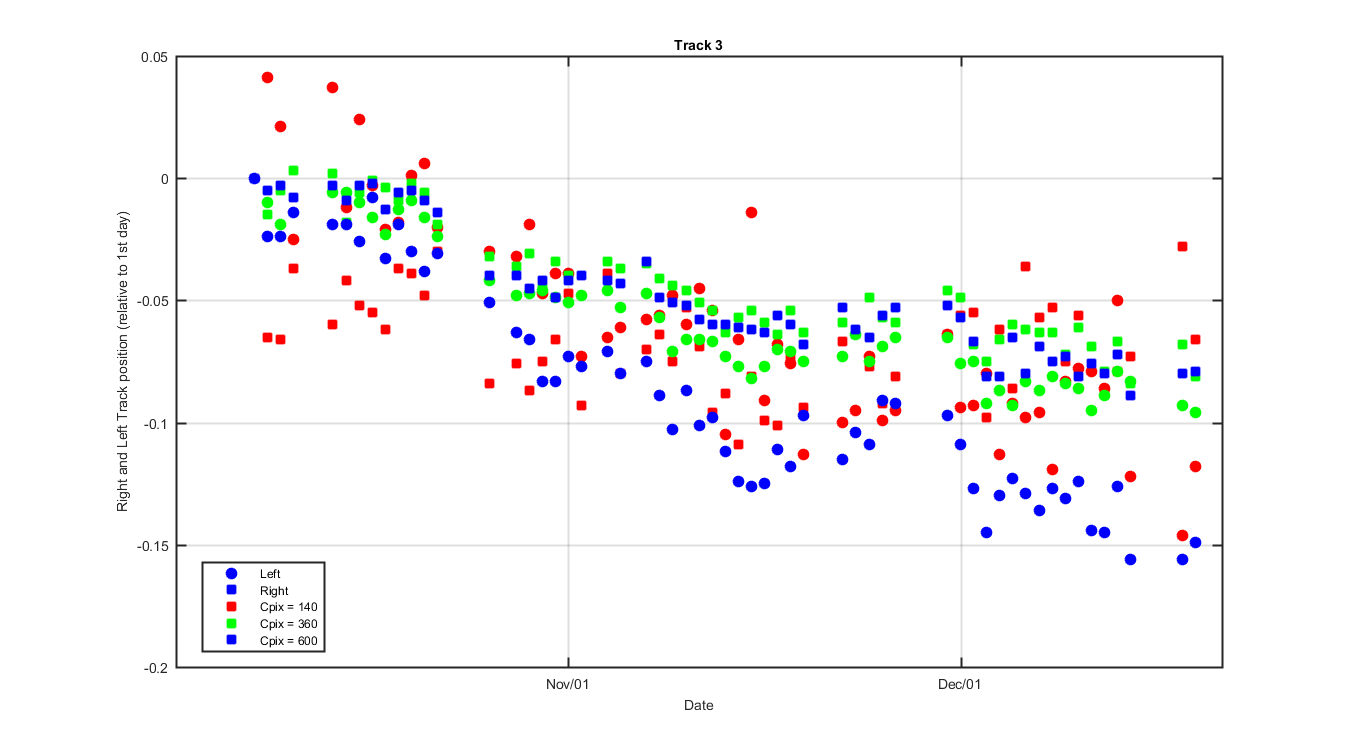
Figure 17
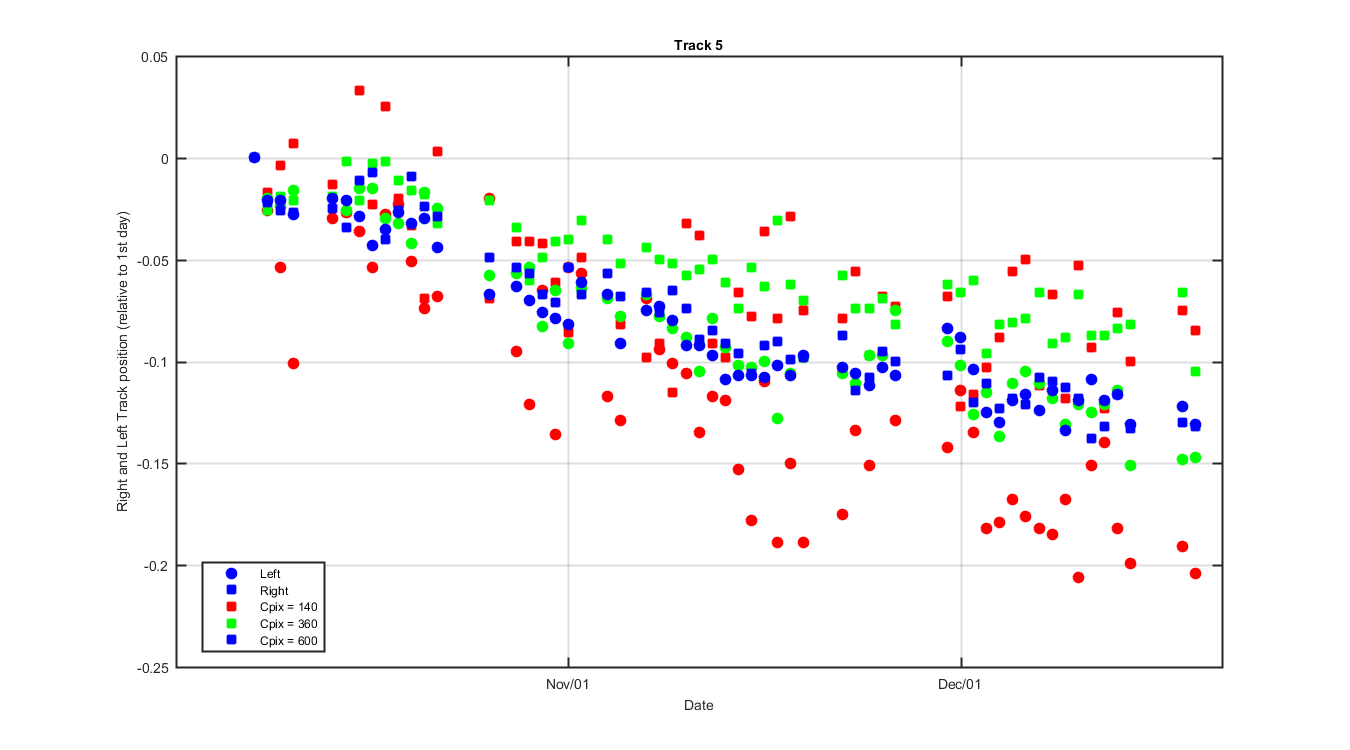
Figure 18
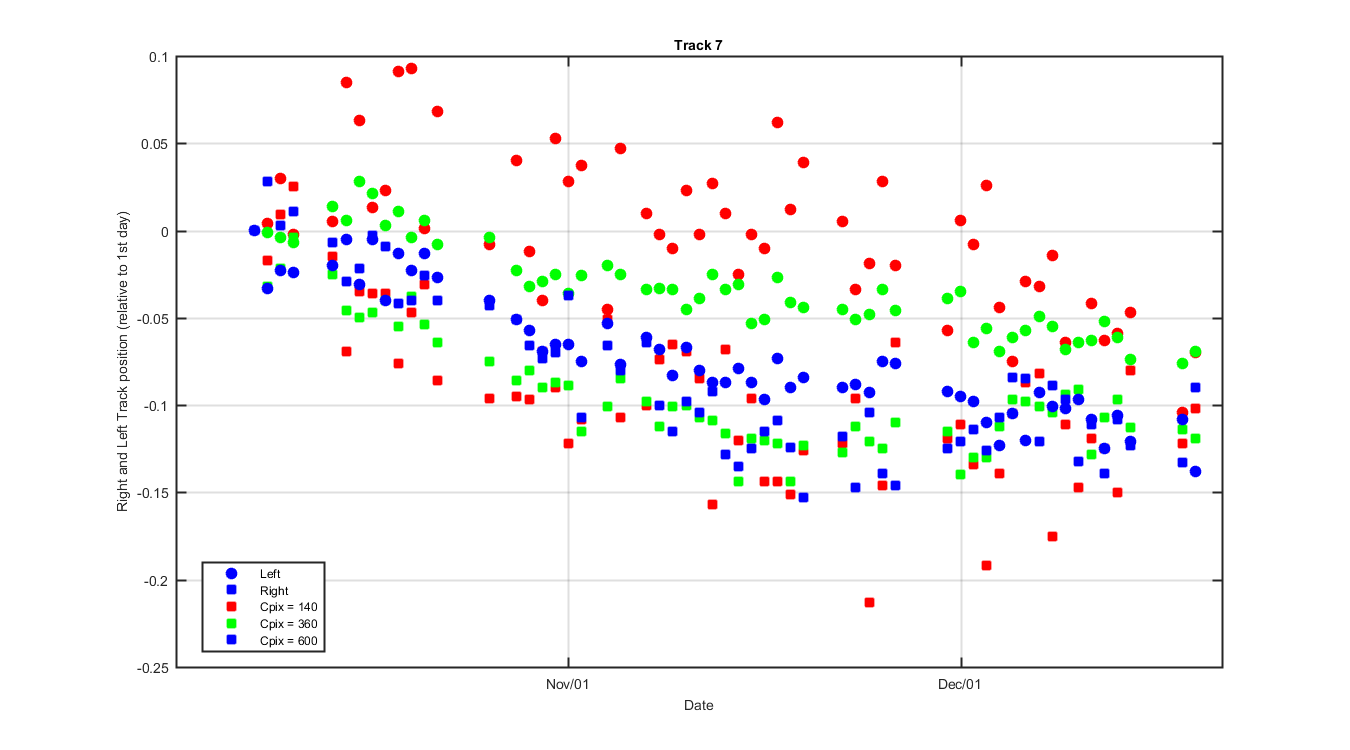
Figure 19
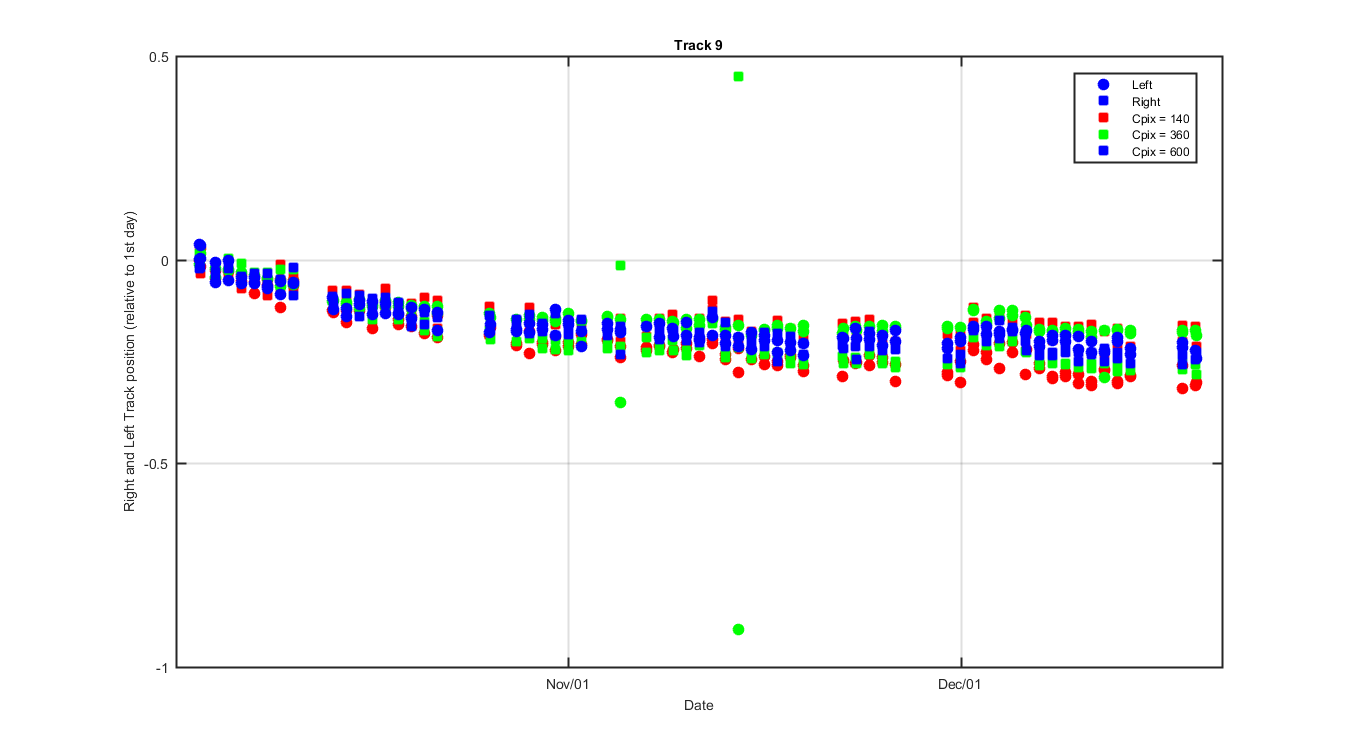
Figure 20
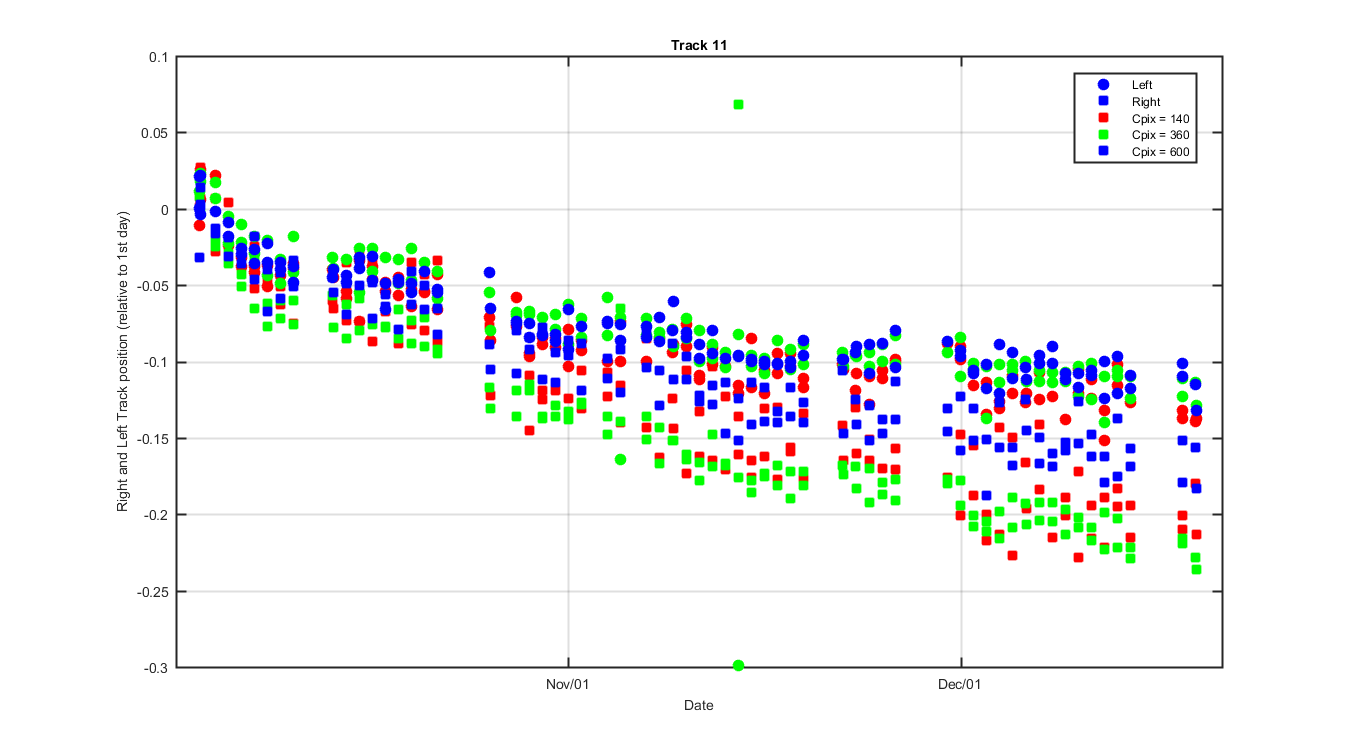
Figure 21