REVISION DATE: 05-Jan-2018 17:09:40
On Dec 16th Art tried to collected the 100 files for the experiment Ken wanted. The light scans where collected from 16 Dec 00:23 to 00:46. The zenith angles where 53-56 degrees. So the integration times are 30 secs. Art said that is why we did not get the 100 files. The program timed out because the int times where too long.
Because of the number of files we where not going to take a lot of darks. Ken wondered if the tracks between tracks 1 and 9 could be used as a dark. That is what this page will try and answer. It would make sense that if you are far enough from a illumiated track the cross track light would go to zero. But that does not seem to be the case here. When track 1 and 9 are illuminated track 5 has 3 "dark" tracks between it an the illuminated tracks. But still have a shape to the "dark" track. So I dont think we will be able To use the Track 5 "dark" as a real dark.
Note that this days data was VERY cloudy so the data can not be used for the variability study any way.
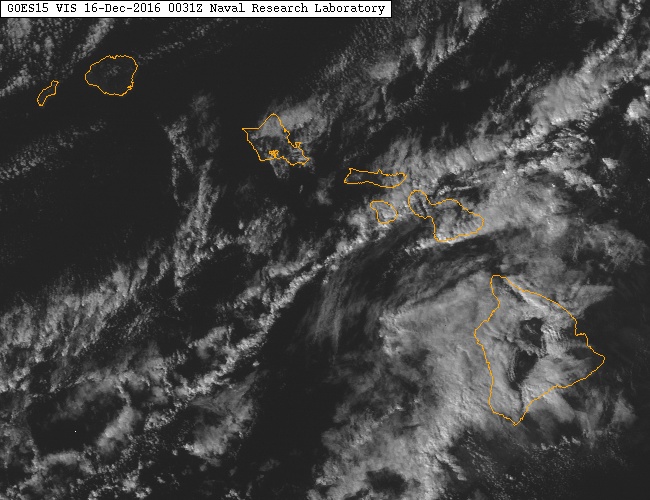
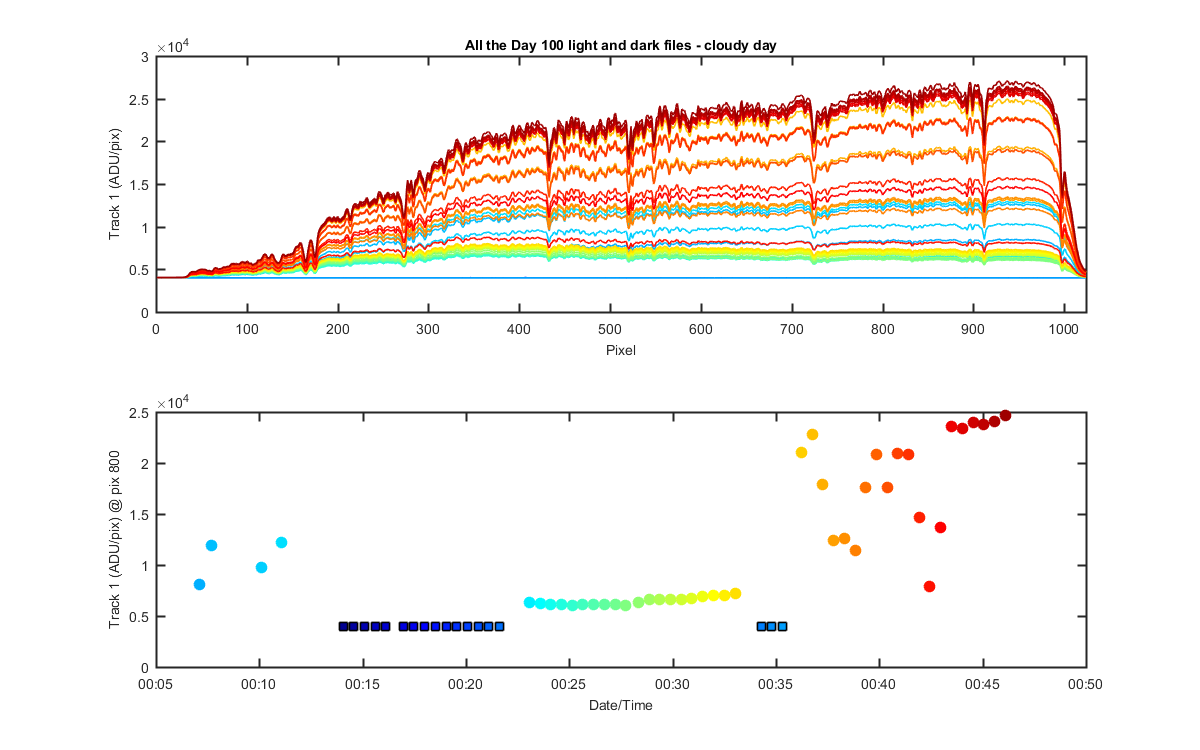
Figure 1: Track 1 Es data. Top panel is the spectral data lites and darks. The bottom panel is the same data at one pixel (see y-axis label) with time on the x-axis
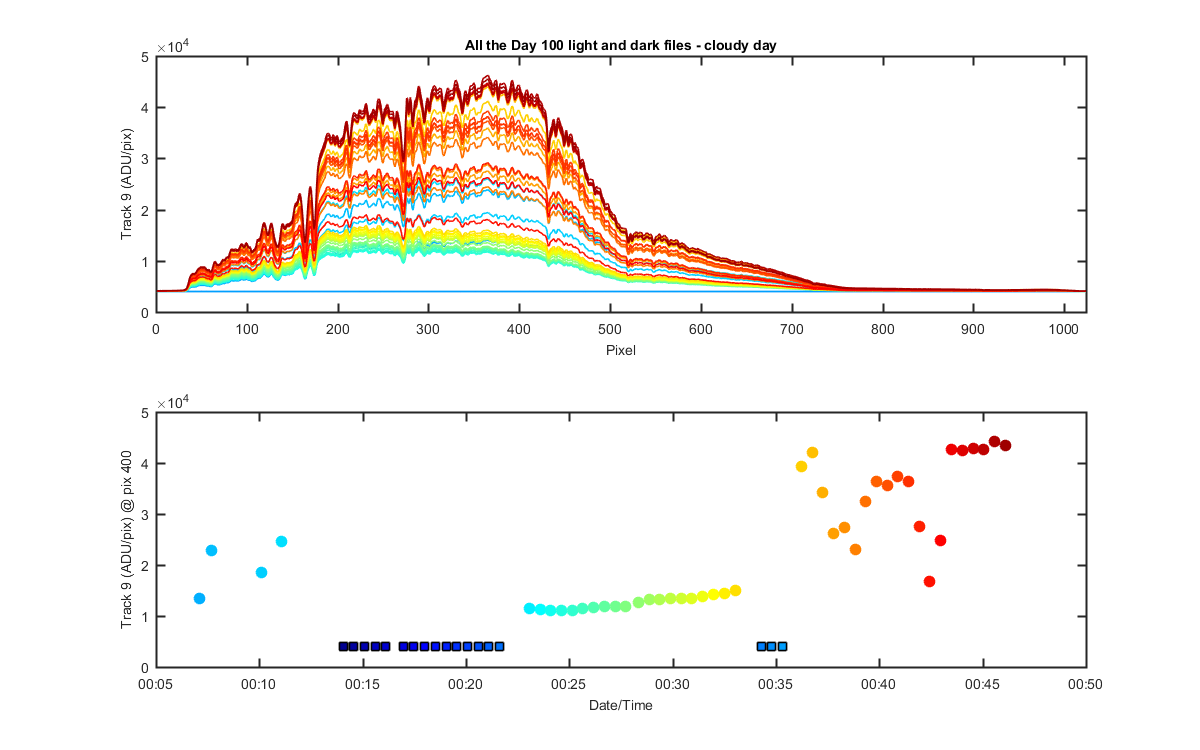
Figure 2: Track 9 LuTop data. Top panel is the spectral data lites and darks. The bottom panel is the same data at one pixel (see y-axis label) with time on the x-axis
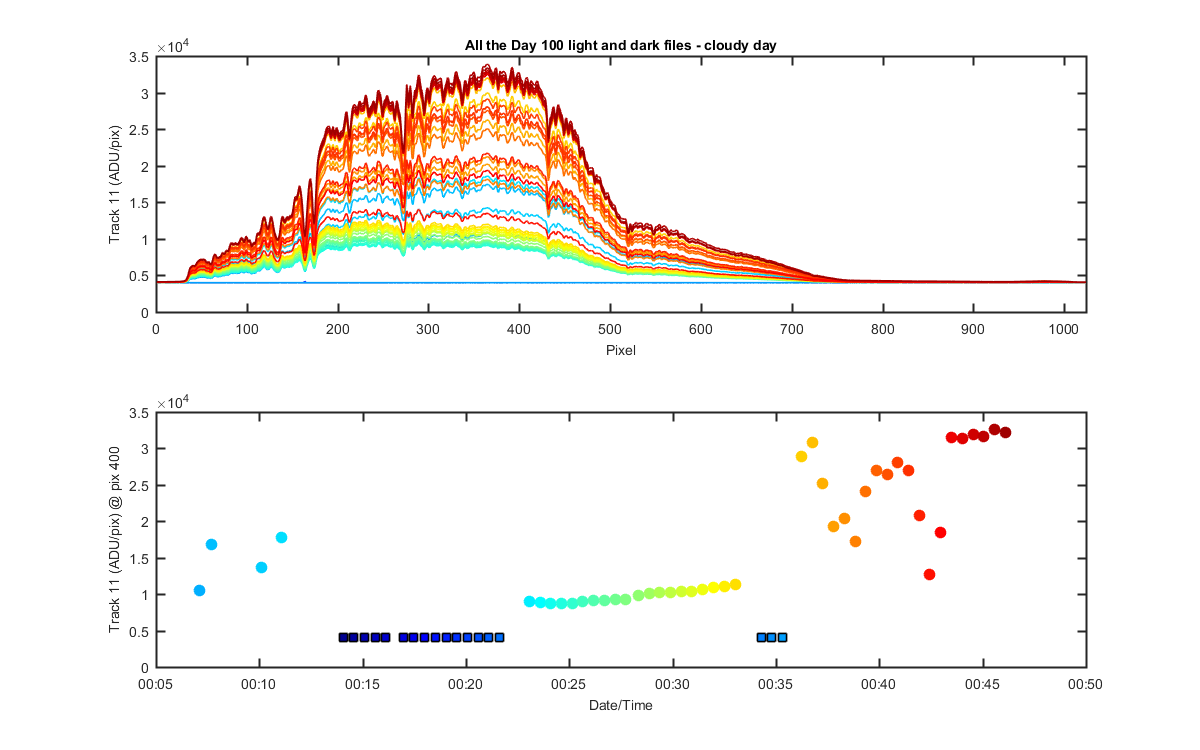
Figure 3: Track 11 LuMid data. Top panel is the spectral data lites and darks. The bottom panel is the same data at one pixel (see y-axis label) with time on the x-axis
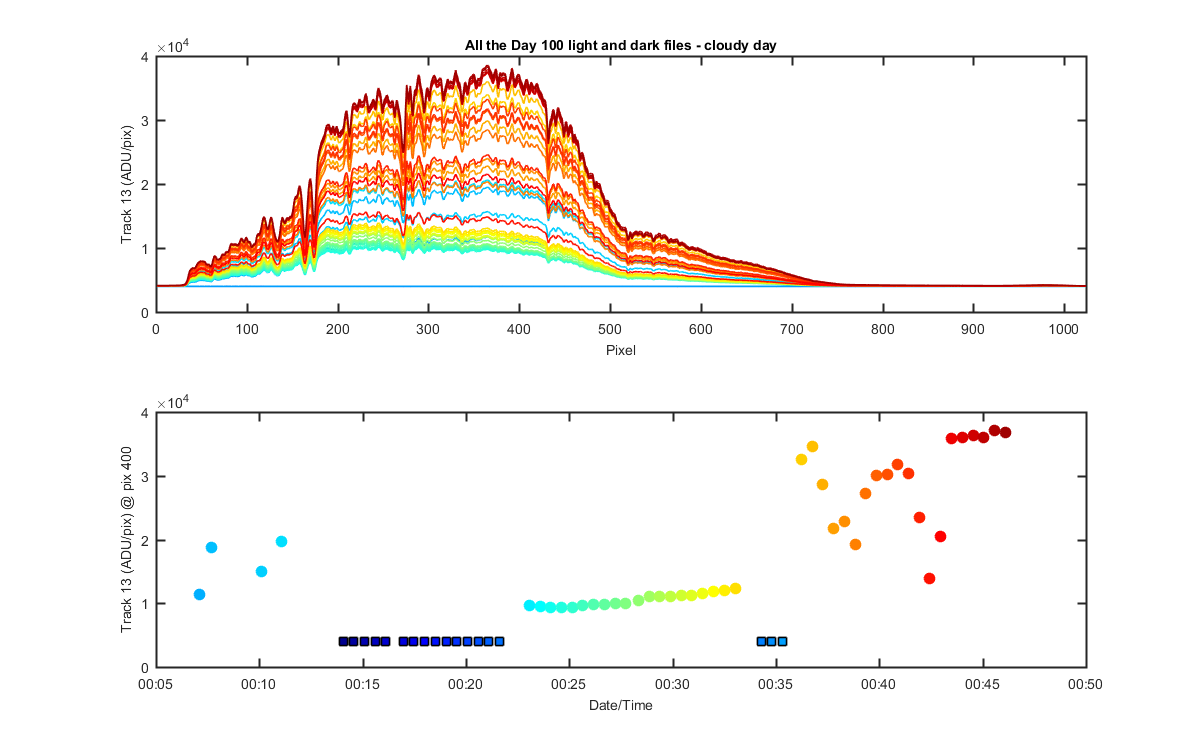
Figure 4: Track 13 LuBot data. Top panel is the spectral data lites and darks. The bottom panel is the same data at one pixel (see y-axis label) with time on the x-axis
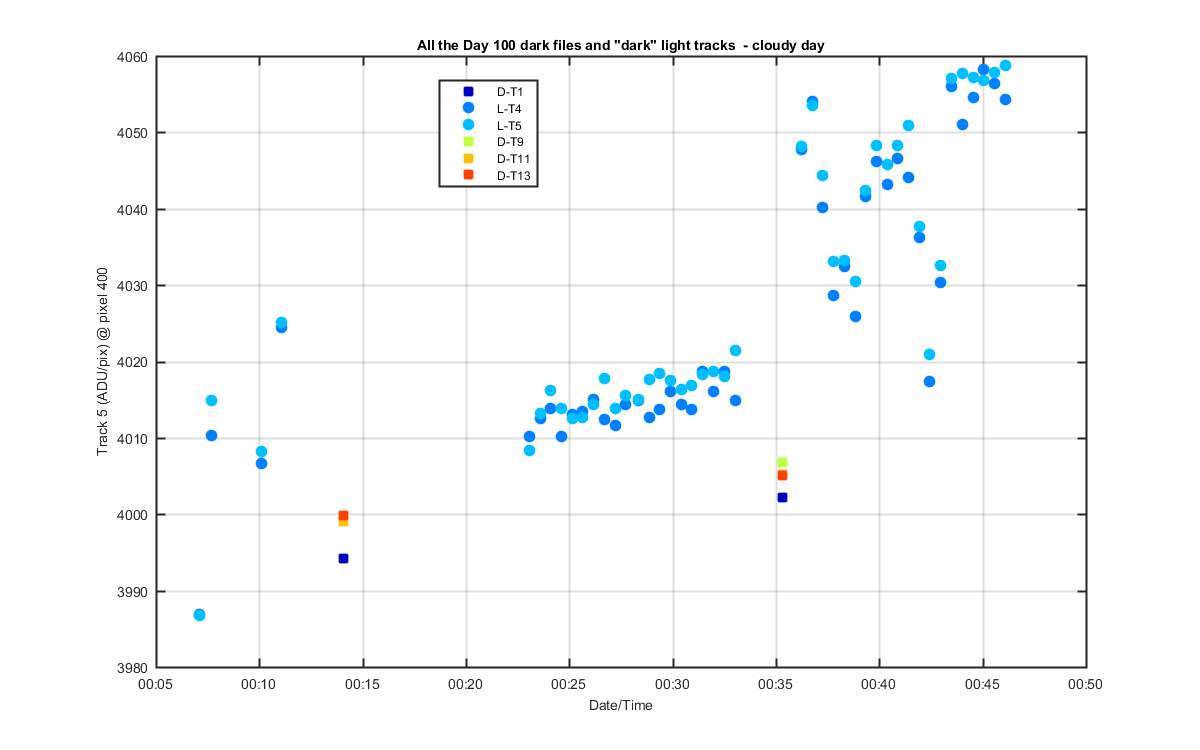
Figure 5: All the real darks files (squares) for Tracks 1, 9, 11 and 13 at one pixel and all the light scans for the darkest tracks (4 and 5) (circles). You can see the darkest light tracks are still higher than the real darks. Next a look at the spectral differences
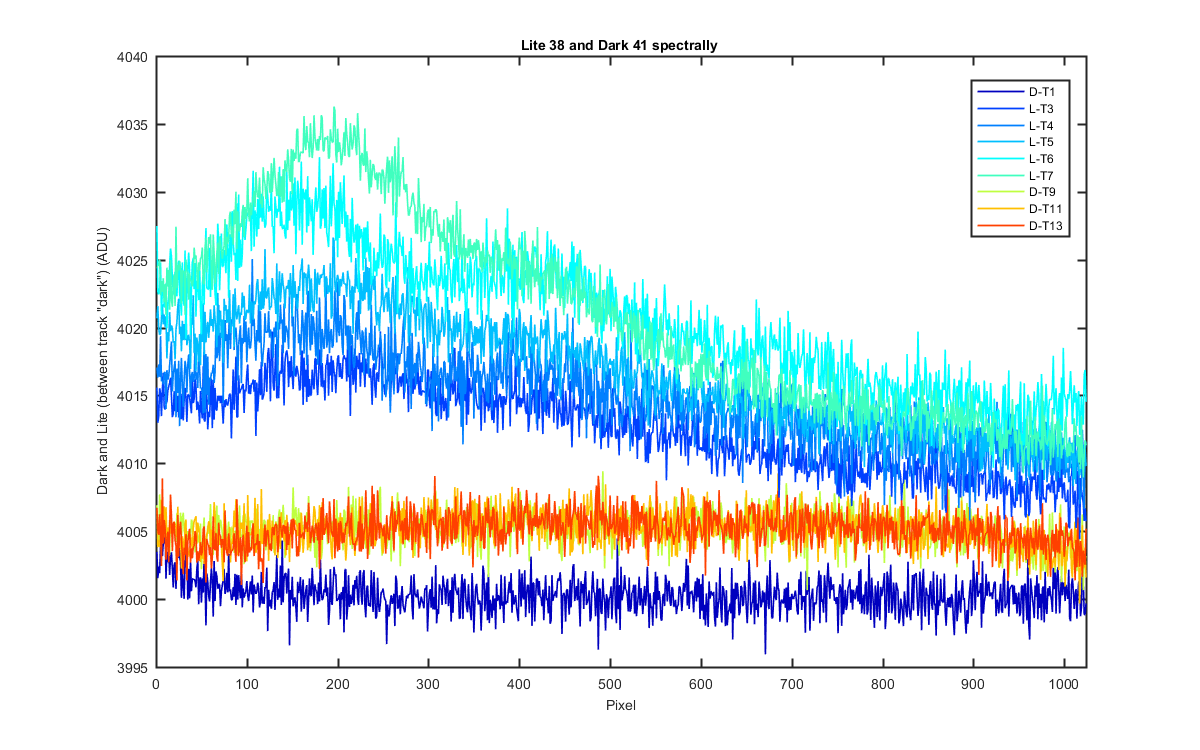
Figure 6: Looking at the real darks, D in the legend, and the "dark" tracks , L in the legend. You can see the cross track stray light is effecting track 5 even with 3 tracks on both sides not illuminated. I seem to remember this not being the case with other data sets. 3 track between should be enough. So I will look at other data sets to see if I can explain.
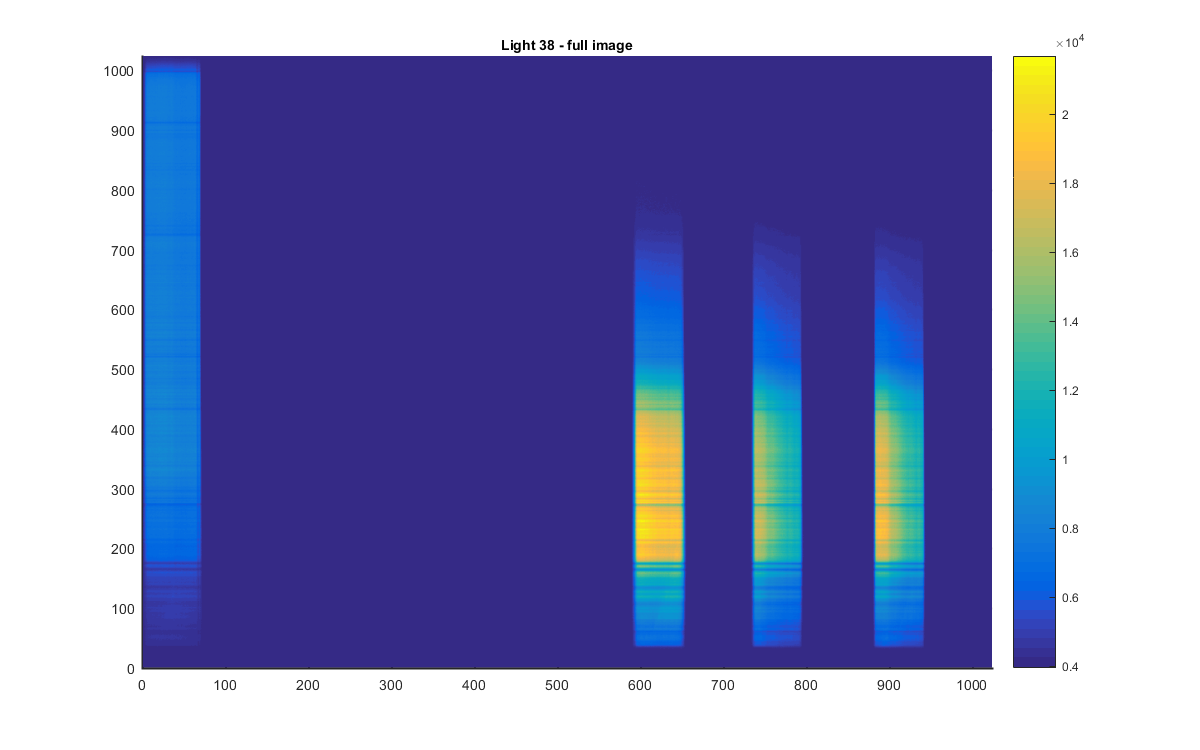
Figure 7: Full image of light image 38
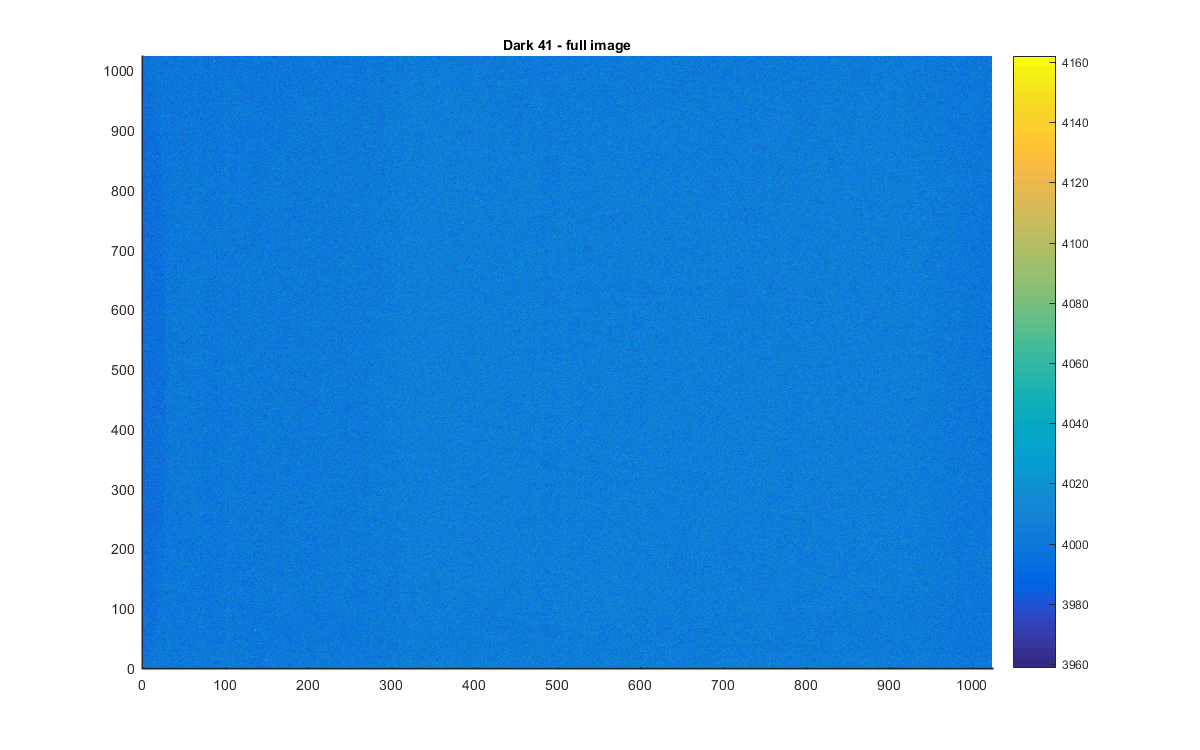
Figure 8: Full image of dark image 41
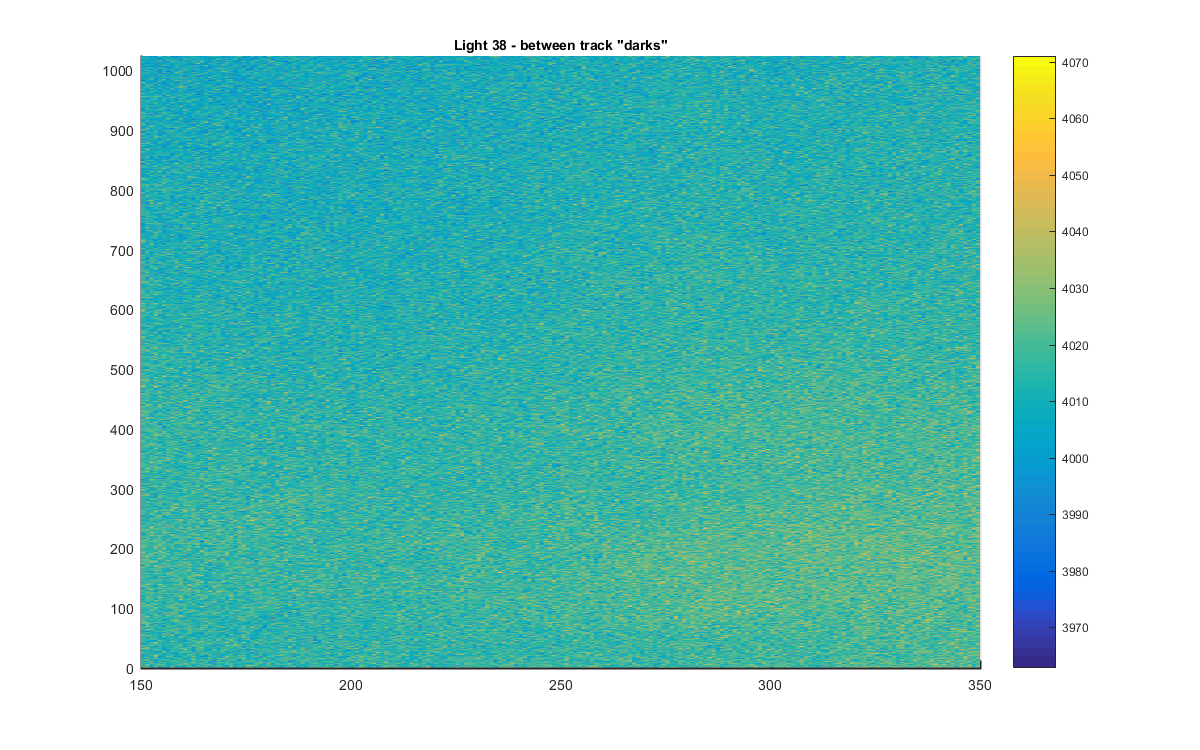
Figure 9: Zoomed image of light image 38 for the "dark" tracks in question. This is on the same color scale as the imge 41 dark. This shows the image version of Figure 6
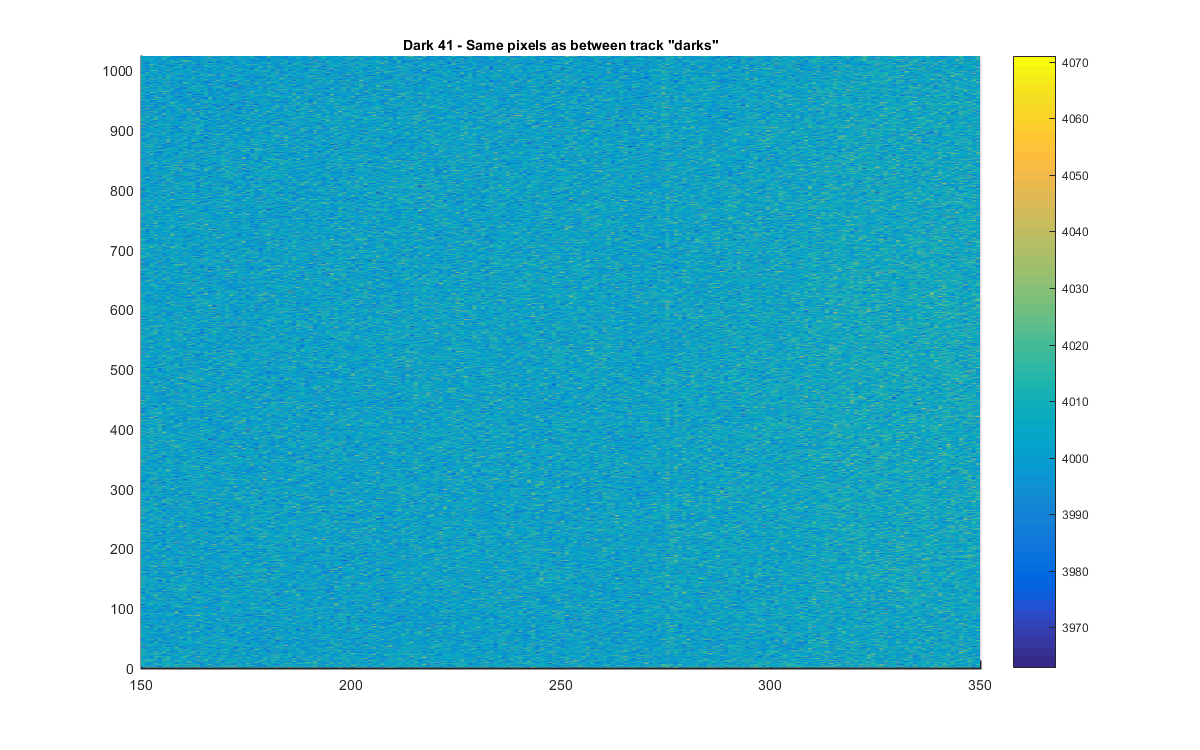
Figure 10: Zoomed image of dark image 41 for the tracks between 1 and 9 (but beyond the larger cross track data).
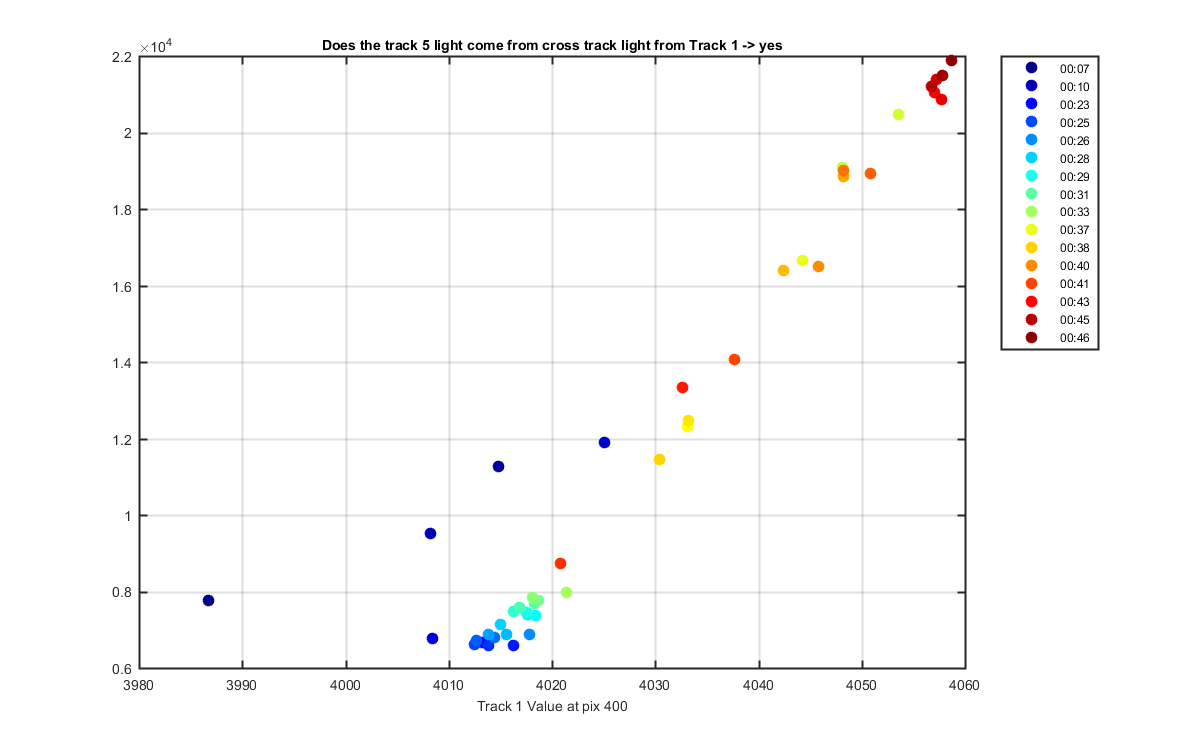
Figure 11: To double check that this is cross track light from Track 1 I plotted the track 5 and 1 data from pixel 400 and they are correlated. ARGH.