REVISION DATE: 17-Oct-2017 11:54:20
The files below are the background collected during the lastest in-water tests, these are from an automated program . Backgrounds where collected in groups of 3. 3 backgrounds, 5 lites , 3 backgrounds and then the process is repeated a second time for a Es/Lu dataset. See the file numbering below. The first data set is for the Lu tracks only, the second data set is for the Es and Lu data.
File numbers for the data sets collected
1  Background
2  Background
3  Background
4  Signal - Es/Lu tracks only
5  Signal - Es/Lu tracks only
6  Signal - Es/Lu tracks only
7  Signal - Es/Lu tracks only
8  Signal - Es/Lu tracks only
9  Background
10 Background
11 Background
%--------------------------------
12 Background
13 Background
14 Background
15 Signal - Lu Tracks
16 Signal - Lu Tracks
17 Signal - Lu Tracks
18 Signal - Lu Tracks
19 Signal - Lu Tracks
20 Background
21 Background
22 Background
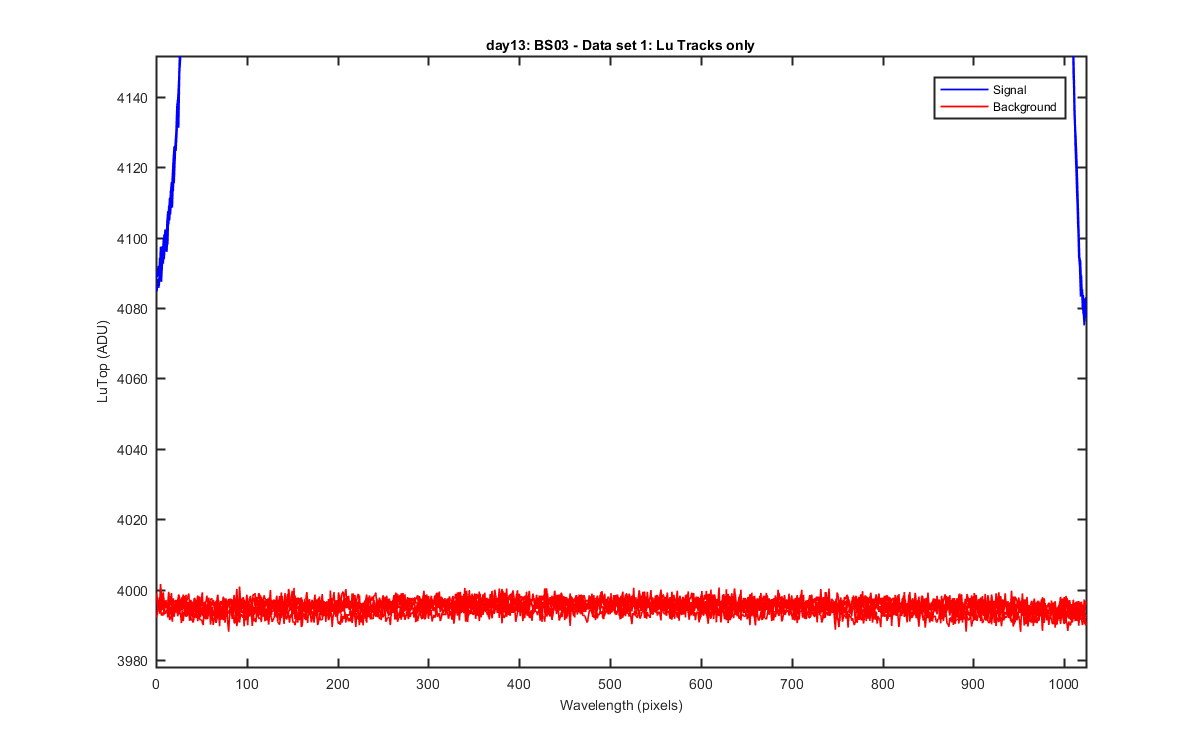
Data set 1 LuTop data and the backgrounds taken before and after the data set. The background are more stable than the M261 backgrounds.
Figure 1
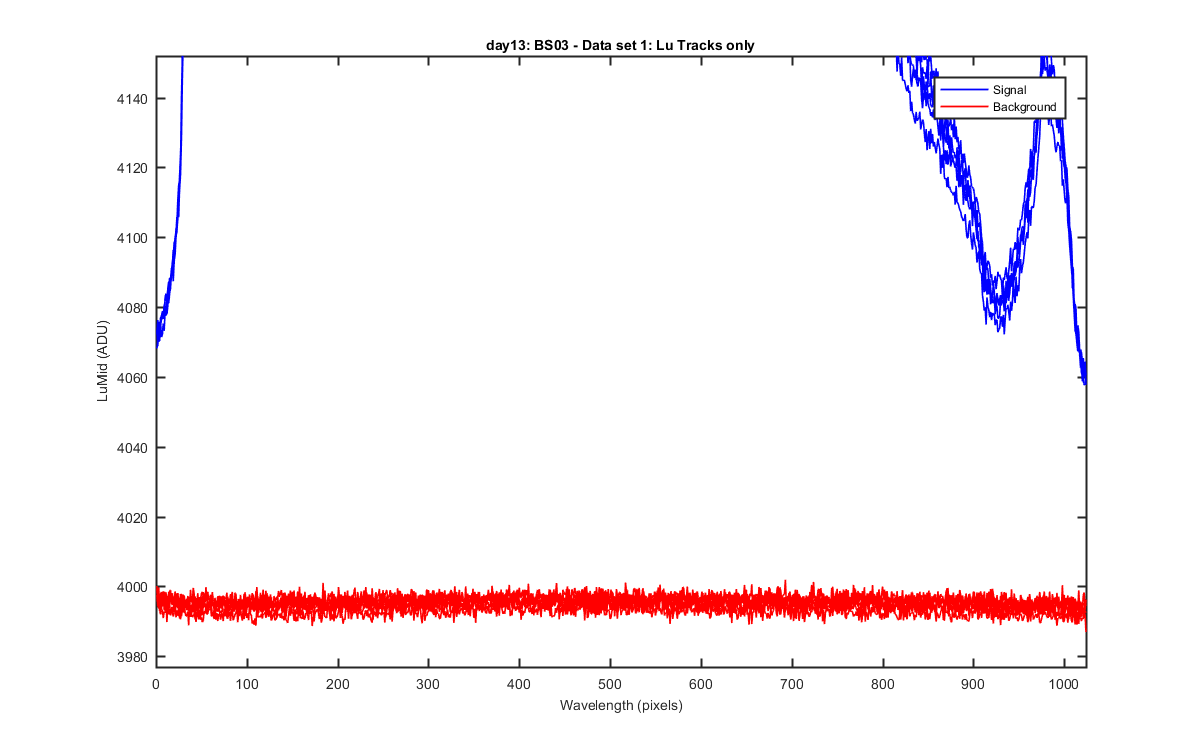
Data set 1 LuMiddata and the backgrounds taken before and after the data set. The background are more stable than the M261 backgrounds.
Figure 2
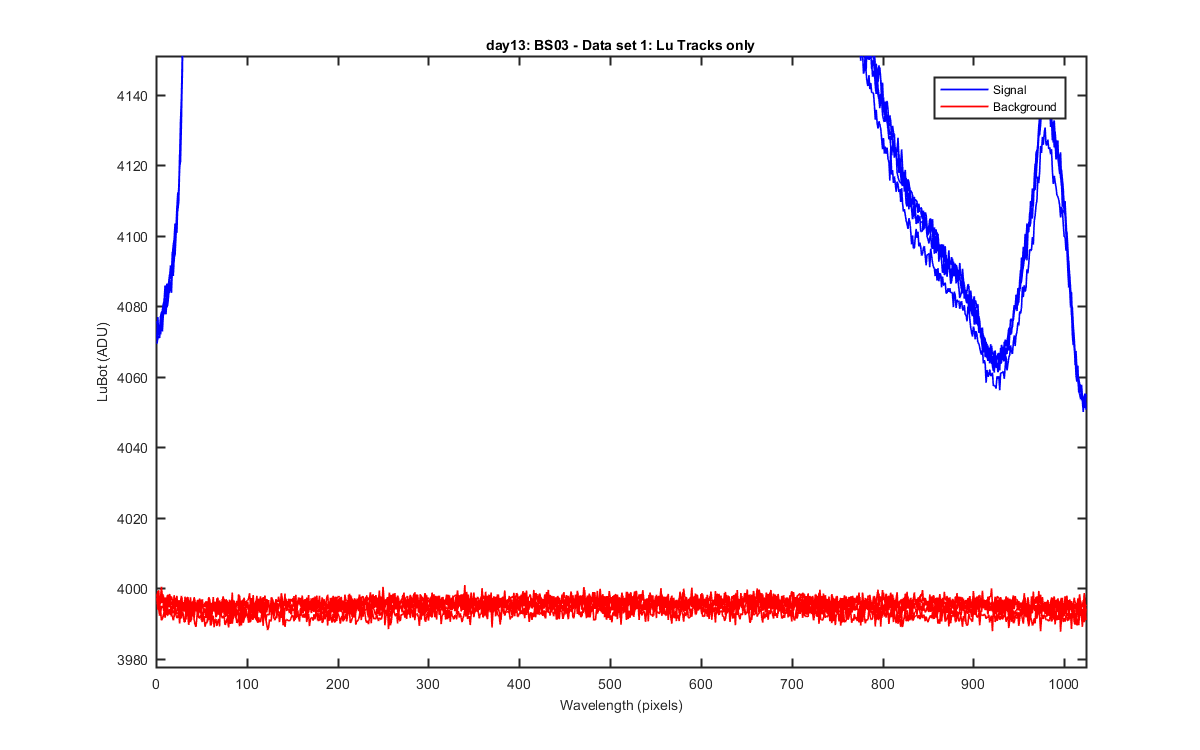
Data set 1 LuBot data and the backgrounds taken before and after the data set. The background are more stable than the M261 backgrounds.
Figure 3
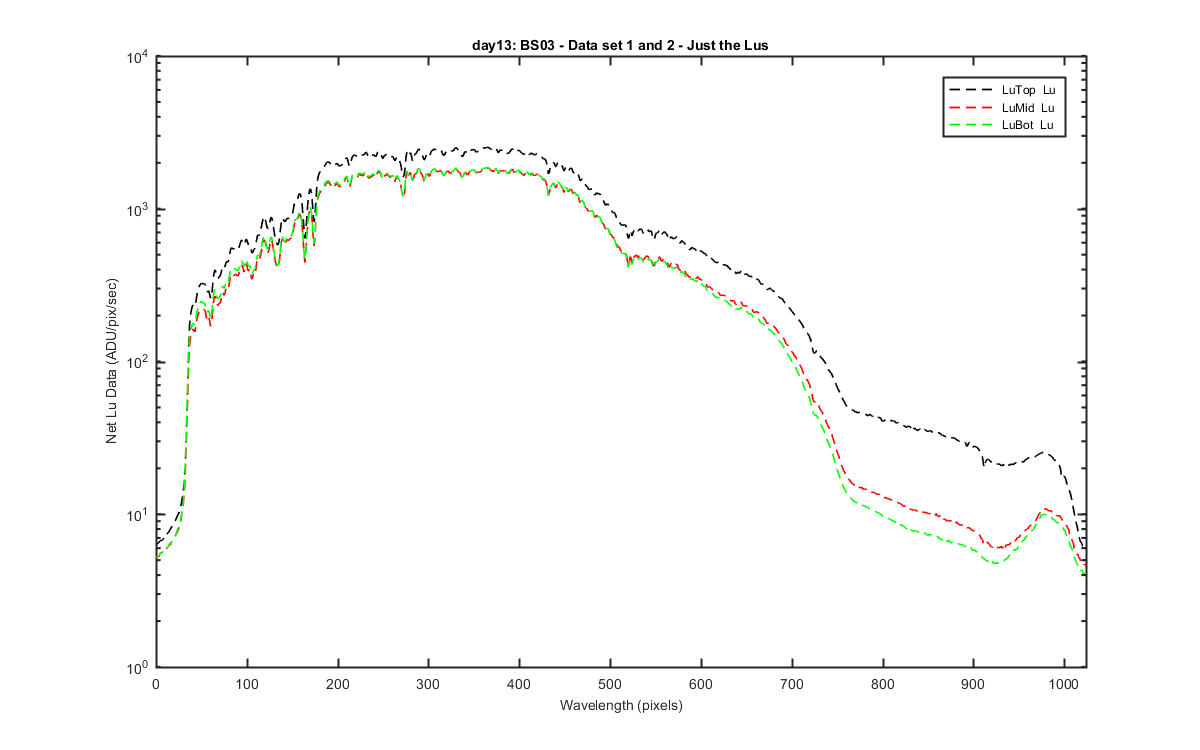
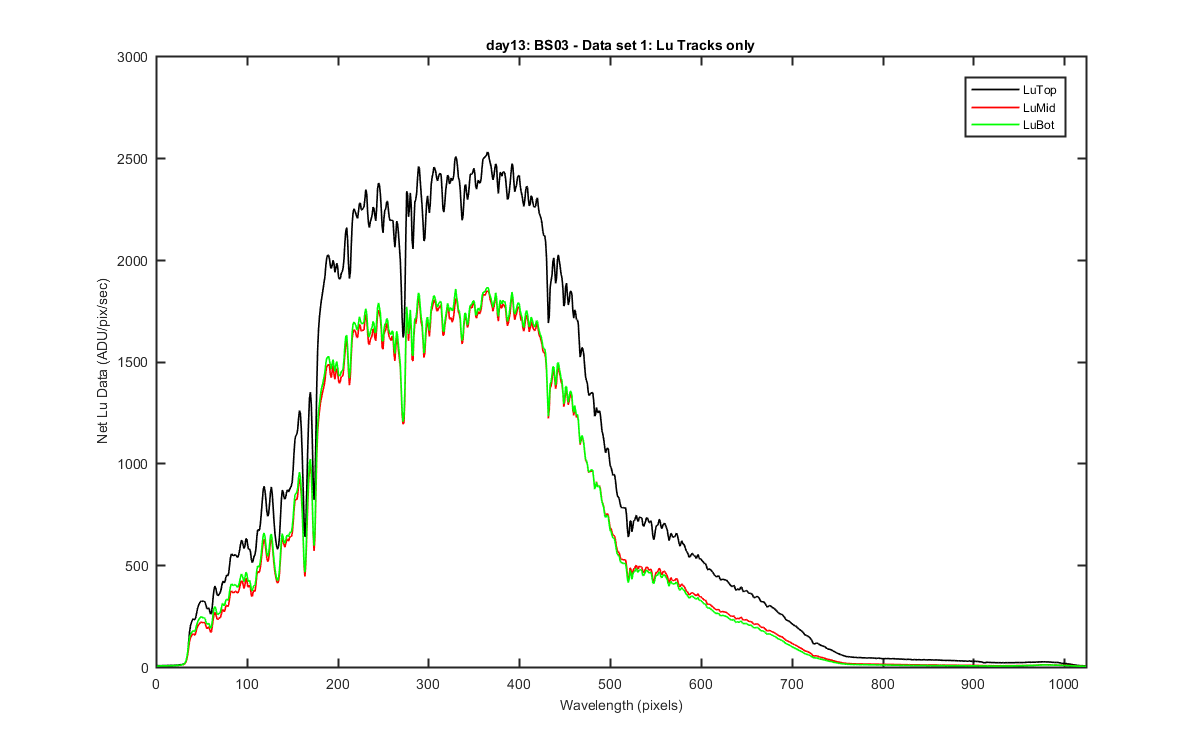
Net signal for each Lu. By net I mean an average of the 5 lites for data set 1 and the 6 backgrounds taken before and after the lites. These where each meaned and then subtracted from each other and divided by int time.
Figure 4
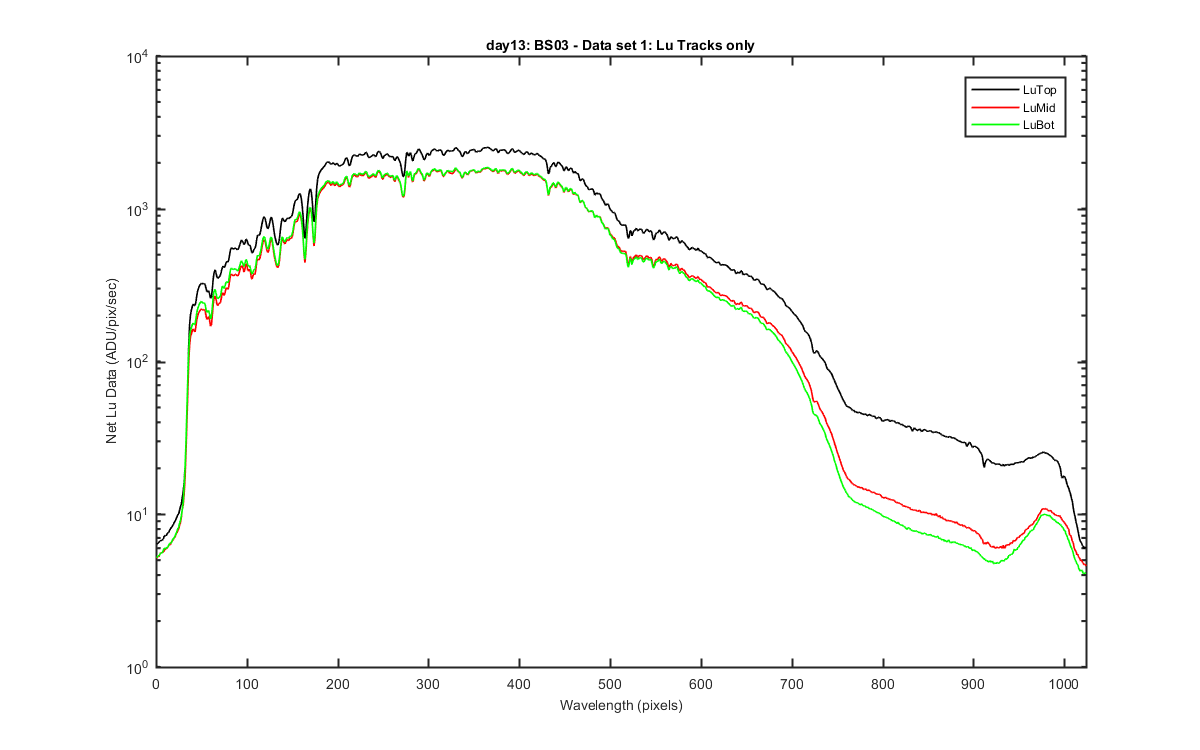
Logged version of the Net data.
Figure 5
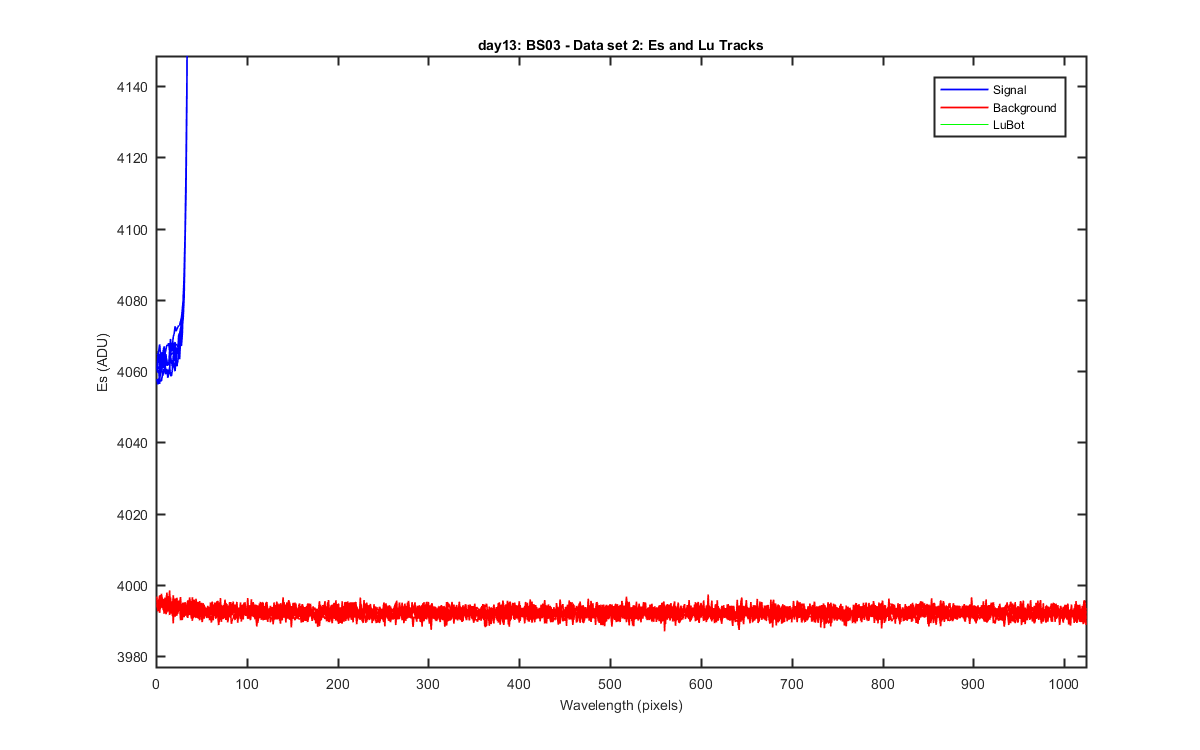
Data set 2 Es data and the backgrounds taken before and after the data set.
Figure 6
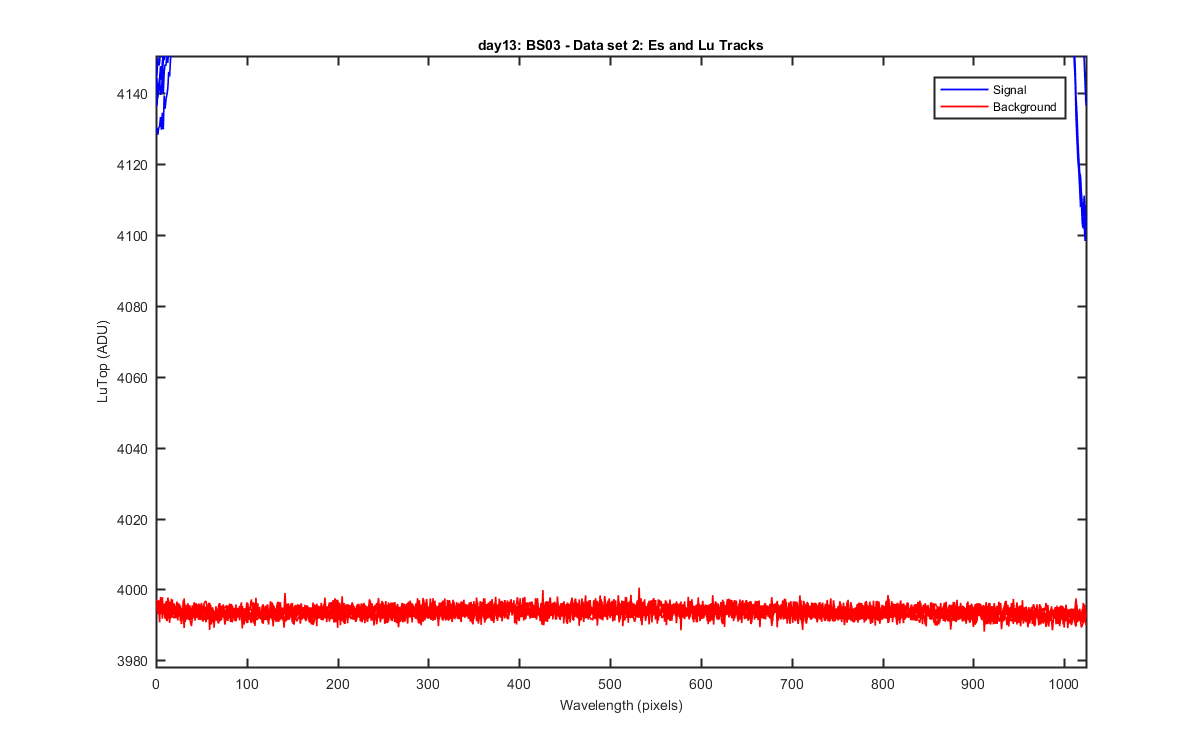
Data set 2 LuTop data and backgrounds taken before and after the data set.
Figure 7
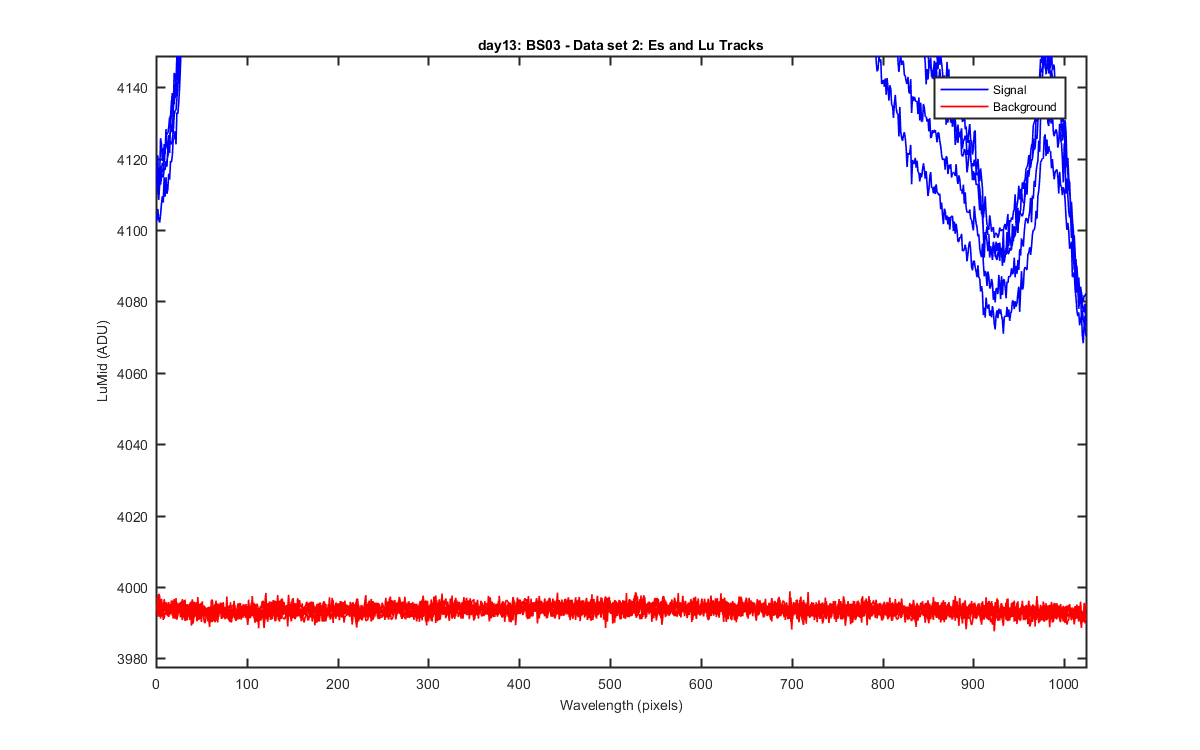
Data set 2 LuMid data and backgrounds taken before and after the data set.
Figure 8
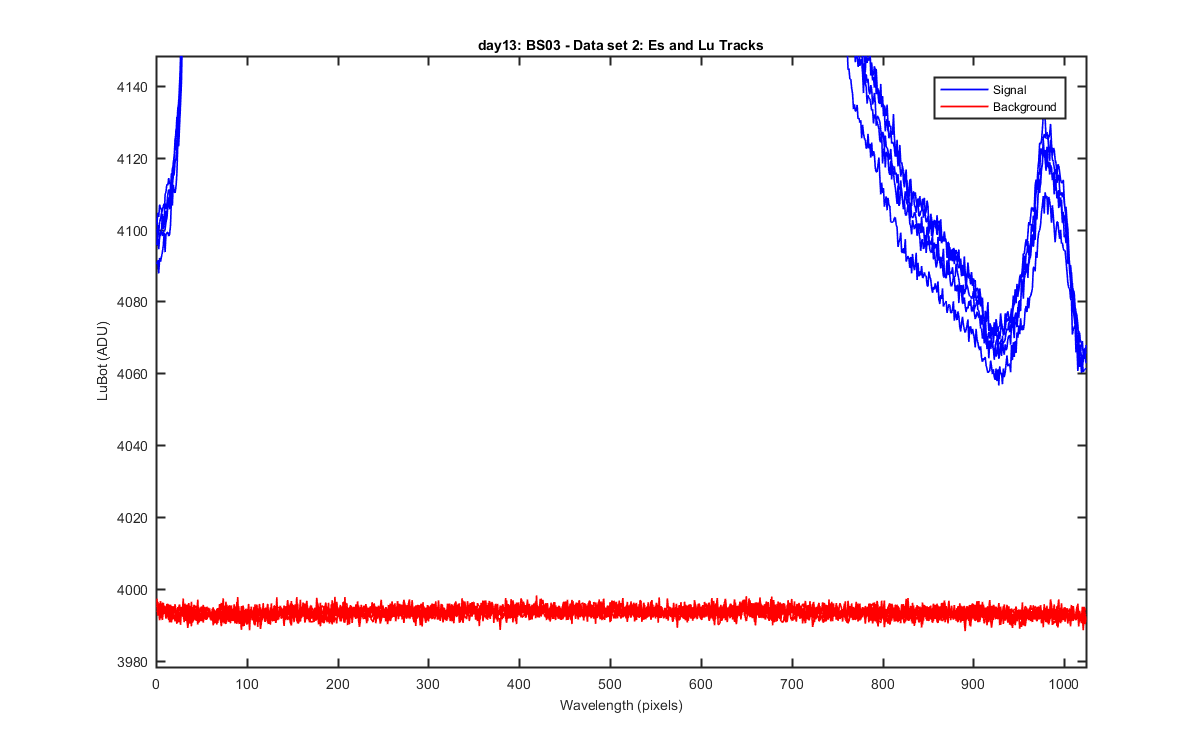
Data set 2 LuBot data and backgrounds taken before and after the data set.
Figure 9
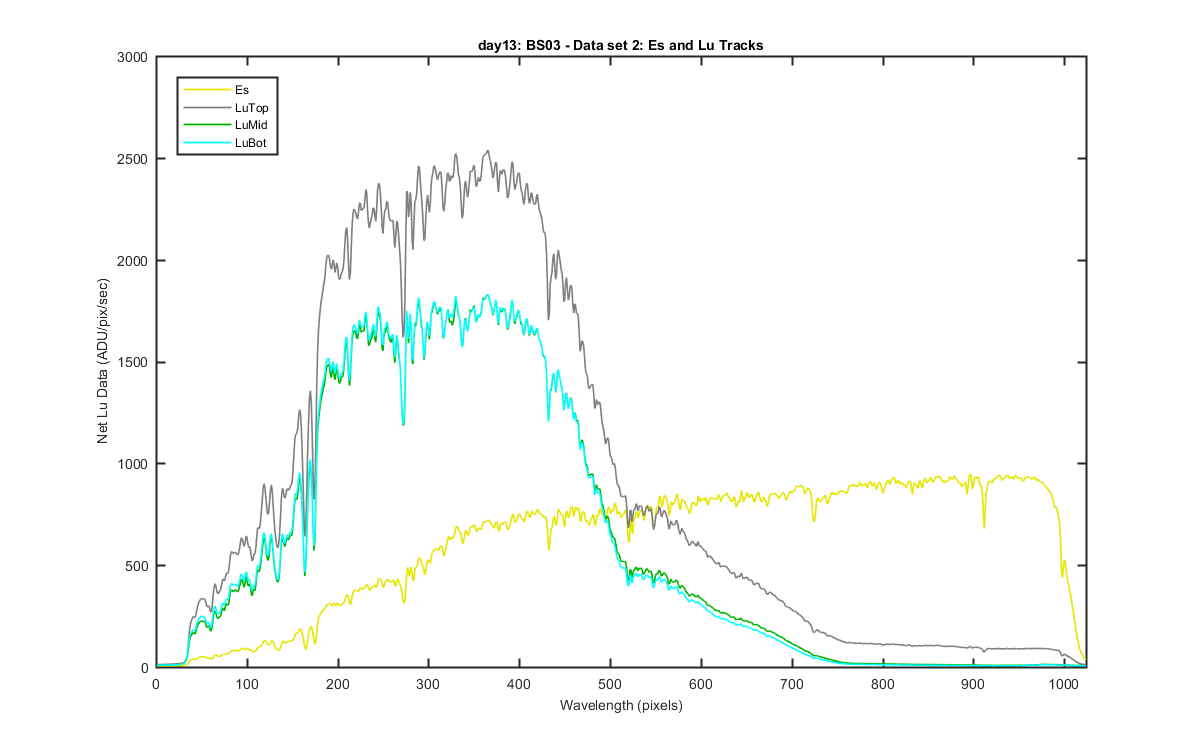
Net signal for each Es and Lu in data set 2. By net I mean an average of the 5 lites for data set 1 and the 6 backgrounds taken before and after the lites. These where each meaned and then subtracted from each other and divided by int time.
Figure 10
Logged version of the Net data for data set 2.
Figure 11
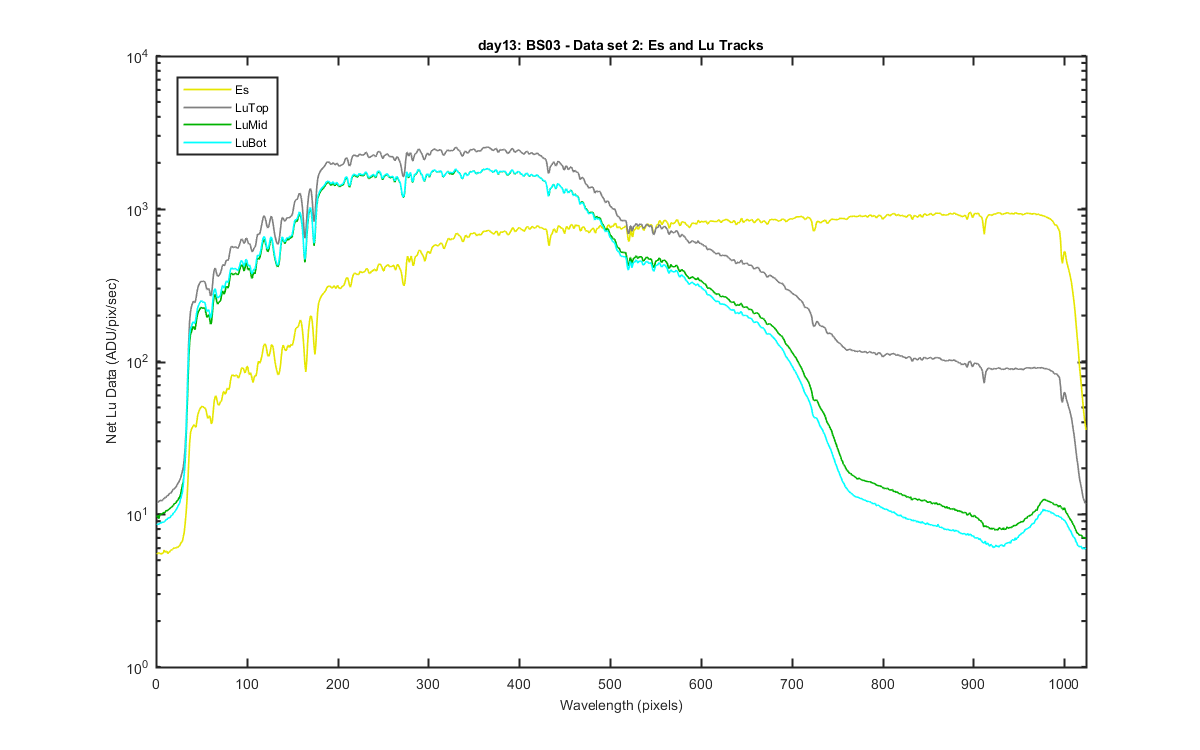
Figure 12
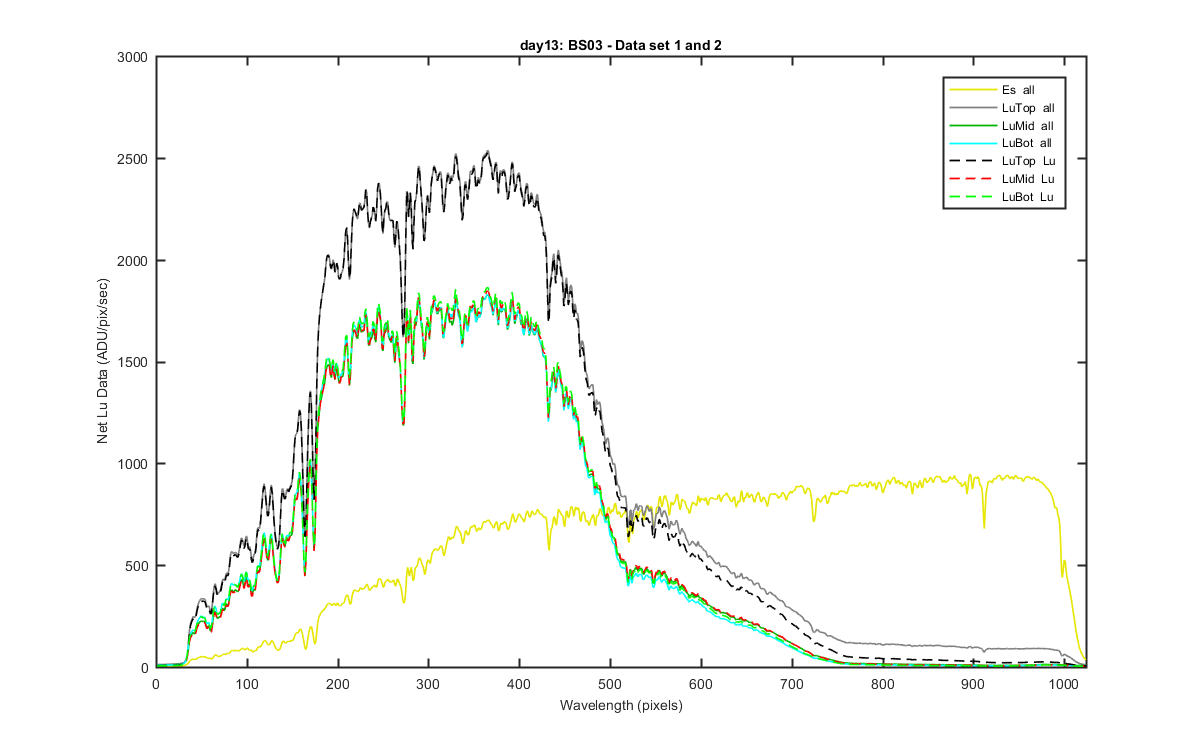
Figure 13
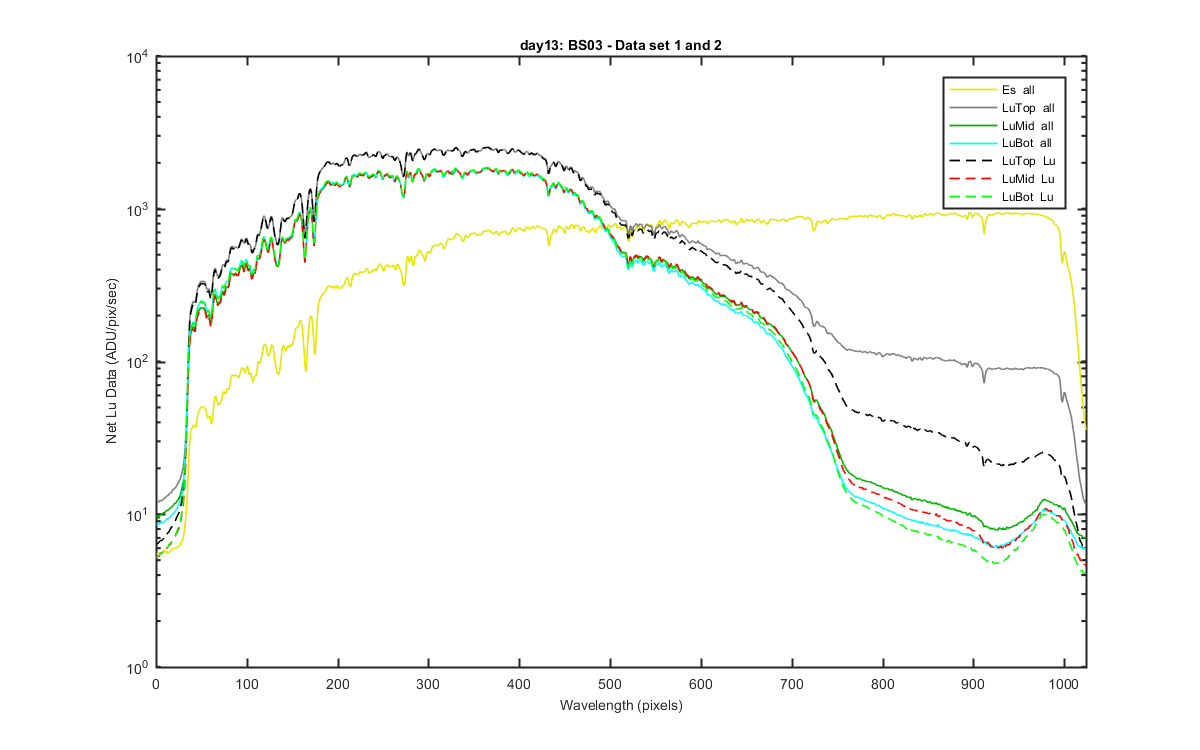
Figure 14