REVISION DATE: 27-Oct-2017 14:34:09
This is similar to the track shift idea. But in this case the tracks did not shift but the system response did. I moved the system response by up to 2 pixels in both directions to see the affects on the Es and Lu data.
Starting track definitions....
TRACKS = [ 1 9 11 13];
LEDGE = [ 1 585 728 876];
REDGE = [76 658 799 946];
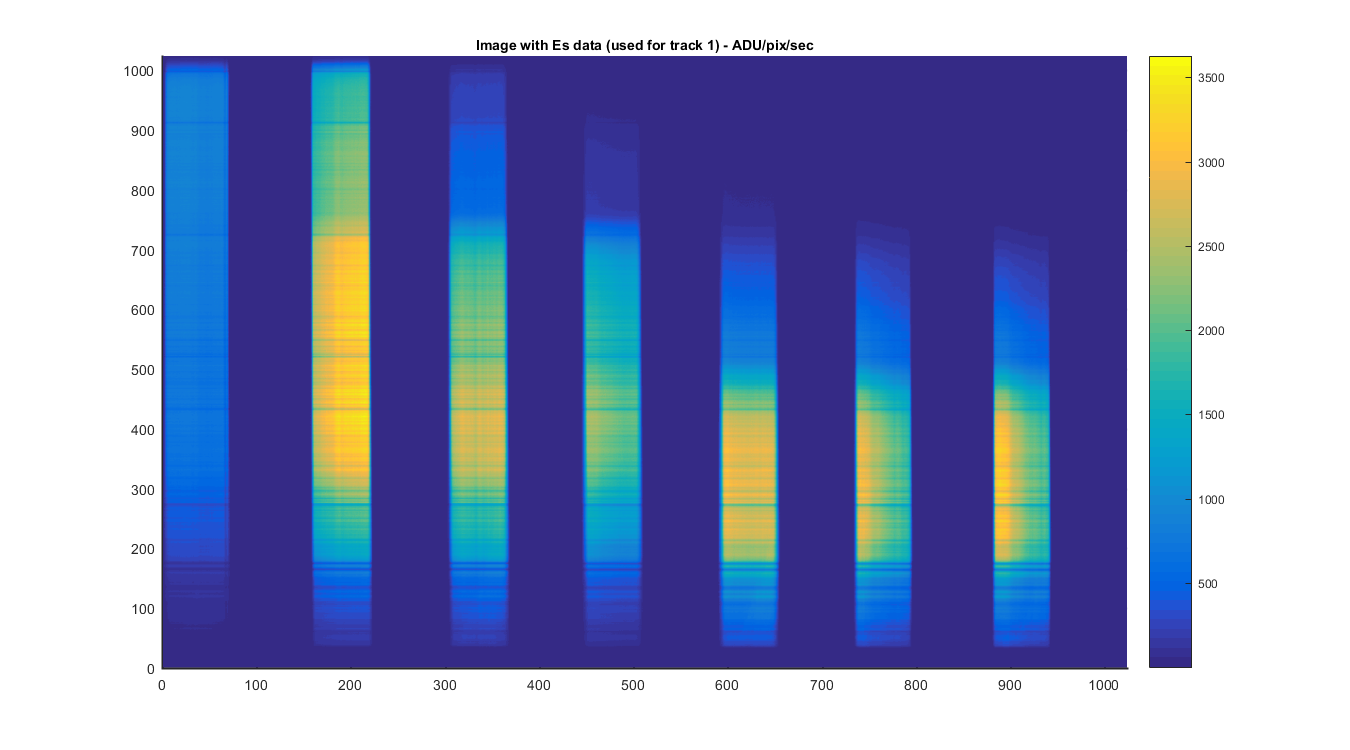
Image used for the Es track shifting fun. The data are dark subtracted and divied by int time.
Figure 1
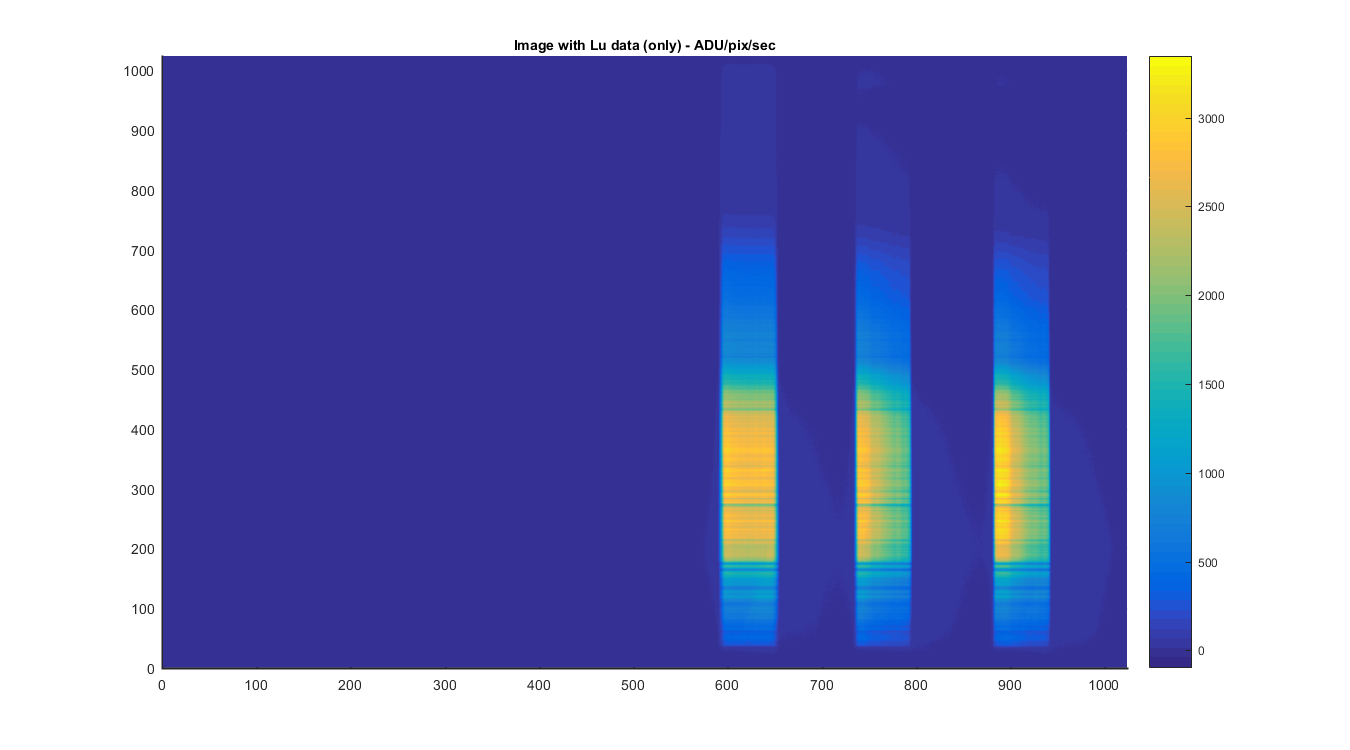
The image used for the 3 Lu Tracks. No Es data are collected on this data set so the Lu data have a higher ADU. The data are dark subtracted and divied by int time.
Figure 2
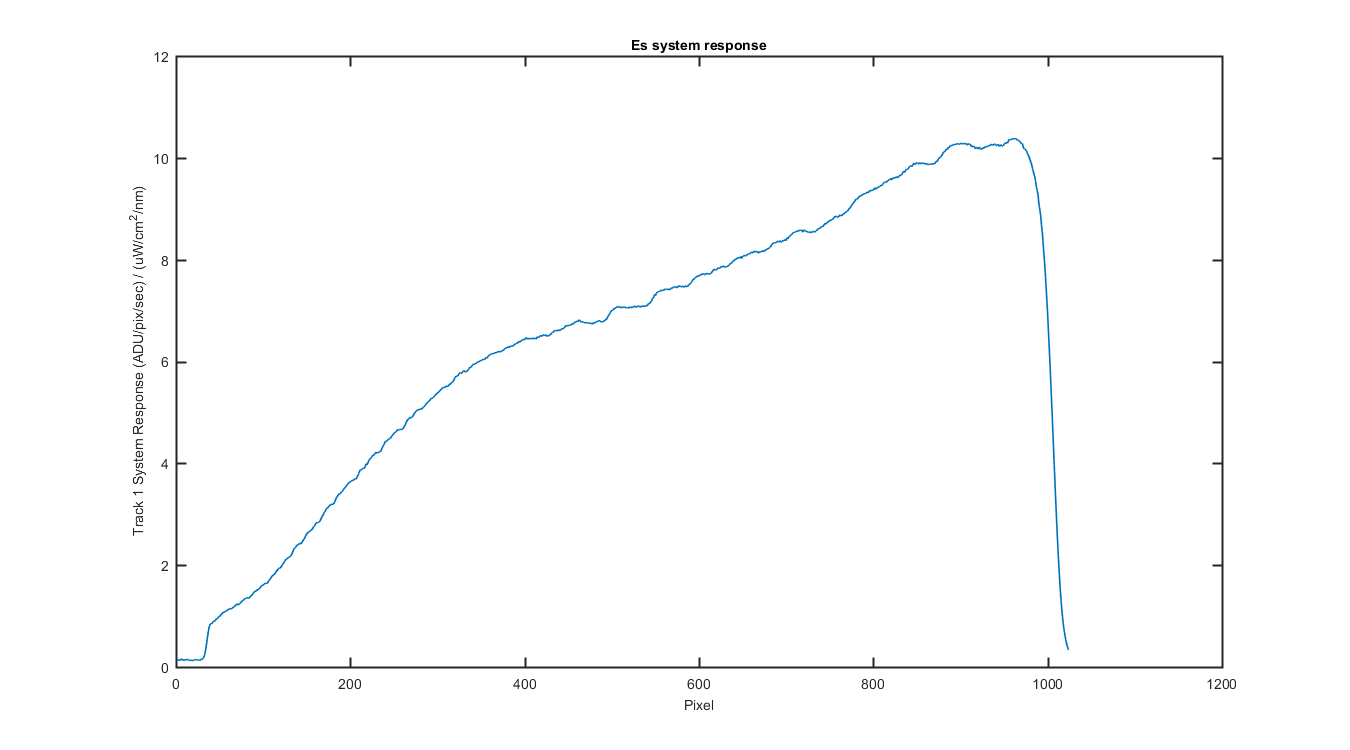
Es system response so you can see the shape
Figure 3
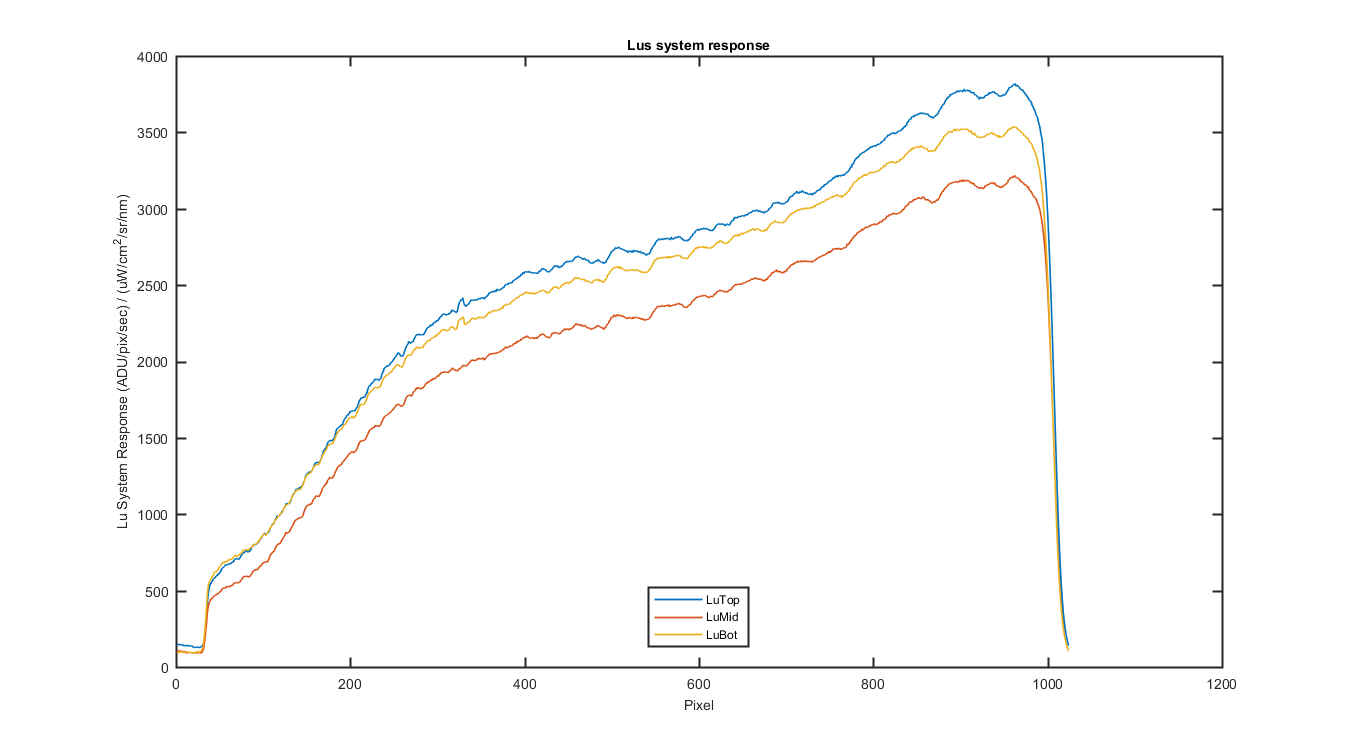
Lu system responses so you can see the shape
Figure 4
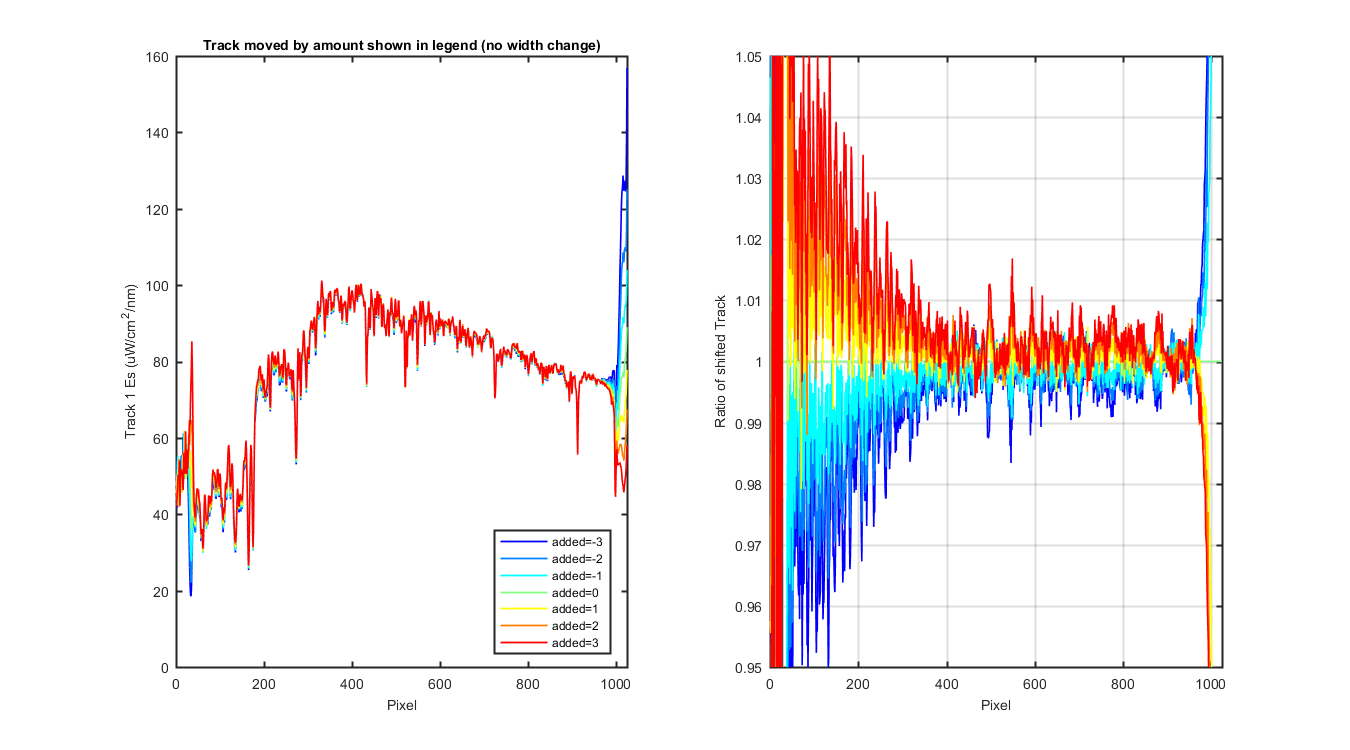
TRACK 1 ES DATA
Left panel is each track spectrally in Engineering units.
The right panel is the spectral ratio relative to the "normal" system response position or add = 0.
Figure 5
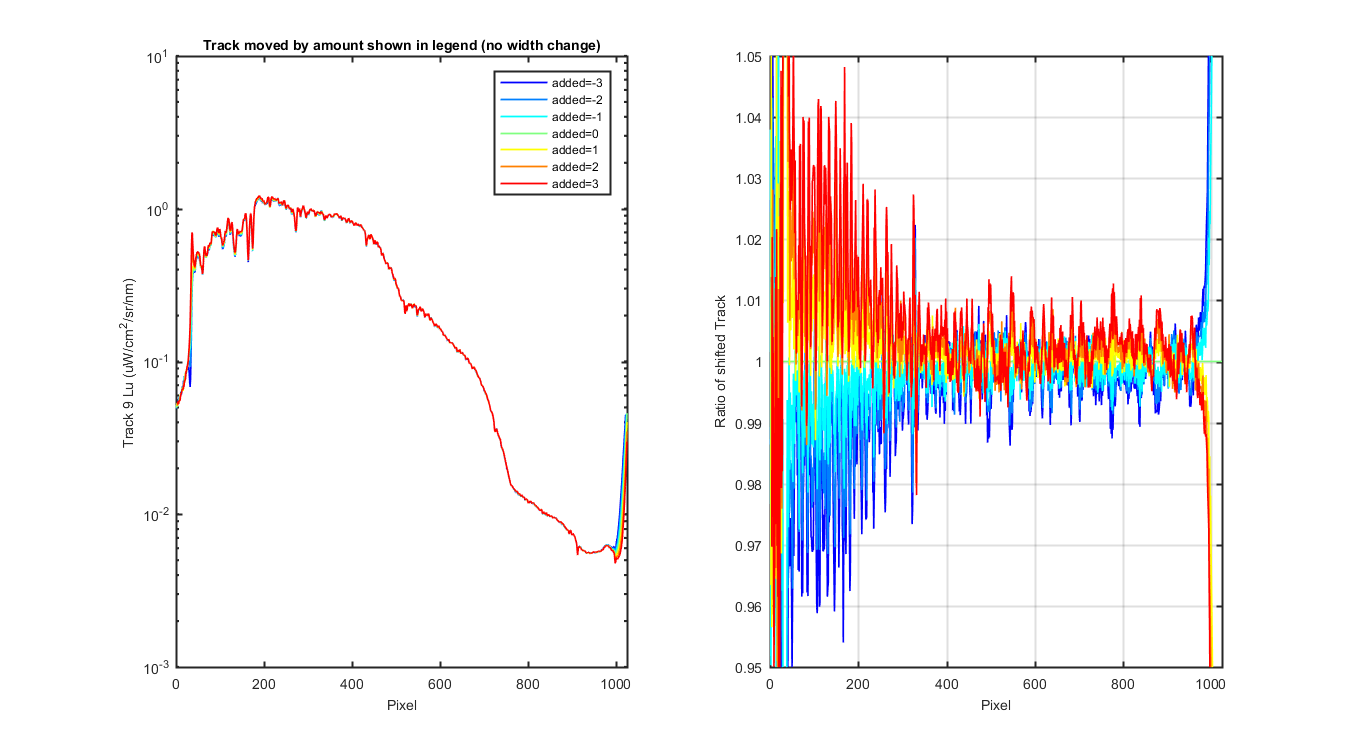
TRACK 9 LuTop DATA
Left panel is each track spectrally in Engineering units
The right panel is the spectral ratio relative to the "normal" system response position or add = 0.
Figure 6
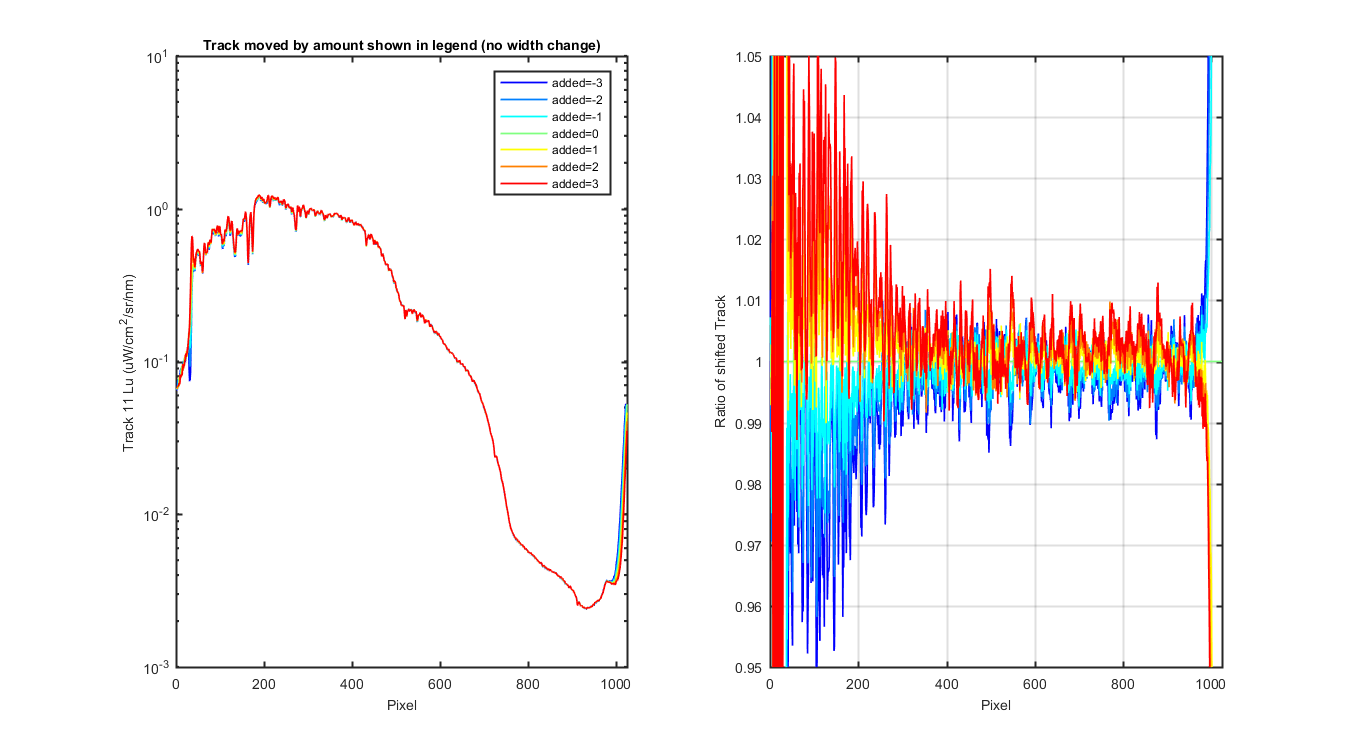
TRACK 11 LuMid DATA
Left panel is each track spectrally in Engineering units
The right panel is the spectral ratio relative to the "normal" system response position or add = 0.
Figure 7
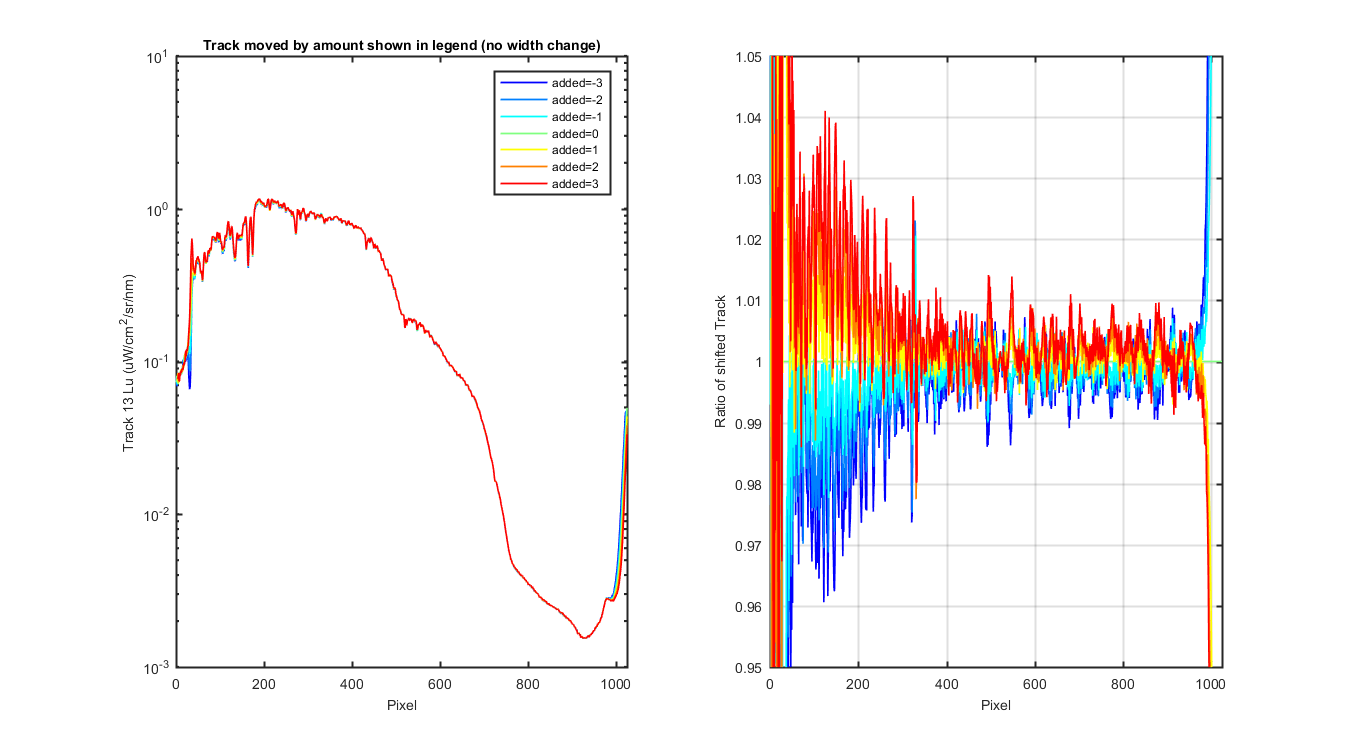
TRACK 13 LuBot DATA
Left panel is each track spectrally in Engineering units
The right panel is the spectral ratio relative to the "normal" system response position or add = 0.
Figure 8