REVISION DATE: 07-May-2018 13:25:38
Looks at track movement for in-water data collected so far. This is only for the tracks with light on them so the unused tracks are not included. For each file and track I normalized the track to its max value and plotted this for each file. Then I found where the right and left edge of each track crossed the 50% line. These track positions are plotted on the right panel below. I removed track with the shutters closed and tracks that where saturated (if any).
Track Defintions (grey patchs below):
Track   #:  Left   Right
        1:     3      80
        2:    81     155
        3:   156     229
        4:   230     301
        5:   302     374
        6:   375     445
        7:   446     518
        8:   519     589
        9:   590     661
       10:   662     733
       11:   734     805
       12:   806     878
       13:   880     953
       14:   955    1024
Figure 1
Figure 2
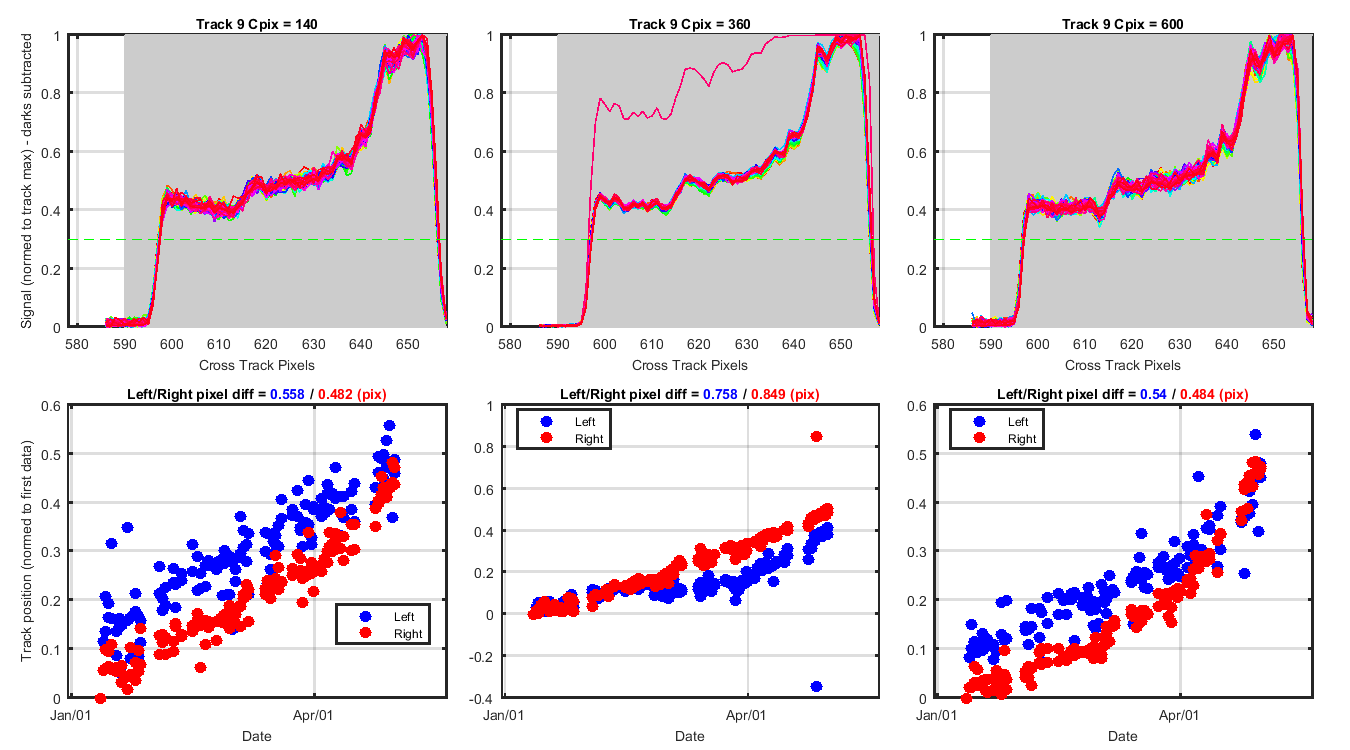
LuTop - Track 9 - Track movement for 3 cross track pixels.
Figure 3
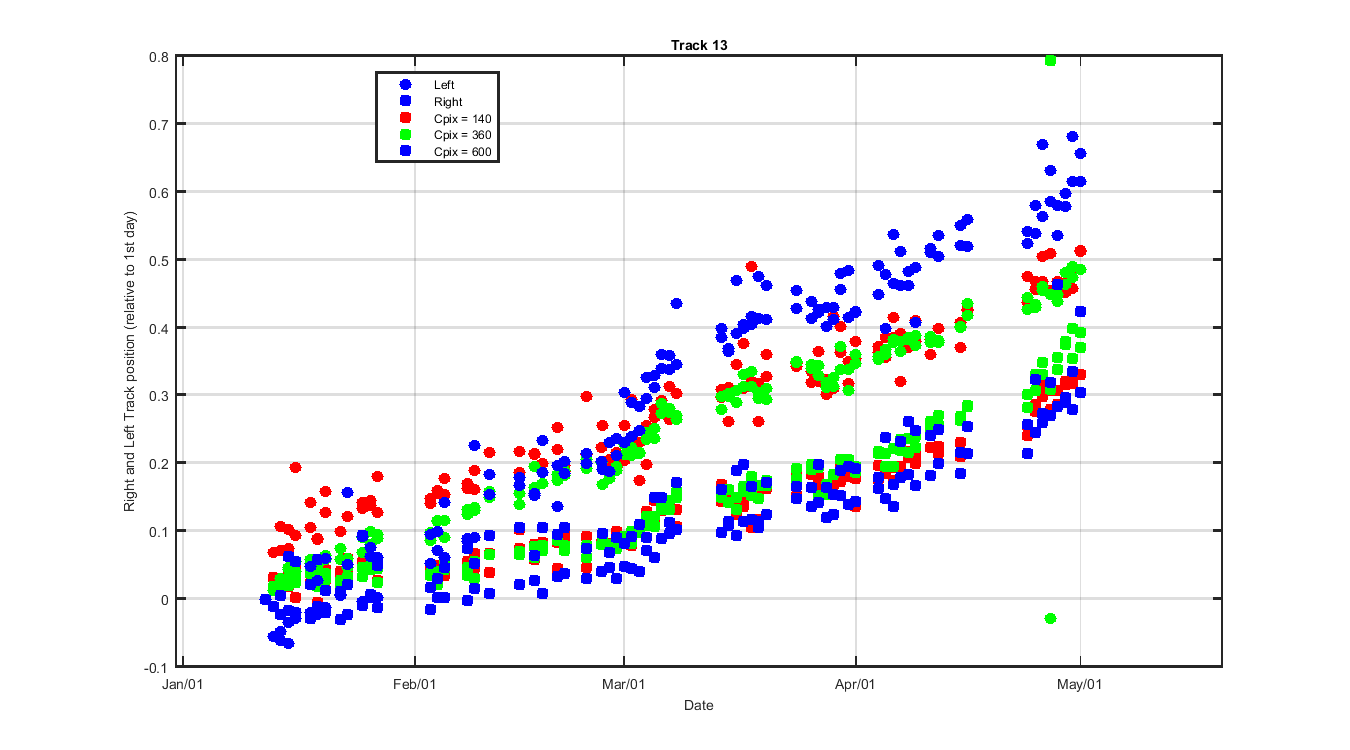
LuBot - Track 13 - Track movement for 3 cross track pixels.
Figure 4
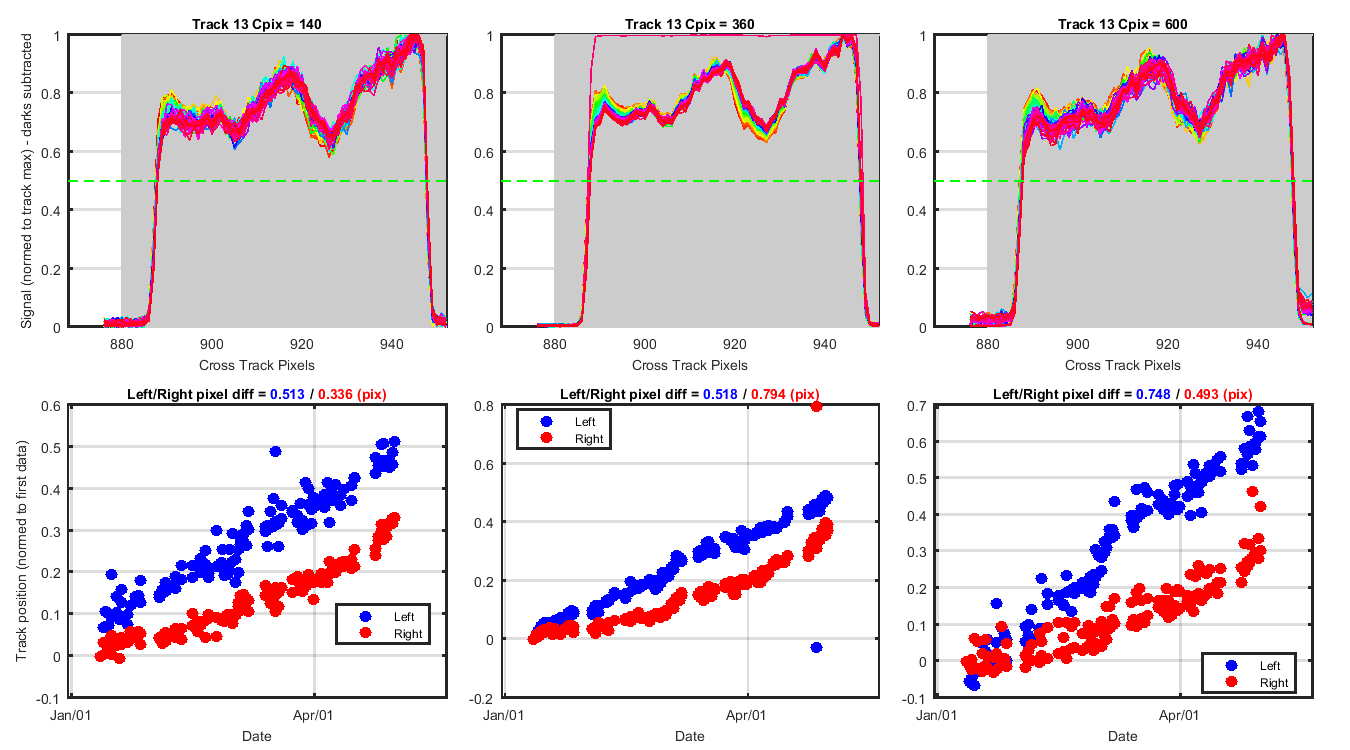
Figure 5
Figure 6
Figure 7
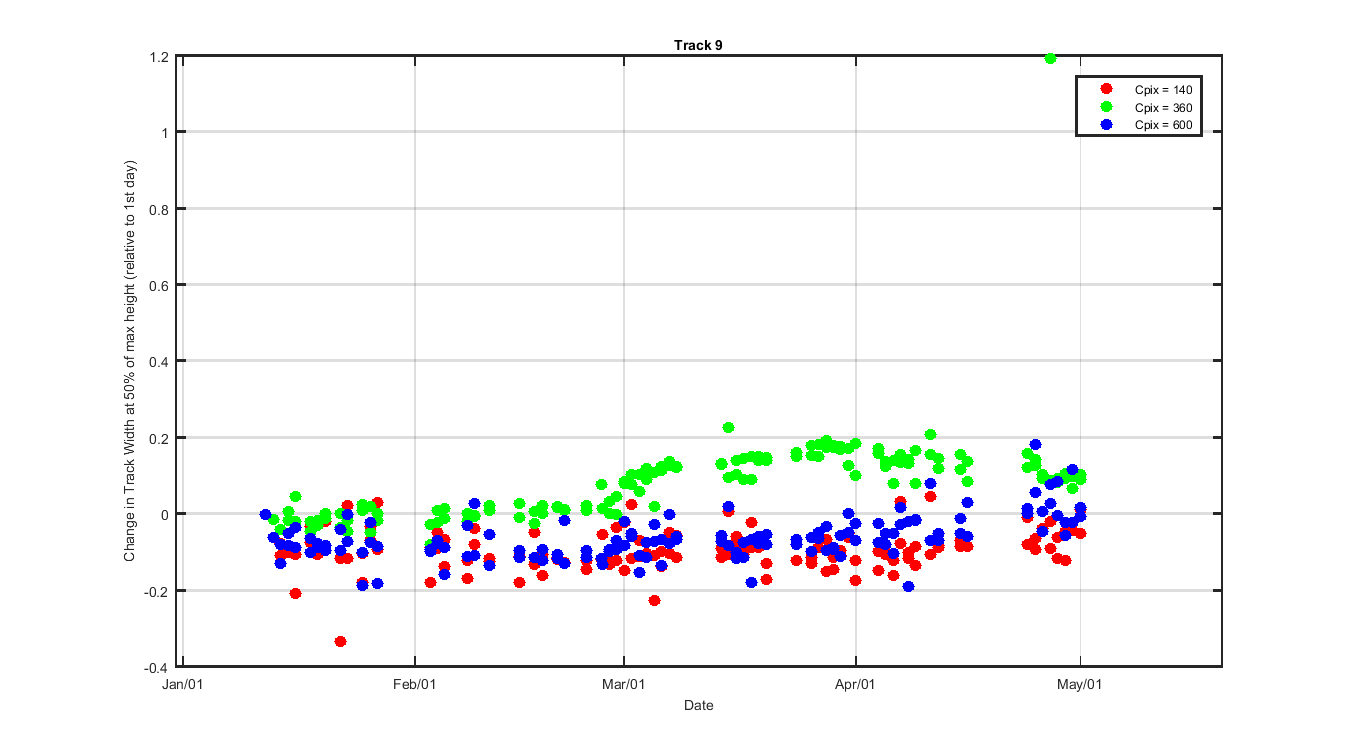
Figure 8
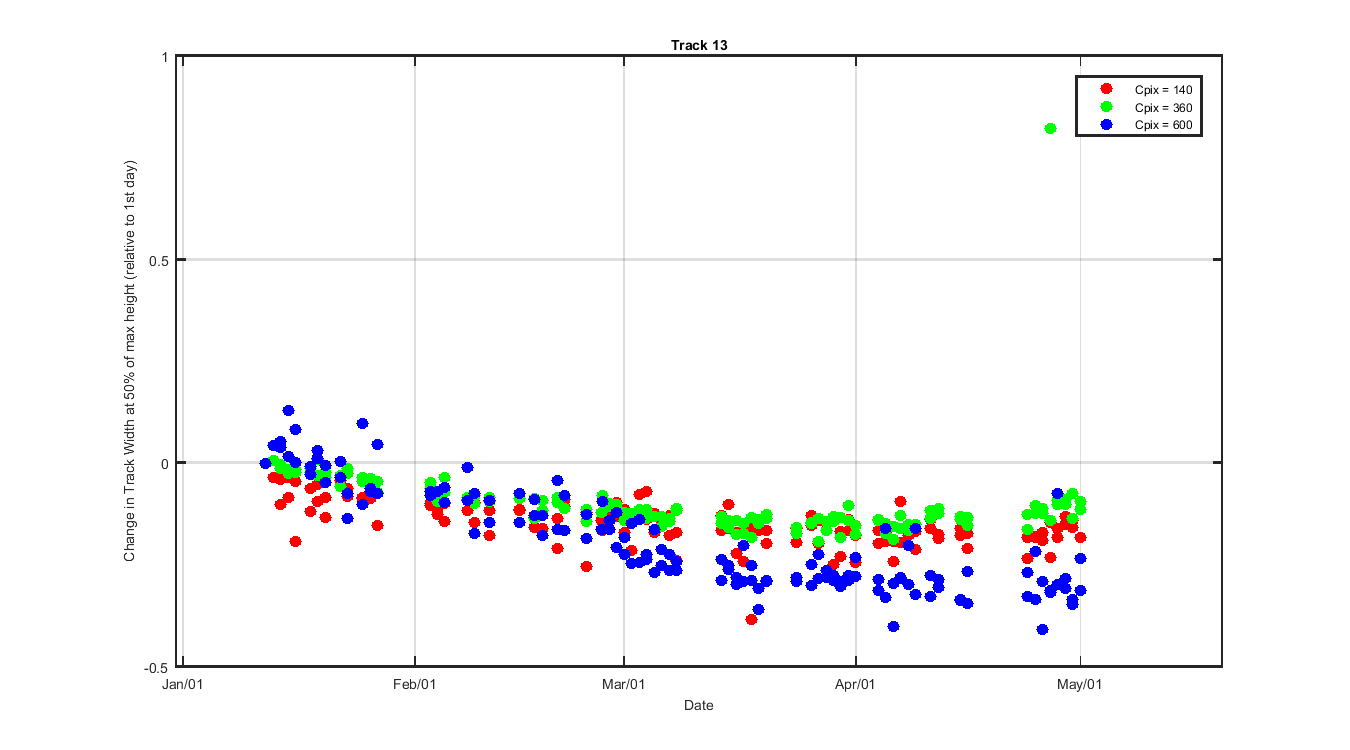
Figure 9
Figure 10
Figure 11
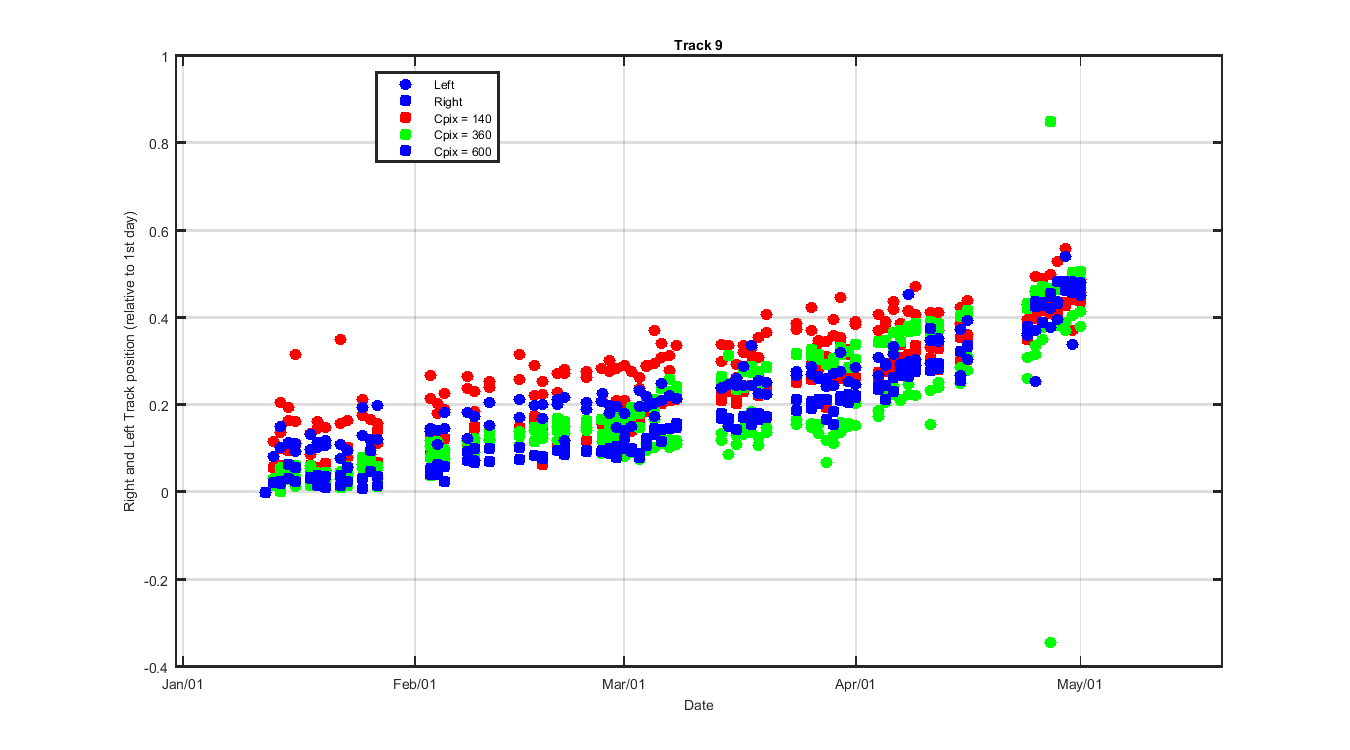
Figure 12