REVISION DATE: 19-Jun-2018 10:31:26
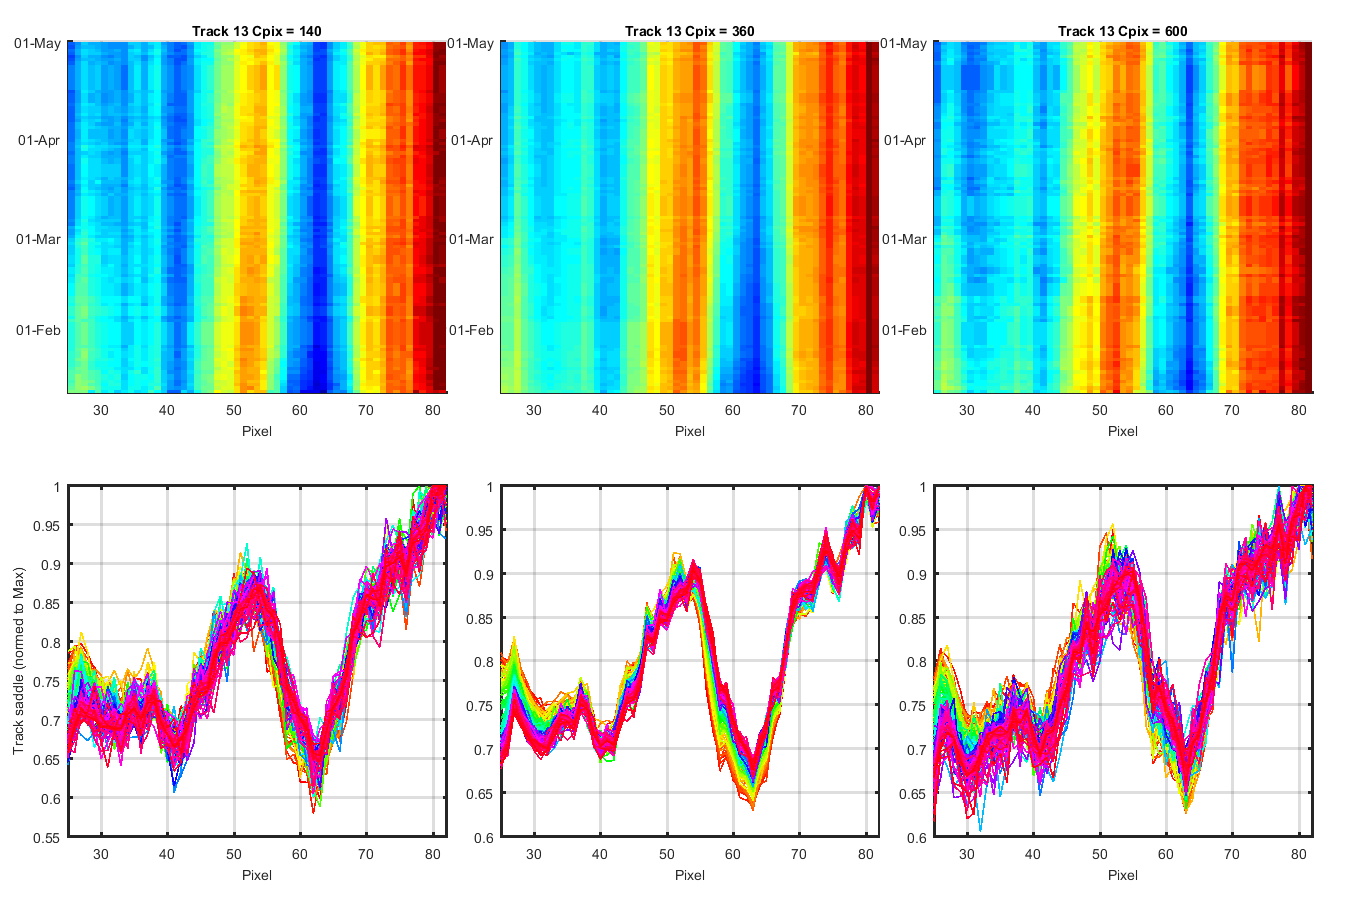
Using the data from Page num 100.10 whic shows Track movement and saddle shape changes. I plot the same data but of just the saddle shape changes in a surface plot. The outside edges of the tracks have been removed so you can see what is happening in the saddle. All three graphs for a track are on the same color scale. The first graph shows the Track 2 Cpix 360 data as a 3-D graph so you can see what the data look like when not viewed from the top down. The rest of the graphs are are viewed top down.
The same normalizing etc was use etc for the graphs below. For the top graphs: The x-axis is the cross track pixel numbers of the track. The y-axis is the date of the date set. The title shows the track and which pixel is pulled out. For the bottom graphs its the same data but plotted as line one line for each day.
Figure 1
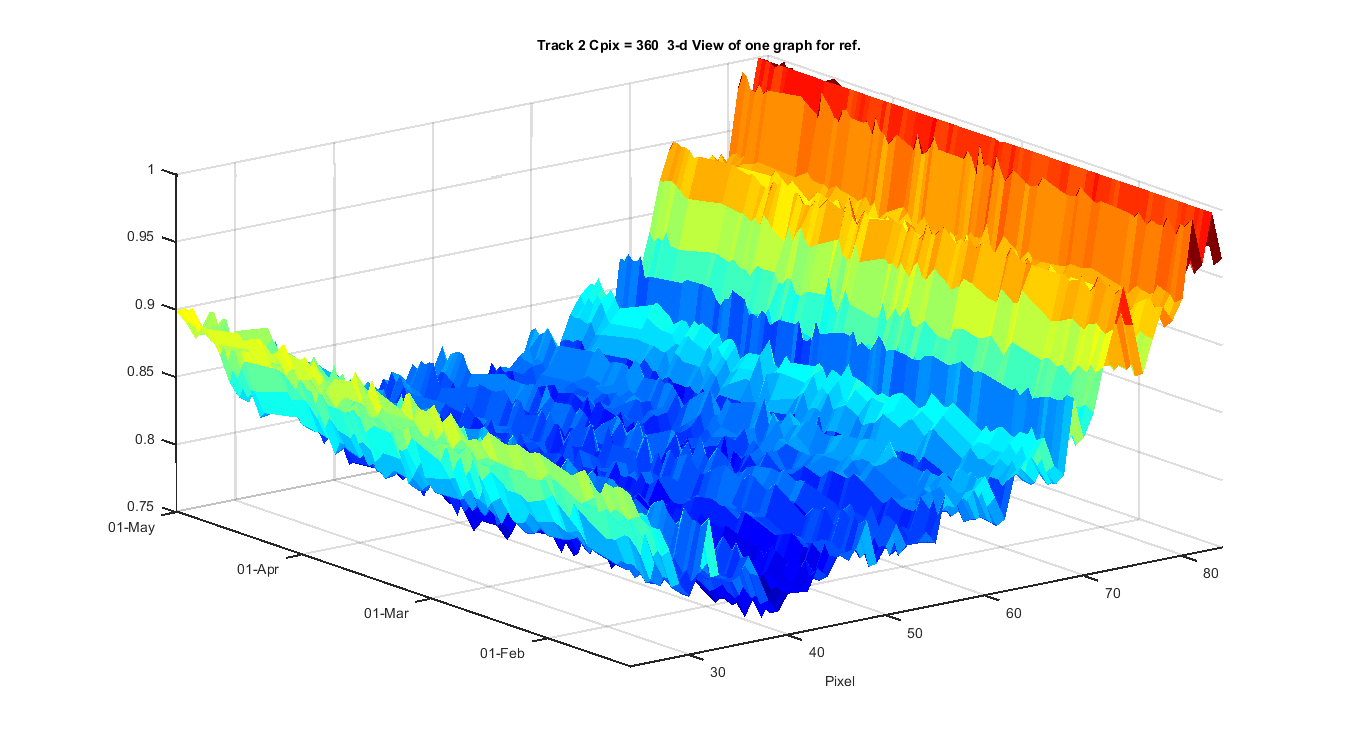
Figure 2
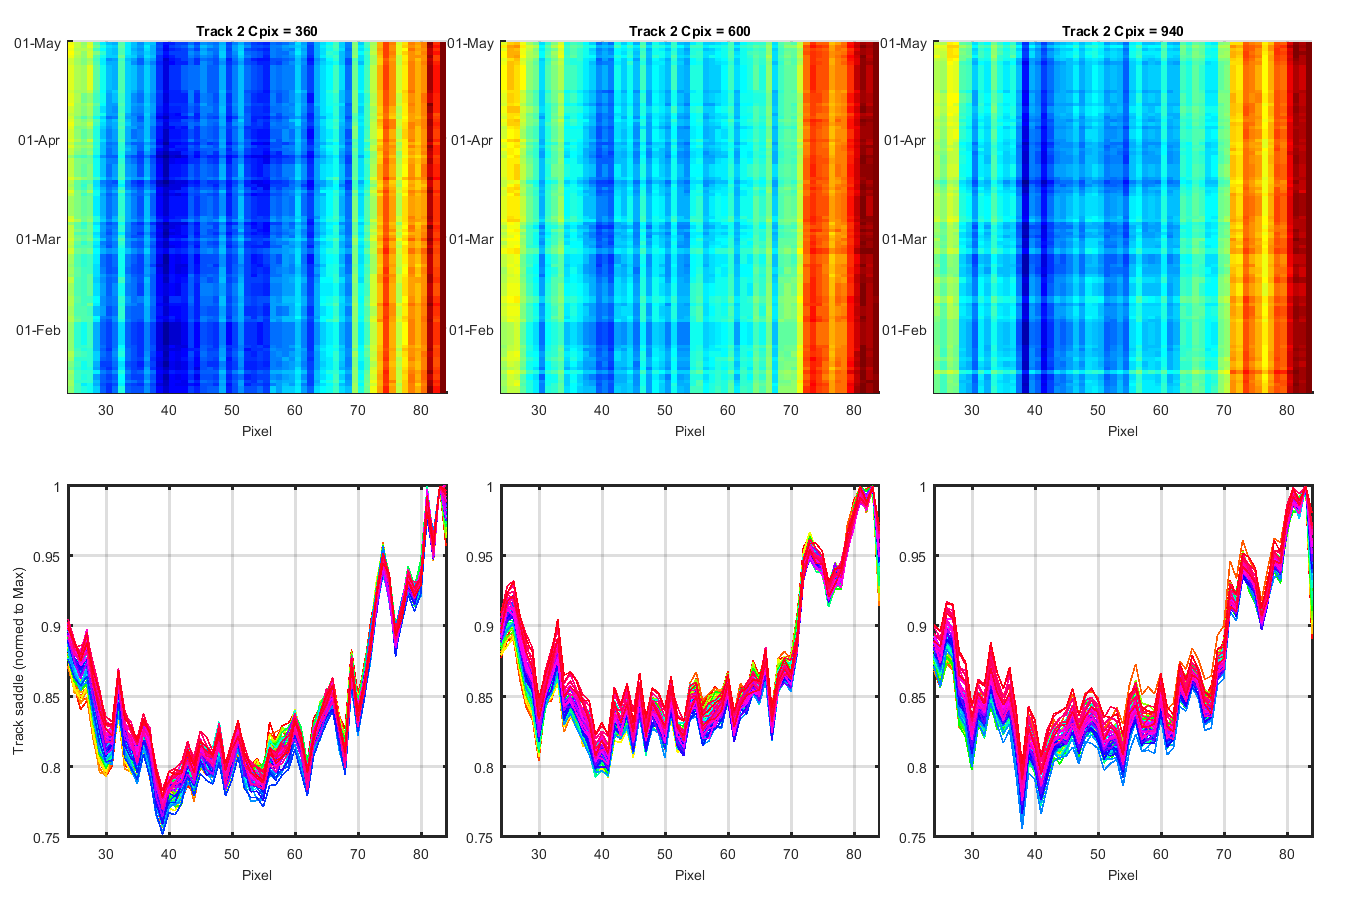
Figure 3
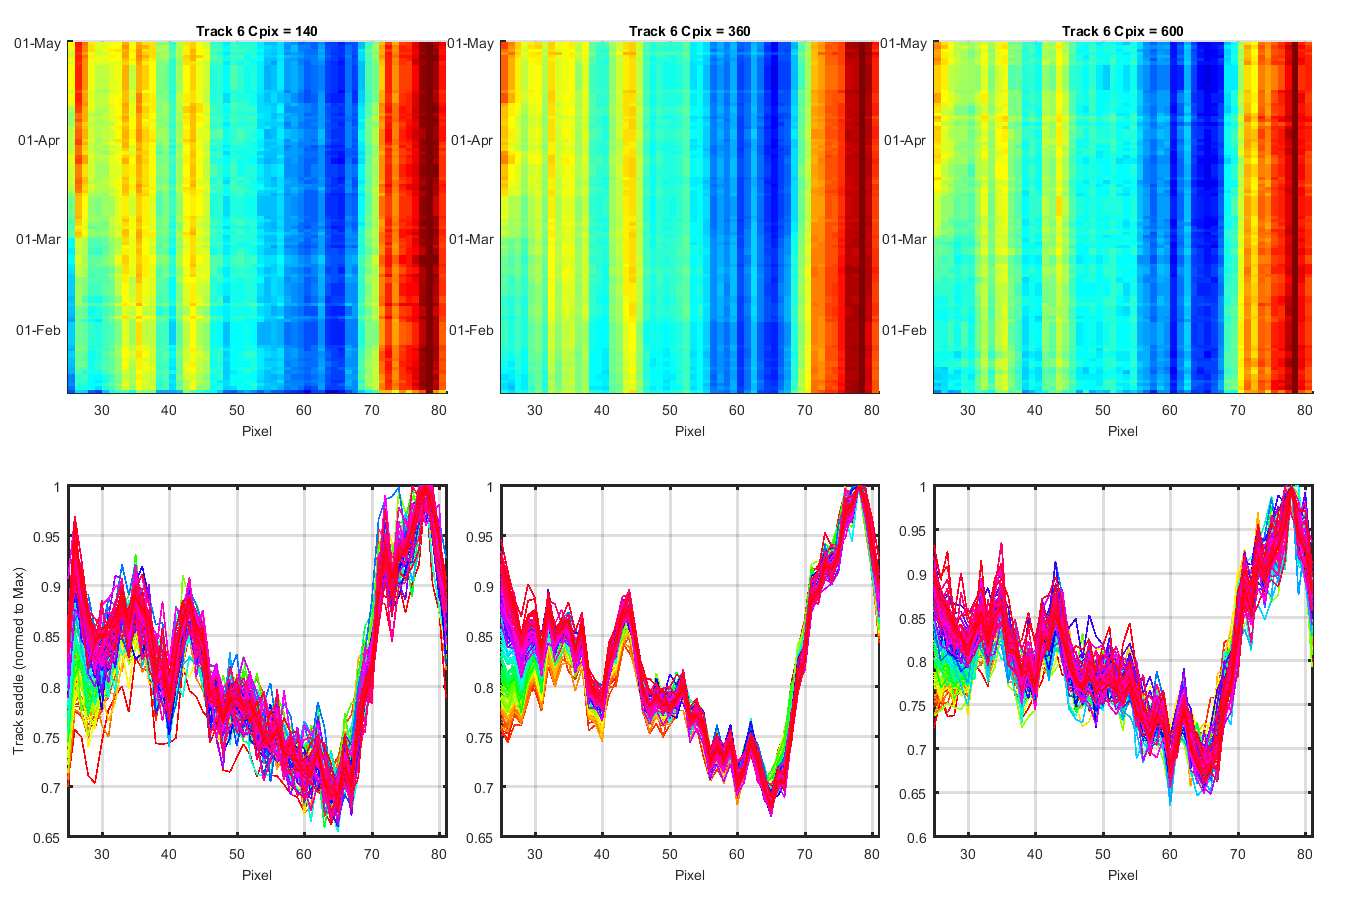
Figure 4
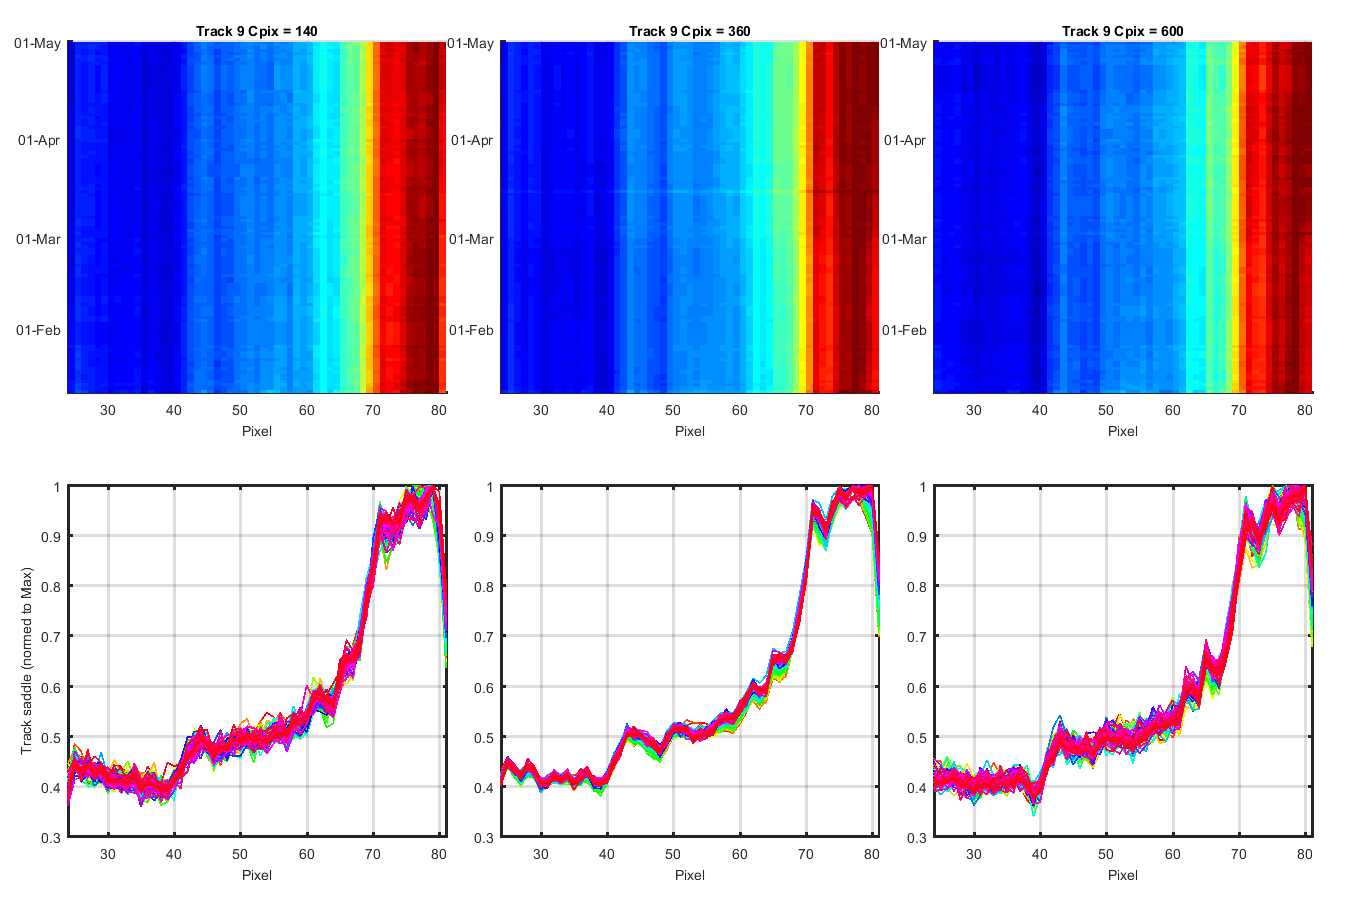
Figure 5