REVISION DATE: 12-Mar-2018 13:46:35
Subtracting off the cross track data from the Es/Lu and Lu only data sets. Below are all the in-water 20 hour files with the Es\Lu and Lu only data sets. For each days there can be two figures. One for the Es/Lu data set and a second for the Lu only data set.
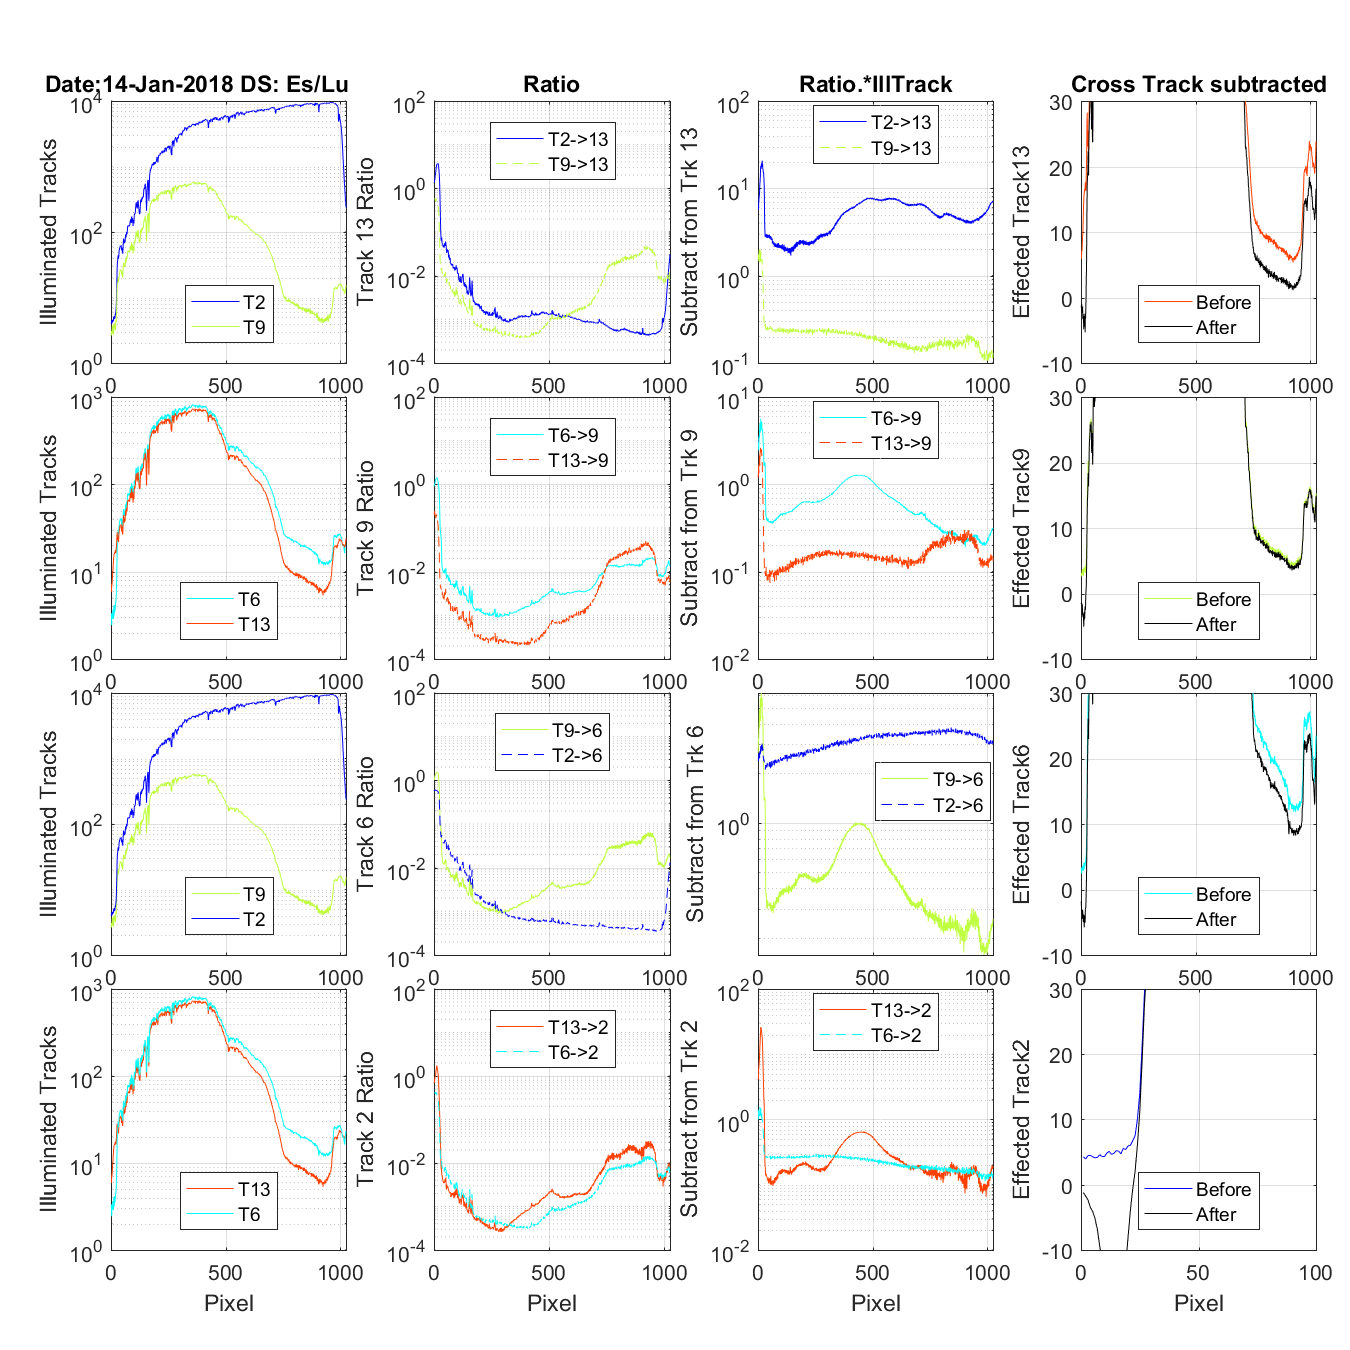
Figure 1 The title on the first row tells the date and if this is an Es/Lu data set (4 rows) or and Lu only data set (3 rows). The first column of graphs shows the tracks that are contaminating the track being corrected (Track in the last column). One of the tracks show in the first column is the mirror tracks causing UV ghosting problems the other is the closest track contamination with regular cross track light. The second column shows the UV or Cross track ratio for the contaminating tracks. The third column is the multiplication of the contaminating track and its ratio. The fourth column is the track being corrected. Before is the original data and after once the cross and UN ghosting contamination is removed. FYI: In the case of the Lu only data on column 2 you wil see the Es track shows as a ratio. But because there is no Es data it is not in any other column.

Figure 2 The title on the first row tells the date and if this is an Es/Lu data set (4 rows) or and Lu only data set (3 rows). The first column of graphs shows the tracks that are contaminating the track being corrected (Track in the last column). One of the tracks show in the first column is the mirror tracks causing UV ghosting problems the other is the closest track contamination with regular cross track light. The second column shows the UV or Cross track ratio for the contaminating tracks. The third column is the multiplication of the contaminating track and its ratio. The fourth column is the track being corrected. Before is the original data and after once the cross and UN ghosting contamination is removed. FYI: In the case of the Lu only data on column 2 you wil see the Es track shows as a ratio. But because there is no Es data it is not in any other column.
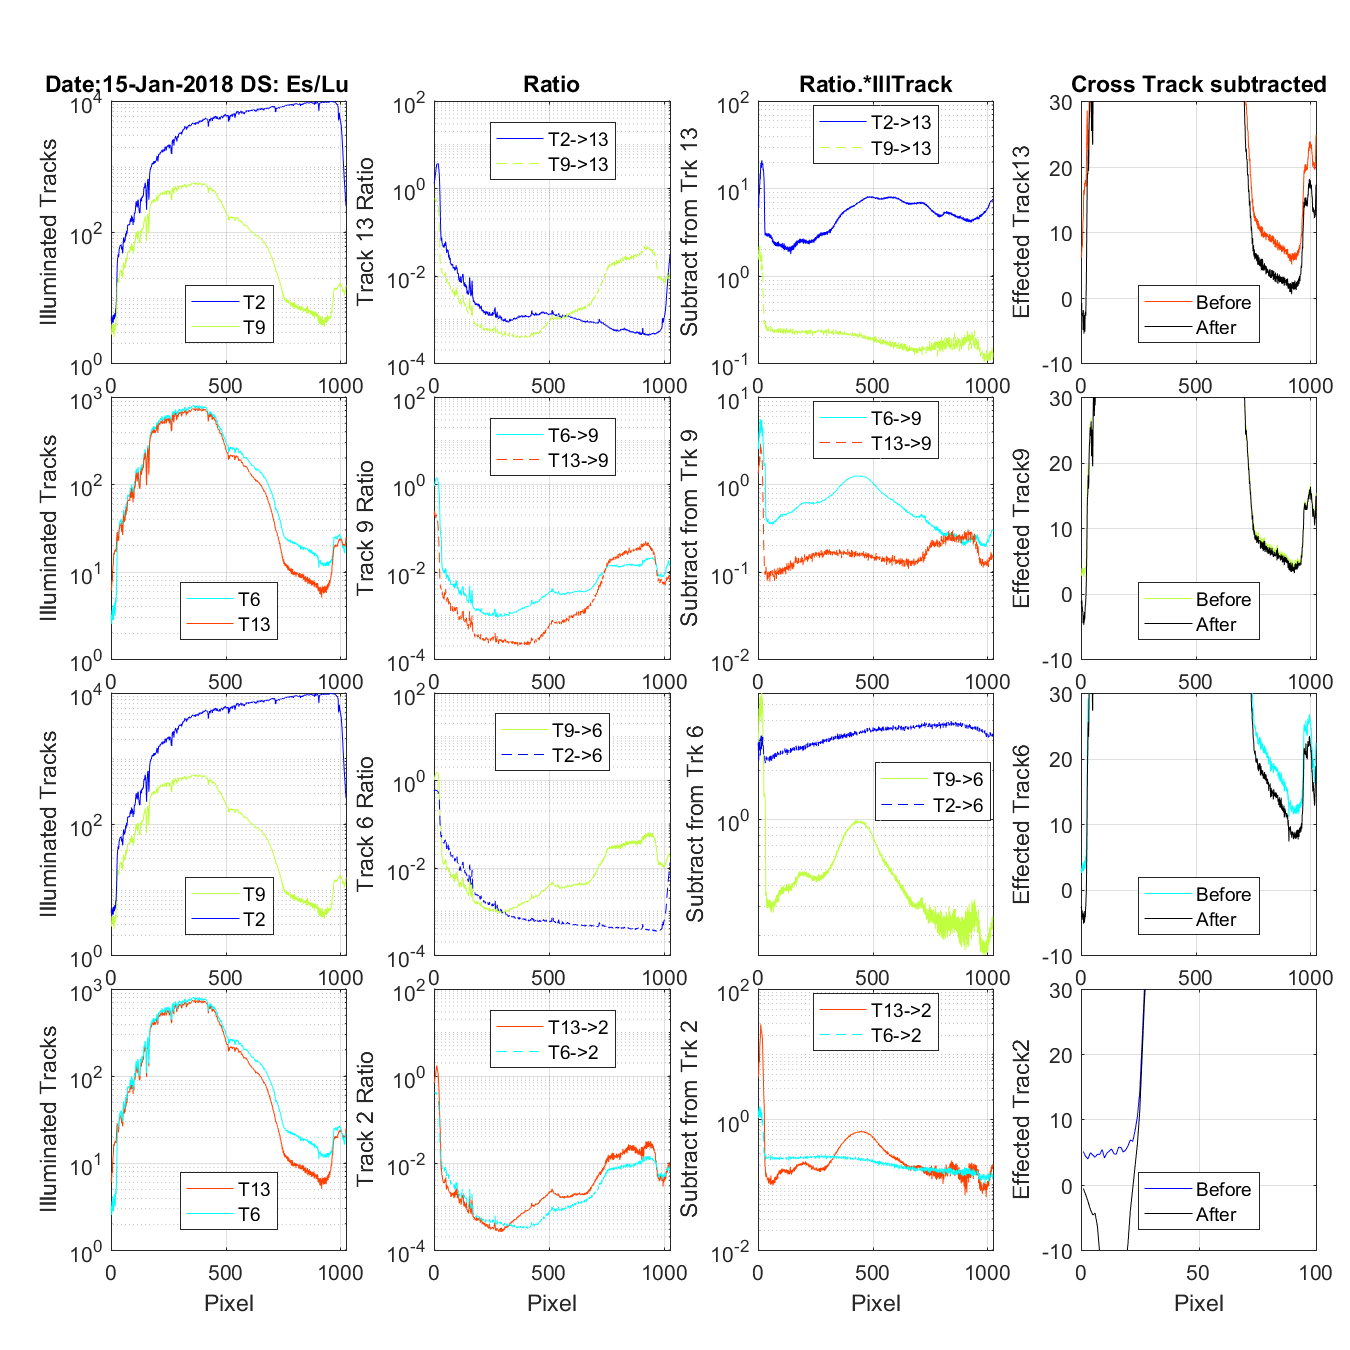
Figure 3 The title on the first row tells the date and if this is an Es/Lu data set (4 rows) or and Lu only data set (3 rows). The first column of graphs shows the tracks that are contaminating the track being corrected (Track in the last column). One of the tracks show in the first column is the mirror tracks causing UV ghosting problems the other is the closest track contamination with regular cross track light. The second column shows the UV or Cross track ratio for the contaminating tracks. The third column is the multiplication of the contaminating track and its ratio. The fourth column is the track being corrected. Before is the original data and after once the cross and UN ghosting contamination is removed. FYI: In the case of the Lu only data on column 2 you wil see the Es track shows as a ratio. But because there is no Es data it is not in any other column.
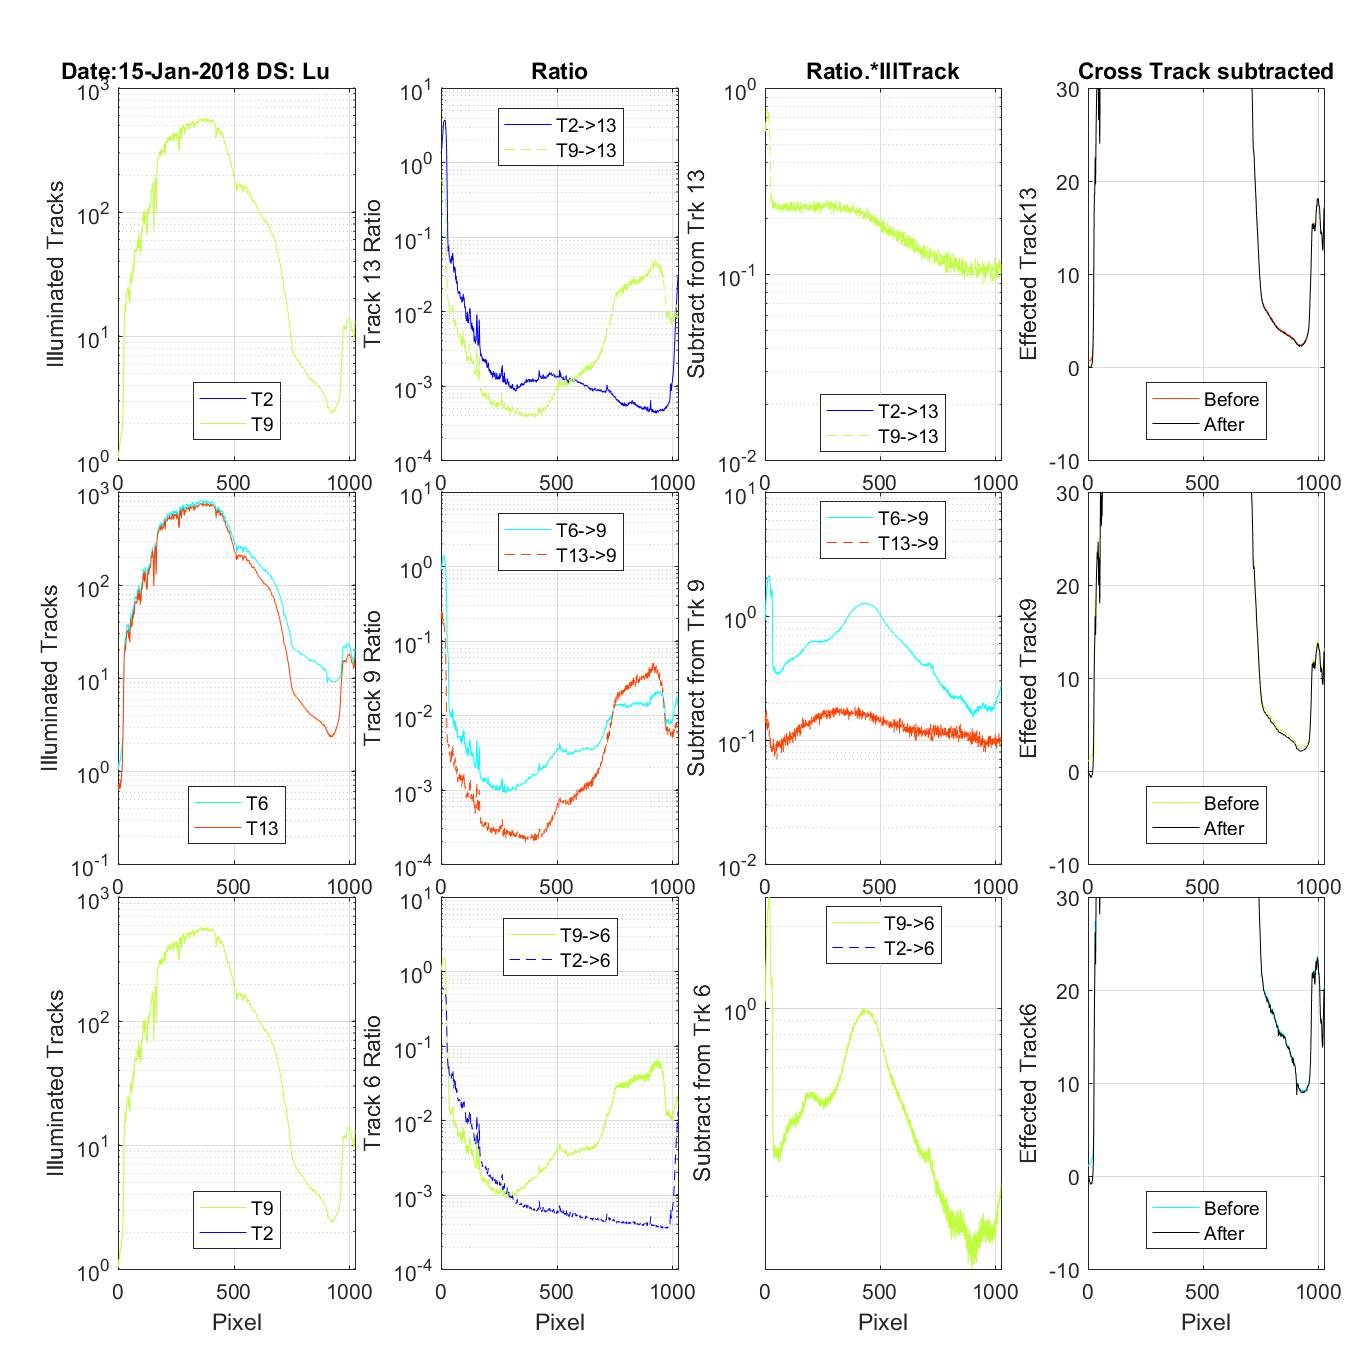
Figure 4 The title on the first row tells the date and if this is an Es/Lu data set (4 rows) or and Lu only data set (3 rows). The first column of graphs shows the tracks that are contaminating the track being corrected (Track in the last column). One of the tracks show in the first column is the mirror tracks causing UV ghosting problems the other is the closest track contamination with regular cross track light. The second column shows the UV or Cross track ratio for the contaminating tracks. The third column is the multiplication of the contaminating track and its ratio. The fourth column is the track being corrected. Before is the original data and after once the cross and UN ghosting contamination is removed. FYI: In the case of the Lu only data on column 2 you wil see the Es track shows as a ratio. But because there is no Es data it is not in any other column.
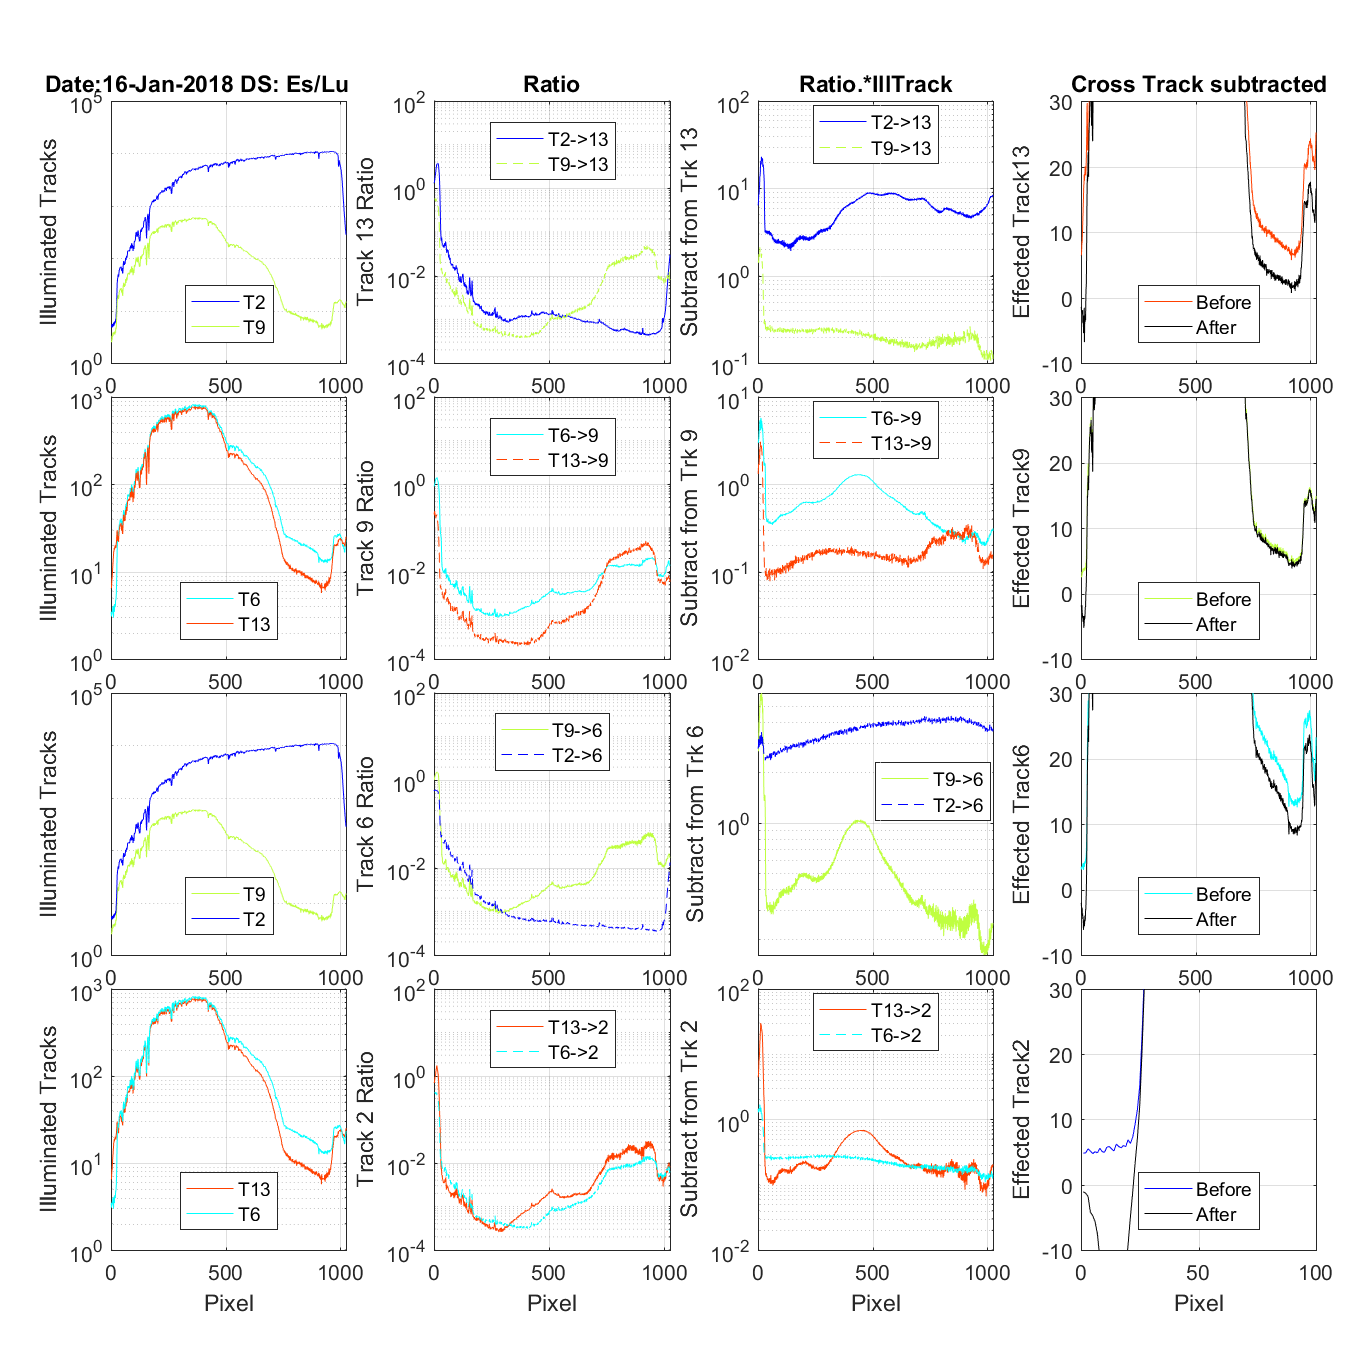
Figure 5 The title on the first row tells the date and if this is an Es/Lu data set (4 rows) or and Lu only data set (3 rows). The first column of graphs shows the tracks that are contaminating the track being corrected (Track in the last column). One of the tracks show in the first column is the mirror tracks causing UV ghosting problems the other is the closest track contamination with regular cross track light. The second column shows the UV or Cross track ratio for the contaminating tracks. The third column is the multiplication of the contaminating track and its ratio. The fourth column is the track being corrected. Before is the original data and after once the cross and UN ghosting contamination is removed. FYI: In the case of the Lu only data on column 2 you wil see the Es track shows as a ratio. But because there is no Es data it is not in any other column.

Figure 6 The title on the first row tells the date and if this is an Es/Lu data set (4 rows) or and Lu only data set (3 rows). The first column of graphs shows the tracks that are contaminating the track being corrected (Track in the last column). One of the tracks show in the first column is the mirror tracks causing UV ghosting problems the other is the closest track contamination with regular cross track light. The second column shows the UV or Cross track ratio for the contaminating tracks. The third column is the multiplication of the contaminating track and its ratio. The fourth column is the track being corrected. Before is the original data and after once the cross and UN ghosting contamination is removed. FYI: In the case of the Lu only data on column 2 you wil see the Es track shows as a ratio. But because there is no Es data it is not in any other column.
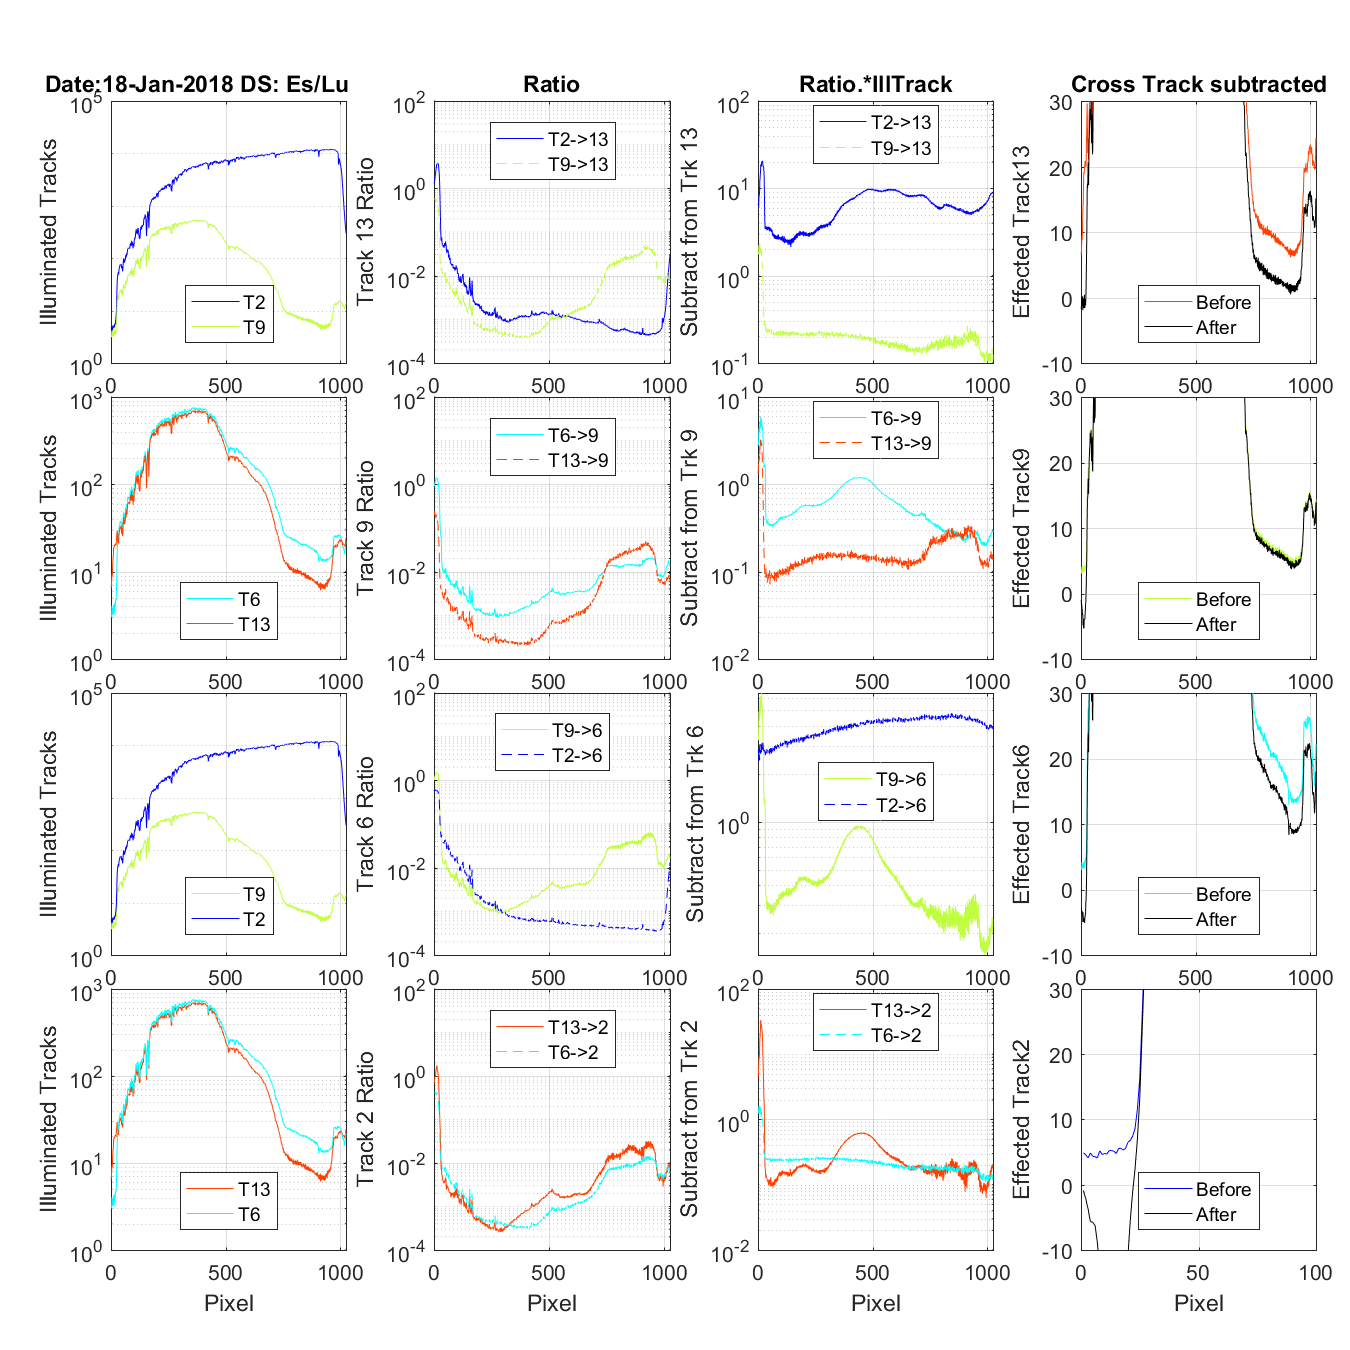
Figure 7 The title on the first row tells the date and if this is an Es/Lu data set (4 rows) or and Lu only data set (3 rows). The first column of graphs shows the tracks that are contaminating the track being corrected (Track in the last column). One of the tracks show in the first column is the mirror tracks causing UV ghosting problems the other is the closest track contamination with regular cross track light. The second column shows the UV or Cross track ratio for the contaminating tracks. The third column is the multiplication of the contaminating track and its ratio. The fourth column is the track being corrected. Before is the original data and after once the cross and UN ghosting contamination is removed. FYI: In the case of the Lu only data on column 2 you wil see the Es track shows as a ratio. But because there is no Es data it is not in any other column.

Figure 8 The title on the first row tells the date and if this is an Es/Lu data set (4 rows) or and Lu only data set (3 rows). The first column of graphs shows the tracks that are contaminating the track being corrected (Track in the last column). One of the tracks show in the first column is the mirror tracks causing UV ghosting problems the other is the closest track contamination with regular cross track light. The second column shows the UV or Cross track ratio for the contaminating tracks. The third column is the multiplication of the contaminating track and its ratio. The fourth column is the track being corrected. Before is the original data and after once the cross and UN ghosting contamination is removed. FYI: In the case of the Lu only data on column 2 you wil see the Es track shows as a ratio. But because there is no Es data it is not in any other column.
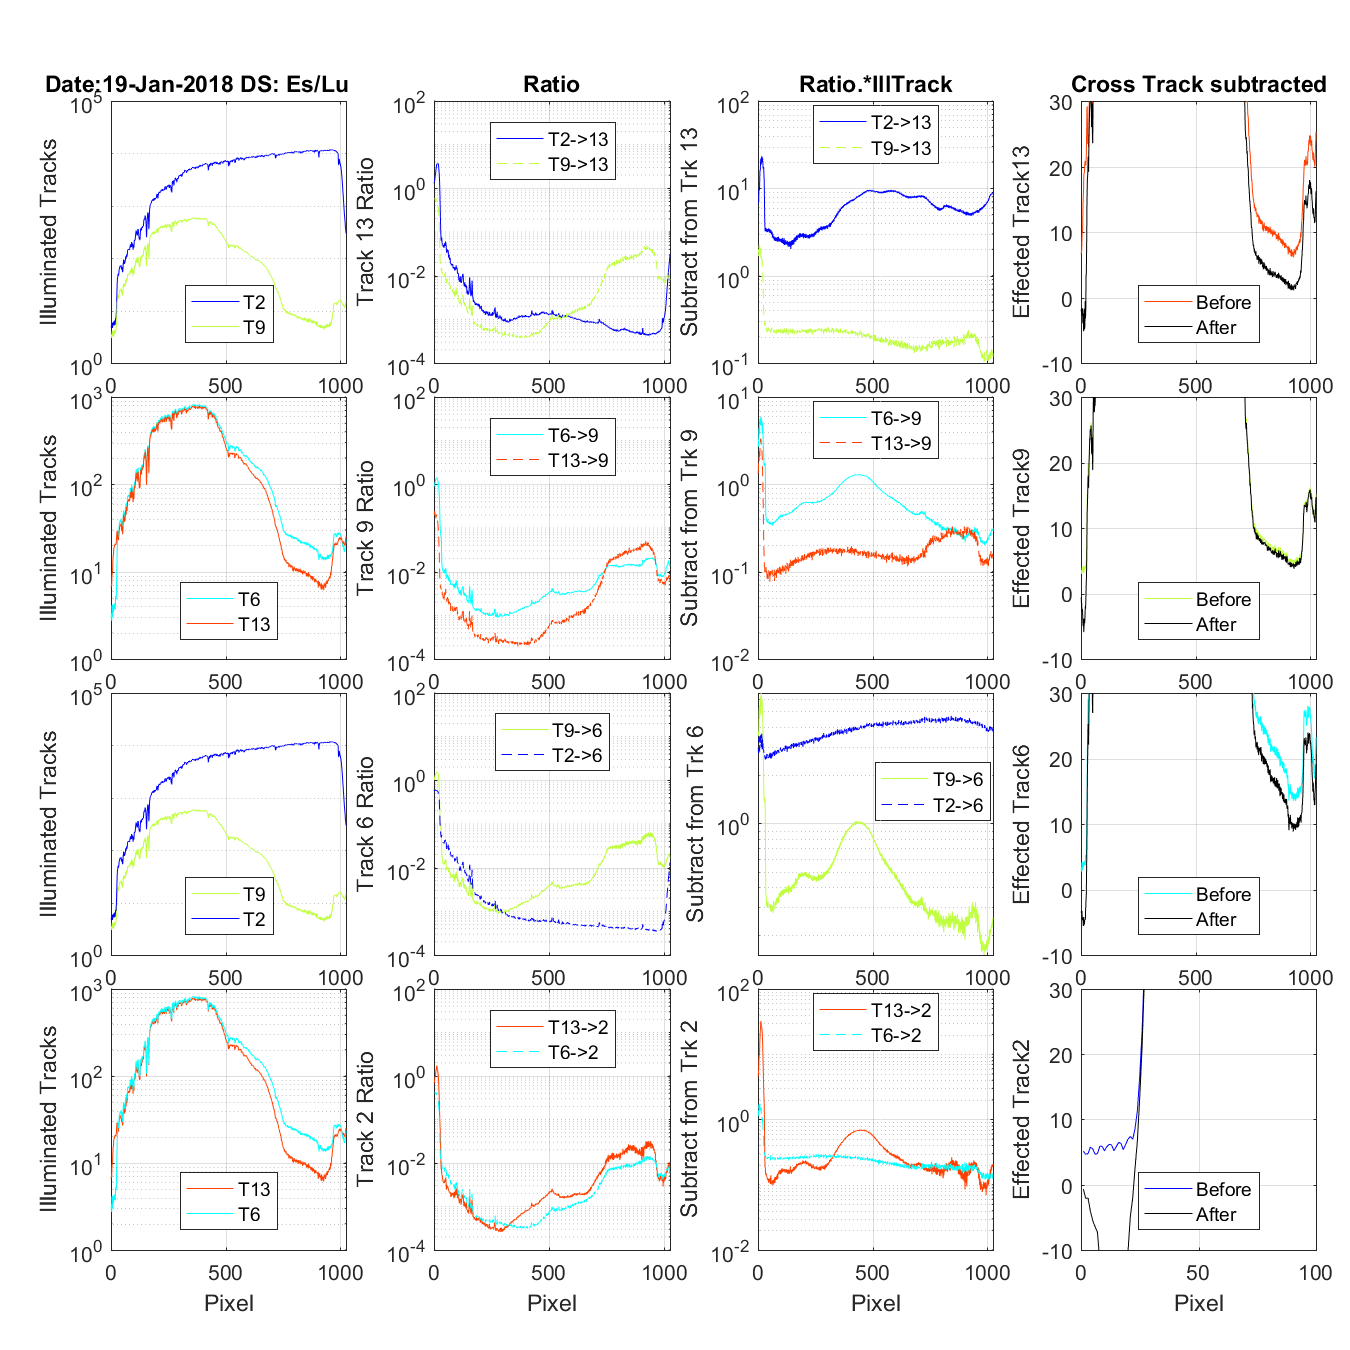
Figure 9 The title on the first row tells the date and if this is an Es/Lu data set (4 rows) or and Lu only data set (3 rows). The first column of graphs shows the tracks that are contaminating the track being corrected (Track in the last column). One of the tracks show in the first column is the mirror tracks causing UV ghosting problems the other is the closest track contamination with regular cross track light. The second column shows the UV or Cross track ratio for the contaminating tracks. The third column is the multiplication of the contaminating track and its ratio. The fourth column is the track being corrected. Before is the original data and after once the cross and UN ghosting contamination is removed. FYI: In the case of the Lu only data on column 2 you wil see the Es track shows as a ratio. But because there is no Es data it is not in any other column.
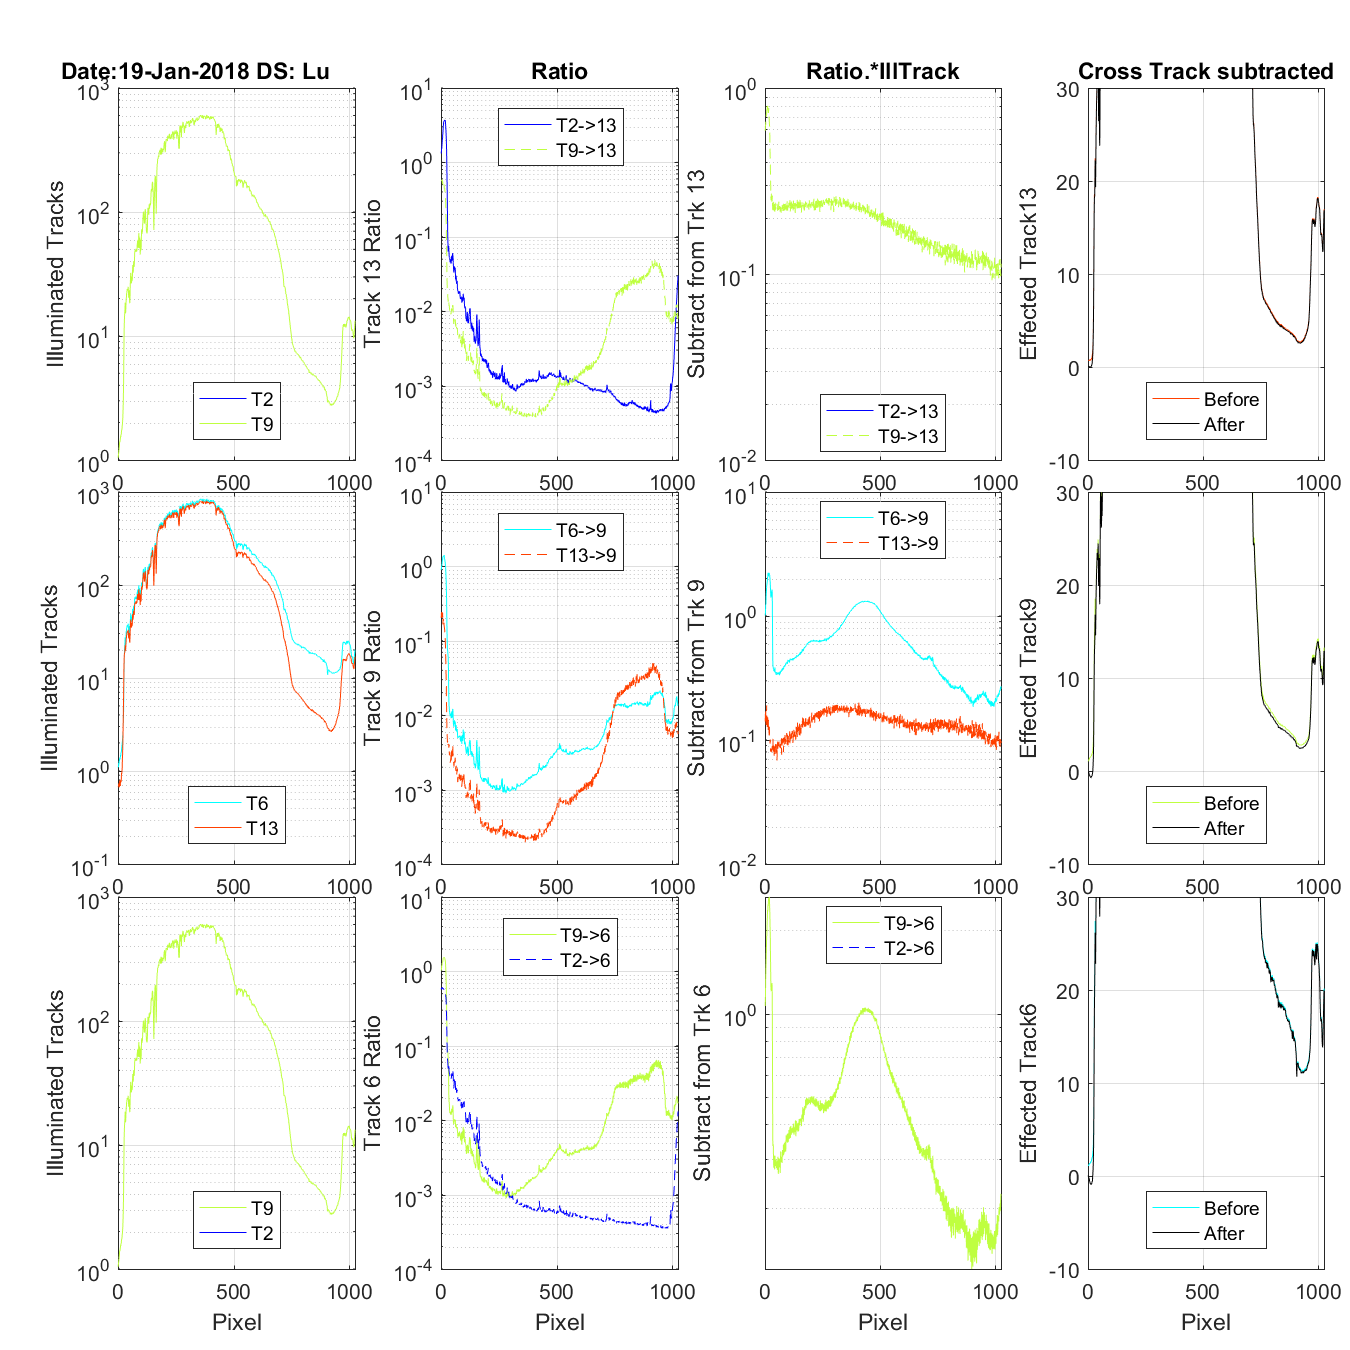
Figure 10 The title on the first row tells the date and if this is an Es/Lu data set (4 rows) or and Lu only data set (3 rows). The first column of graphs shows the tracks that are contaminating the track being corrected (Track in the last column). One of the tracks show in the first column is the mirror tracks causing UV ghosting problems the other is the closest track contamination with regular cross track light. The second column shows the UV or Cross track ratio for the contaminating tracks. The third column is the multiplication of the contaminating track and its ratio. The fourth column is the track being corrected. Before is the original data and after once the cross and UN ghosting contamination is removed. FYI: In the case of the Lu only data on column 2 you wil see the Es track shows as a ratio. But because there is no Es data it is not in any other column.
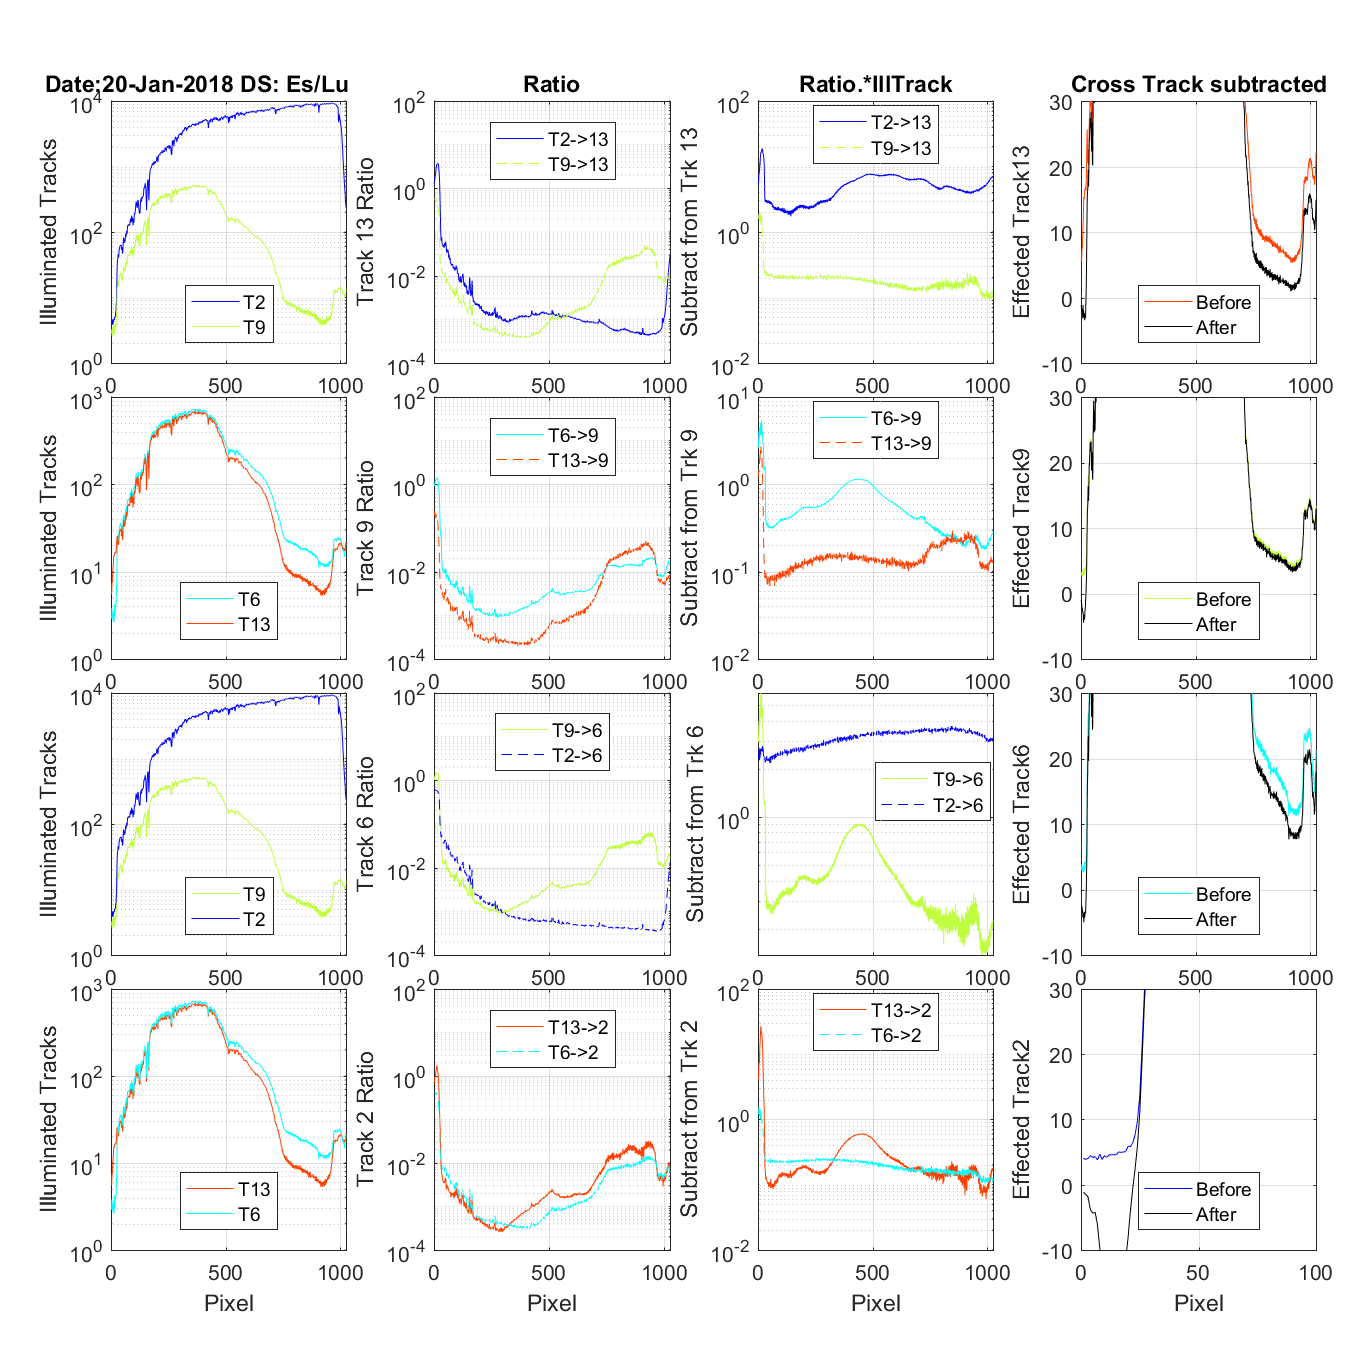
Figure 11 The title on the first row tells the date and if this is an Es/Lu data set (4 rows) or and Lu only data set (3 rows). The first column of graphs shows the tracks that are contaminating the track being corrected (Track in the last column). One of the tracks show in the first column is the mirror tracks causing UV ghosting problems the other is the closest track contamination with regular cross track light. The second column shows the UV or Cross track ratio for the contaminating tracks. The third column is the multiplication of the contaminating track and its ratio. The fourth column is the track being corrected. Before is the original data and after once the cross and UN ghosting contamination is removed. FYI: In the case of the Lu only data on column 2 you wil see the Es track shows as a ratio. But because there is no Es data it is not in any other column.

Figure 12 The title on the first row tells the date and if this is an Es/Lu data set (4 rows) or and Lu only data set (3 rows). The first column of graphs shows the tracks that are contaminating the track being corrected (Track in the last column). One of the tracks show in the first column is the mirror tracks causing UV ghosting problems the other is the closest track contamination with regular cross track light. The second column shows the UV or Cross track ratio for the contaminating tracks. The third column is the multiplication of the contaminating track and its ratio. The fourth column is the track being corrected. Before is the original data and after once the cross and UN ghosting contamination is removed. FYI: In the case of the Lu only data on column 2 you wil see the Es track shows as a ratio. But because there is no Es data it is not in any other column.
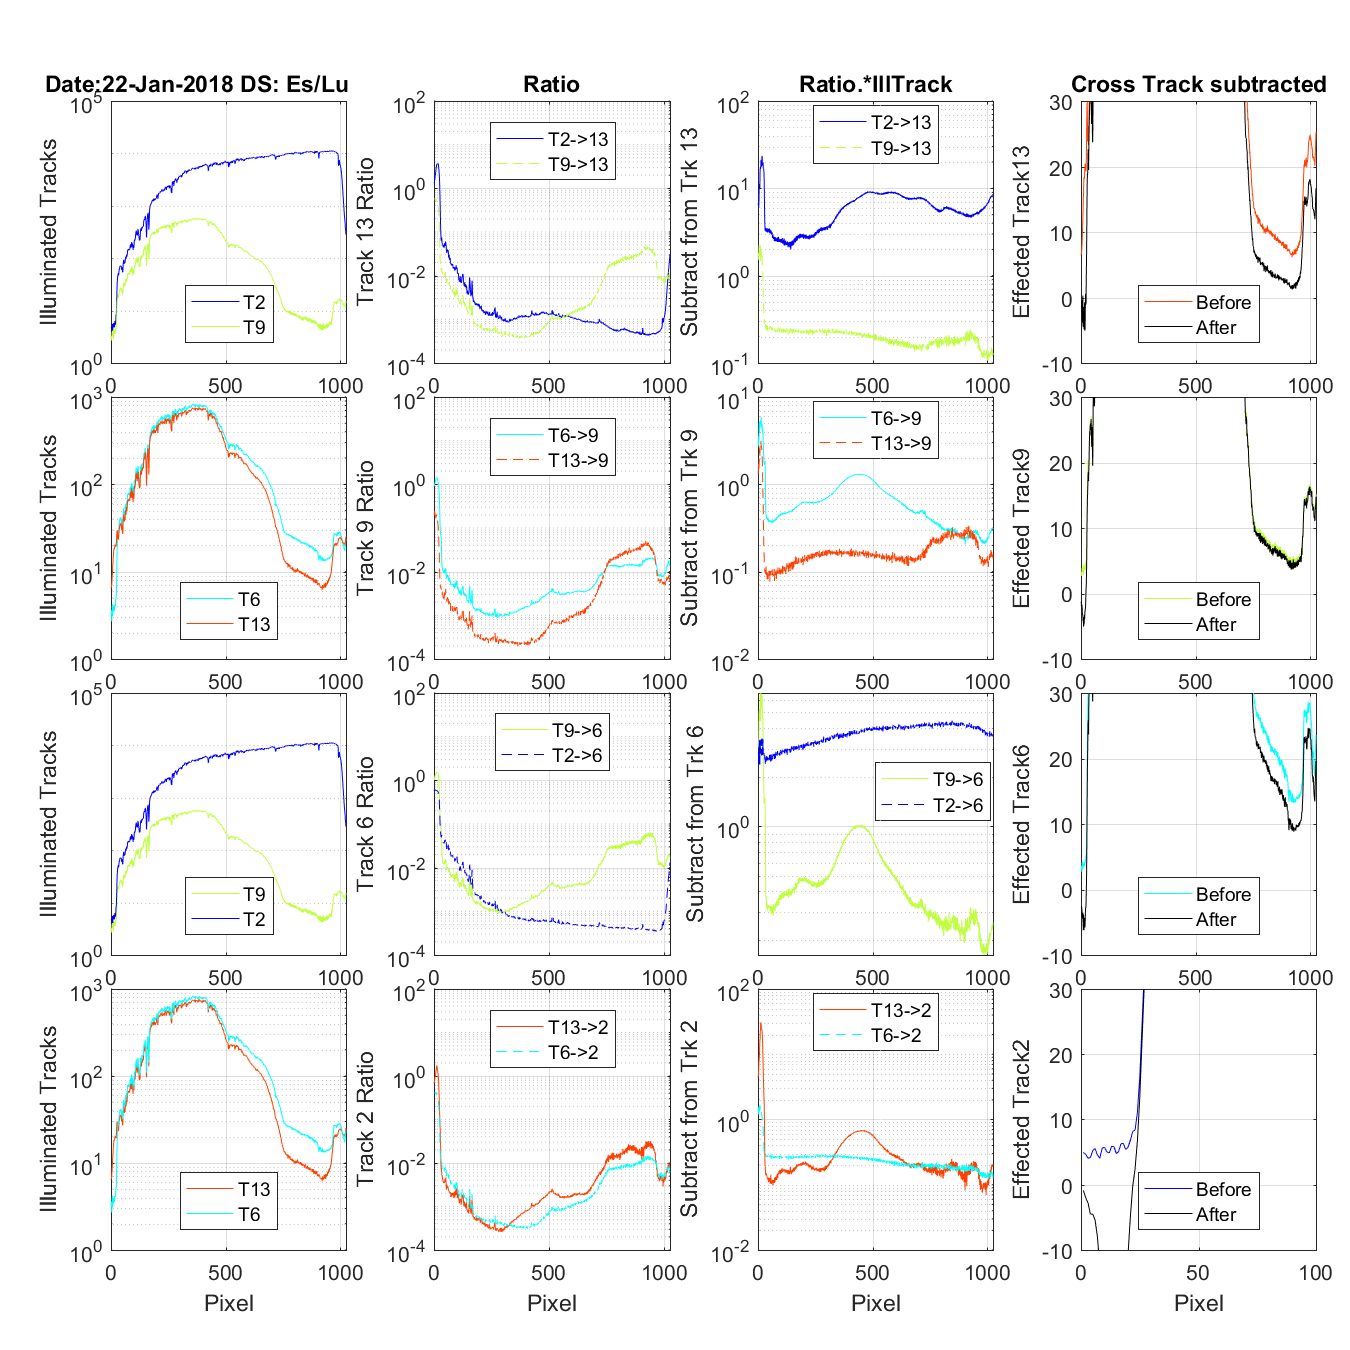
Figure 13 The title on the first row tells the date and if this is an Es/Lu data set (4 rows) or and Lu only data set (3 rows). The first column of graphs shows the tracks that are contaminating the track being corrected (Track in the last column). One of the tracks show in the first column is the mirror tracks causing UV ghosting problems the other is the closest track contamination with regular cross track light. The second column shows the UV or Cross track ratio for the contaminating tracks. The third column is the multiplication of the contaminating track and its ratio. The fourth column is the track being corrected. Before is the original data and after once the cross and UN ghosting contamination is removed. FYI: In the case of the Lu only data on column 2 you wil see the Es track shows as a ratio. But because there is no Es data it is not in any other column.
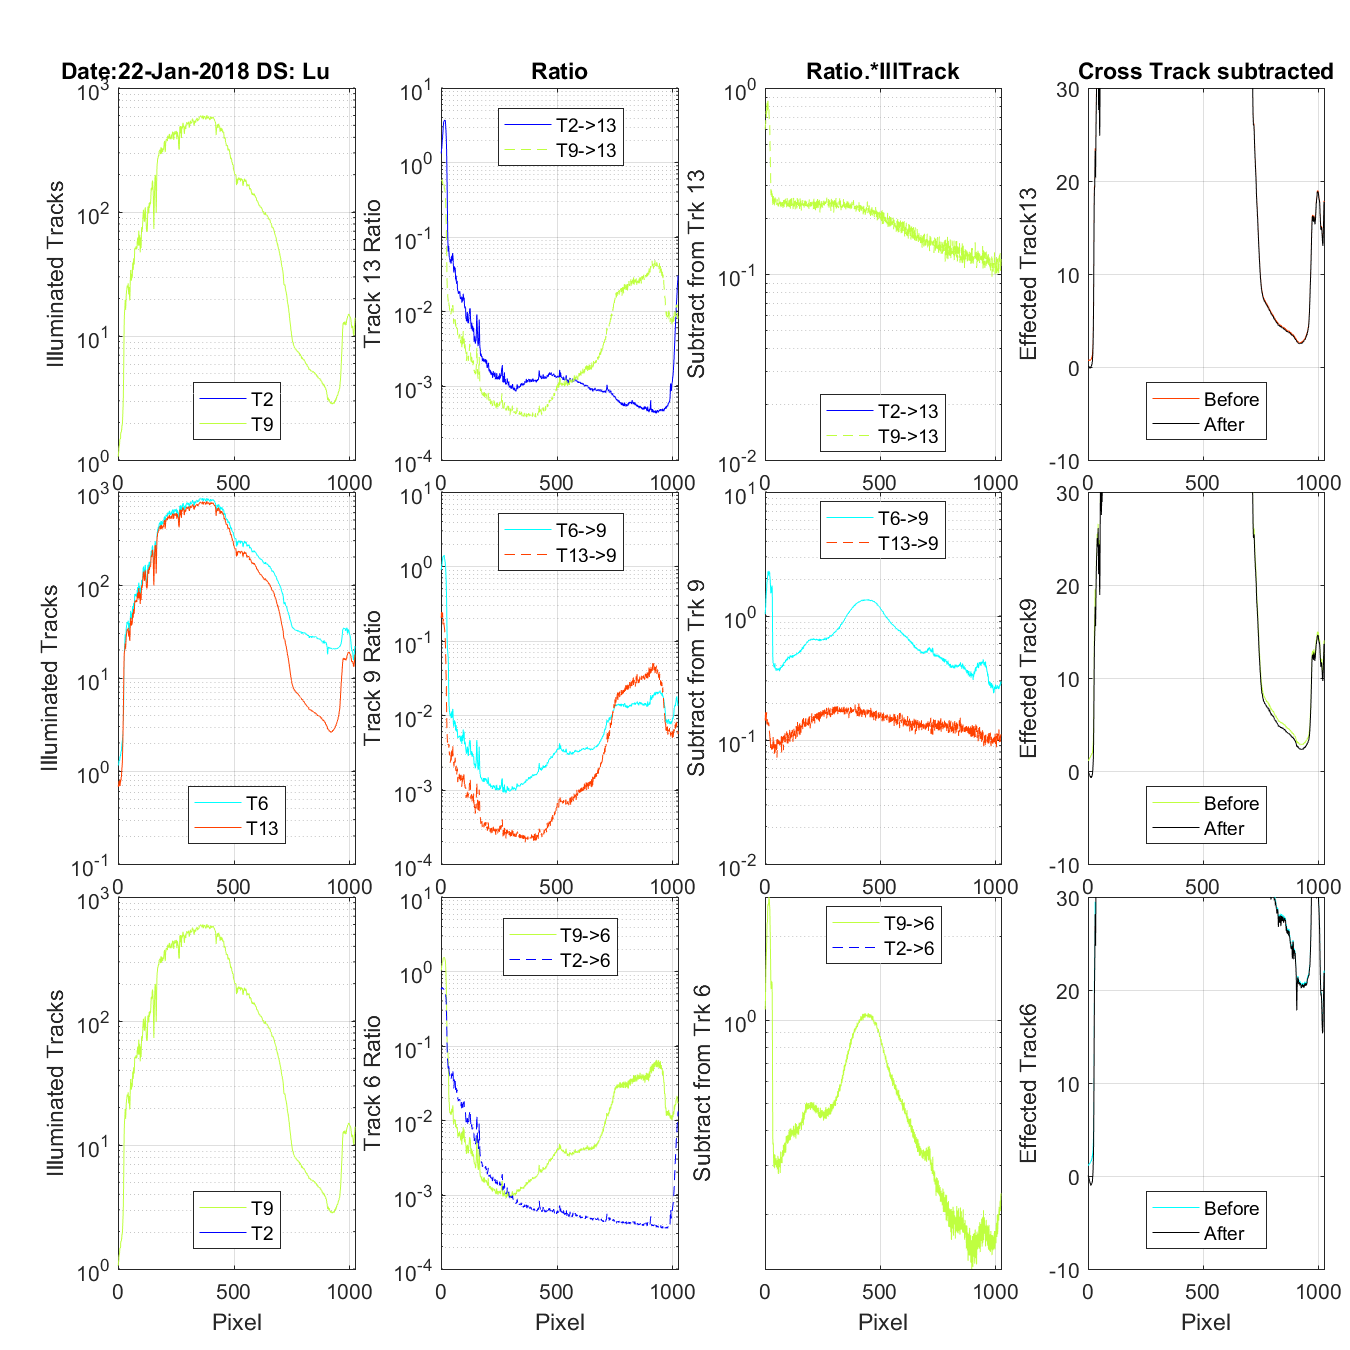
Figure 14 The title on the first row tells the date and if this is an Es/Lu data set (4 rows) or and Lu only data set (3 rows). The first column of graphs shows the tracks that are contaminating the track being corrected (Track in the last column). One of the tracks show in the first column is the mirror tracks causing UV ghosting problems the other is the closest track contamination with regular cross track light. The second column shows the UV or Cross track ratio for the contaminating tracks. The third column is the multiplication of the contaminating track and its ratio. The fourth column is the track being corrected. Before is the original data and after once the cross and UN ghosting contamination is removed. FYI: In the case of the Lu only data on column 2 you wil see the Es track shows as a ratio. But because there is no Es data it is not in any other column.
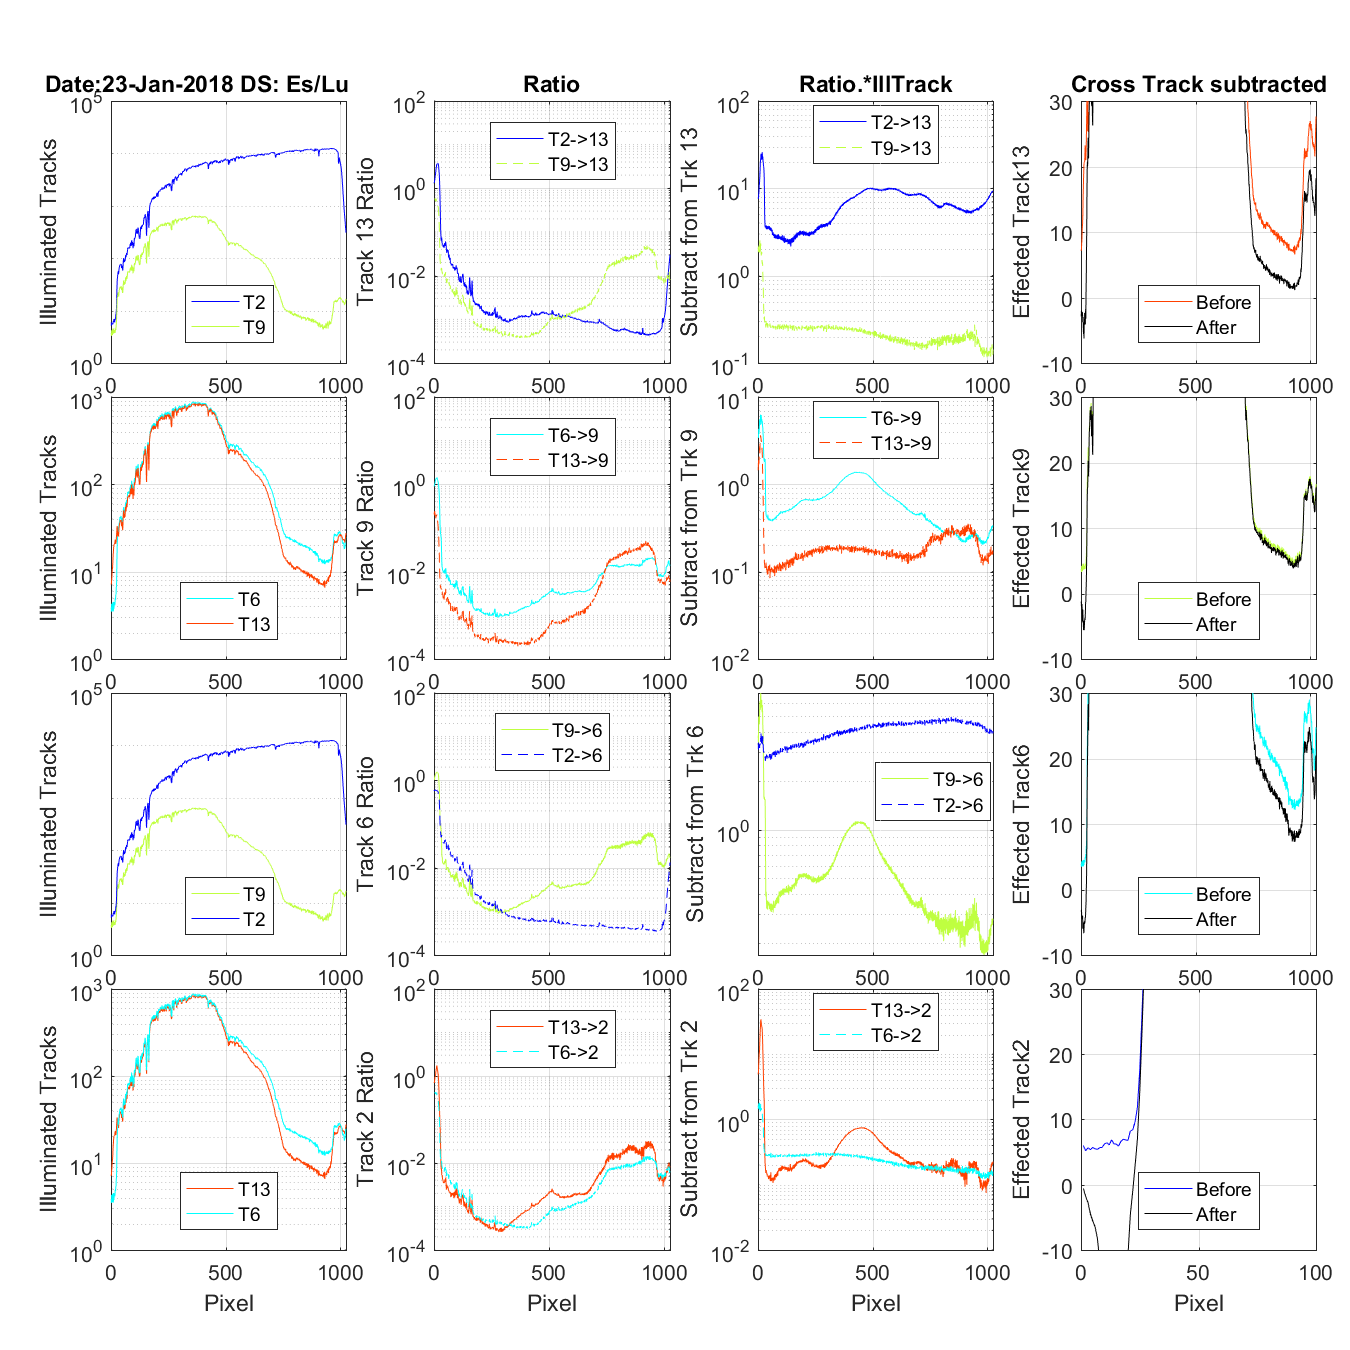
Figure 15 The title on the first row tells the date and if this is an Es/Lu data set (4 rows) or and Lu only data set (3 rows). The first column of graphs shows the tracks that are contaminating the track being corrected (Track in the last column). One of the tracks show in the first column is the mirror tracks causing UV ghosting problems the other is the closest track contamination with regular cross track light. The second column shows the UV or Cross track ratio for the contaminating tracks. The third column is the multiplication of the contaminating track and its ratio. The fourth column is the track being corrected. Before is the original data and after once the cross and UN ghosting contamination is removed. FYI: In the case of the Lu only data on column 2 you wil see the Es track shows as a ratio. But because there is no Es data it is not in any other column.

Figure 16 The title on the first row tells the date and if this is an Es/Lu data set (4 rows) or and Lu only data set (3 rows). The first column of graphs shows the tracks that are contaminating the track being corrected (Track in the last column). One of the tracks show in the first column is the mirror tracks causing UV ghosting problems the other is the closest track contamination with regular cross track light. The second column shows the UV or Cross track ratio for the contaminating tracks. The third column is the multiplication of the contaminating track and its ratio. The fourth column is the track being corrected. Before is the original data and after once the cross and UN ghosting contamination is removed. FYI: In the case of the Lu only data on column 2 you wil see the Es track shows as a ratio. But because there is no Es data it is not in any other column.
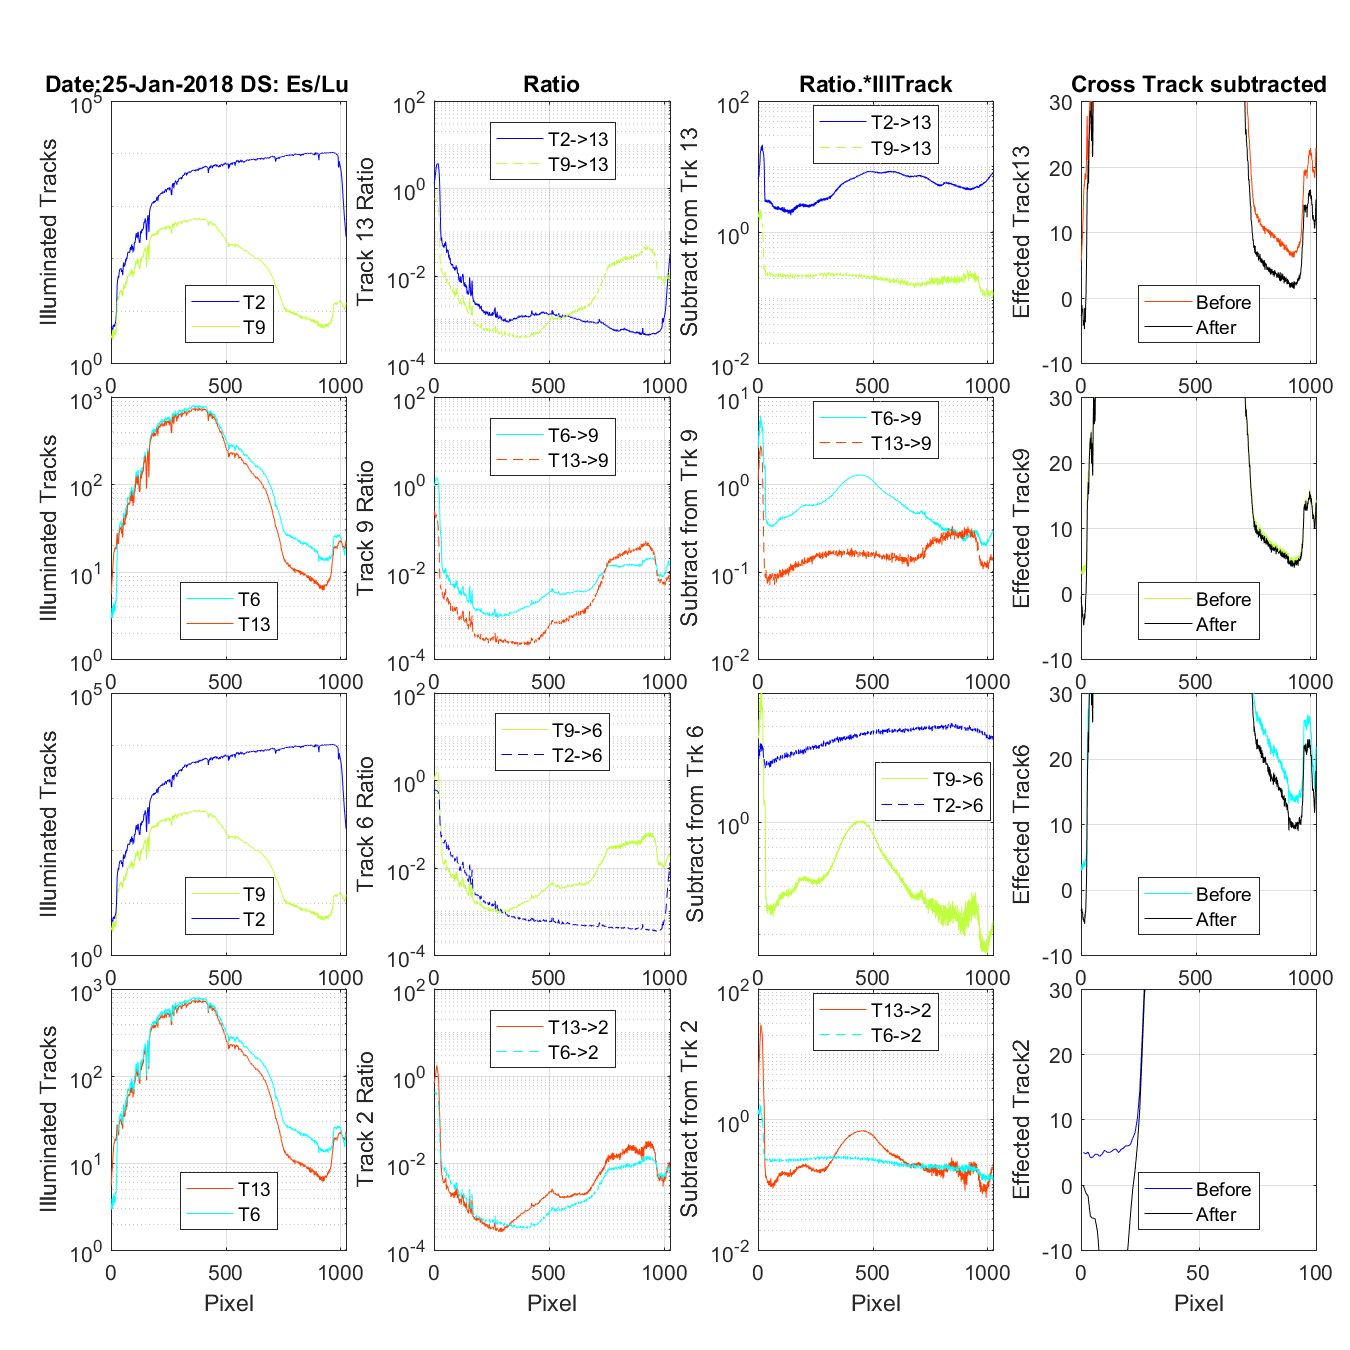
Figure 17 The title on the first row tells the date and if this is an Es/Lu data set (4 rows) or and Lu only data set (3 rows). The first column of graphs shows the tracks that are contaminating the track being corrected (Track in the last column). One of the tracks show in the first column is the mirror tracks causing UV ghosting problems the other is the closest track contamination with regular cross track light. The second column shows the UV or Cross track ratio for the contaminating tracks. The third column is the multiplication of the contaminating track and its ratio. The fourth column is the track being corrected. Before is the original data and after once the cross and UN ghosting contamination is removed. FYI: In the case of the Lu only data on column 2 you wil see the Es track shows as a ratio. But because there is no Es data it is not in any other column.
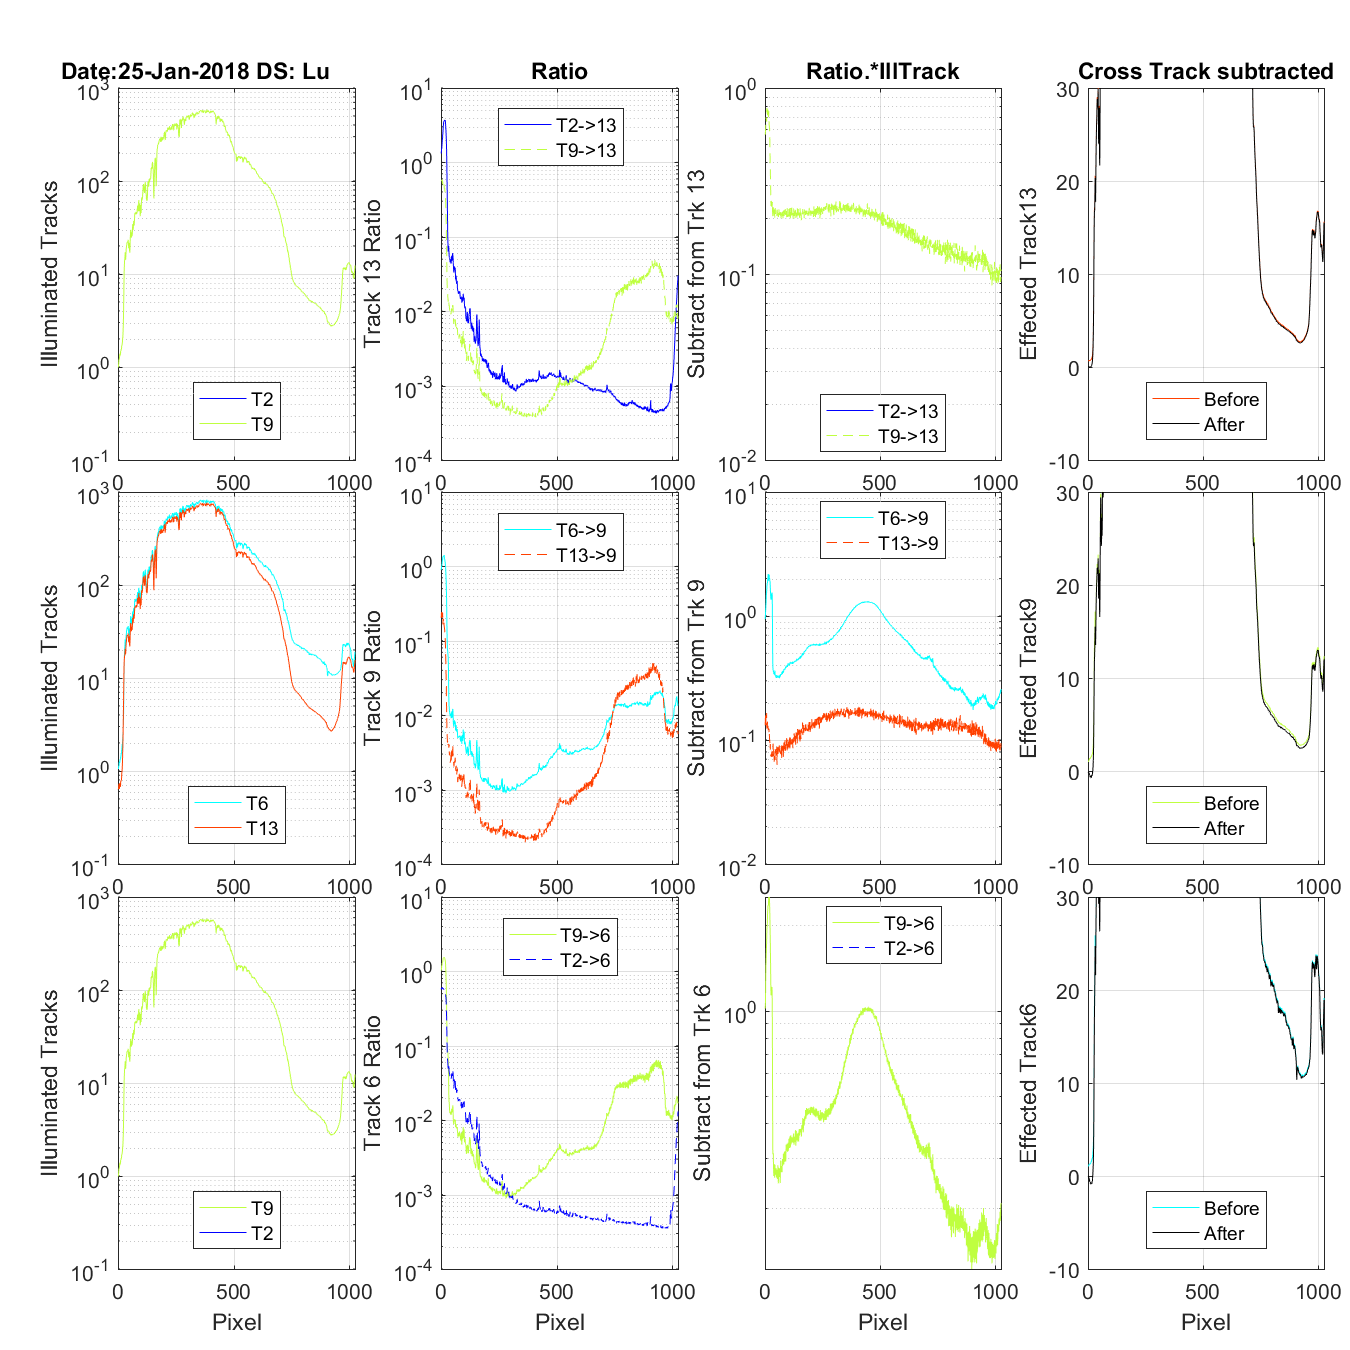
Figure 18 The title on the first row tells the date and if this is an Es/Lu data set (4 rows) or and Lu only data set (3 rows). The first column of graphs shows the tracks that are contaminating the track being corrected (Track in the last column). One of the tracks show in the first column is the mirror tracks causing UV ghosting problems the other is the closest track contamination with regular cross track light. The second column shows the UV or Cross track ratio for the contaminating tracks. The third column is the multiplication of the contaminating track and its ratio. The fourth column is the track being corrected. Before is the original data and after once the cross and UN ghosting contamination is removed. FYI: In the case of the Lu only data on column 2 you wil see the Es track shows as a ratio. But because there is no Es data it is not in any other column.
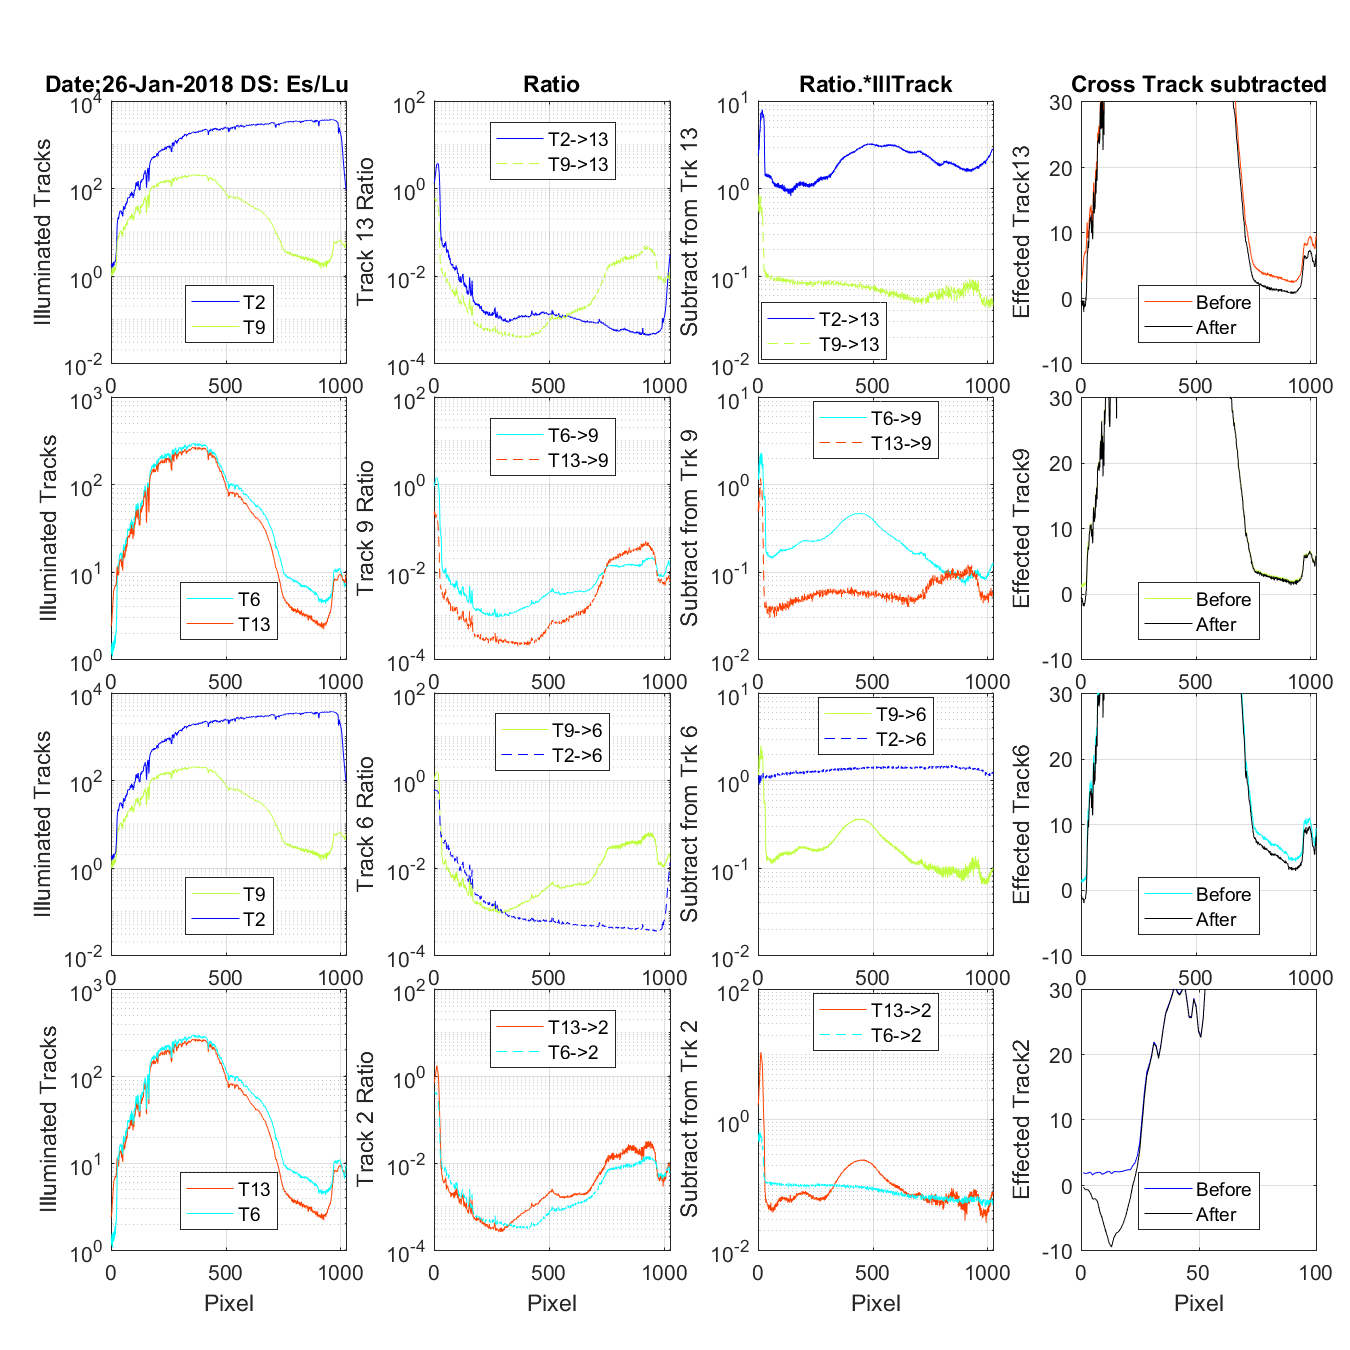
Figure 19 The title on the first row tells the date and if this is an Es/Lu data set (4 rows) or and Lu only data set (3 rows). The first column of graphs shows the tracks that are contaminating the track being corrected (Track in the last column). One of the tracks show in the first column is the mirror tracks causing UV ghosting problems the other is the closest track contamination with regular cross track light. The second column shows the UV or Cross track ratio for the contaminating tracks. The third column is the multiplication of the contaminating track and its ratio. The fourth column is the track being corrected. Before is the original data and after once the cross and UN ghosting contamination is removed. FYI: In the case of the Lu only data on column 2 you wil see the Es track shows as a ratio. But because there is no Es data it is not in any other column.
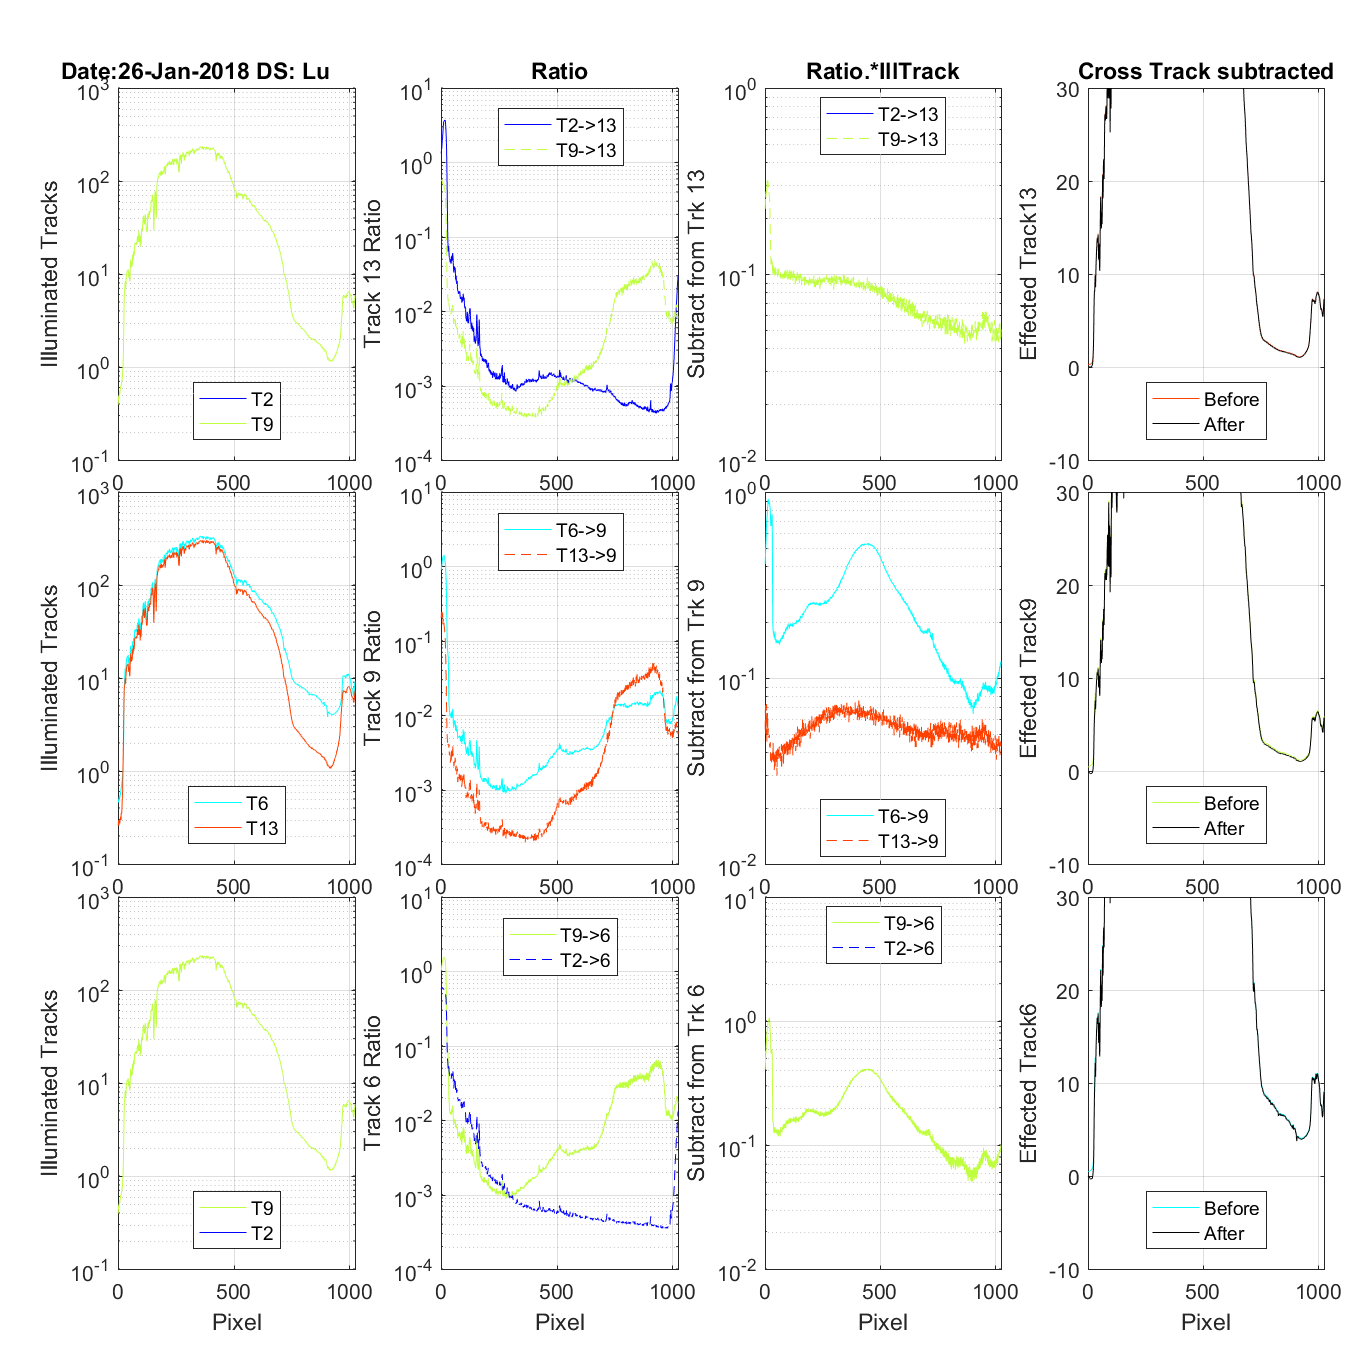
Figure 20 The title on the first row tells the date and if this is an Es/Lu data set (4 rows) or and Lu only data set (3 rows). The first column of graphs shows the tracks that are contaminating the track being corrected (Track in the last column). One of the tracks show in the first column is the mirror tracks causing UV ghosting problems the other is the closest track contamination with regular cross track light. The second column shows the UV or Cross track ratio for the contaminating tracks. The third column is the multiplication of the contaminating track and its ratio. The fourth column is the track being corrected. Before is the original data and after once the cross and UN ghosting contamination is removed. FYI: In the case of the Lu only data on column 2 you wil see the Es track shows as a ratio. But because there is no Es data it is not in any other column.
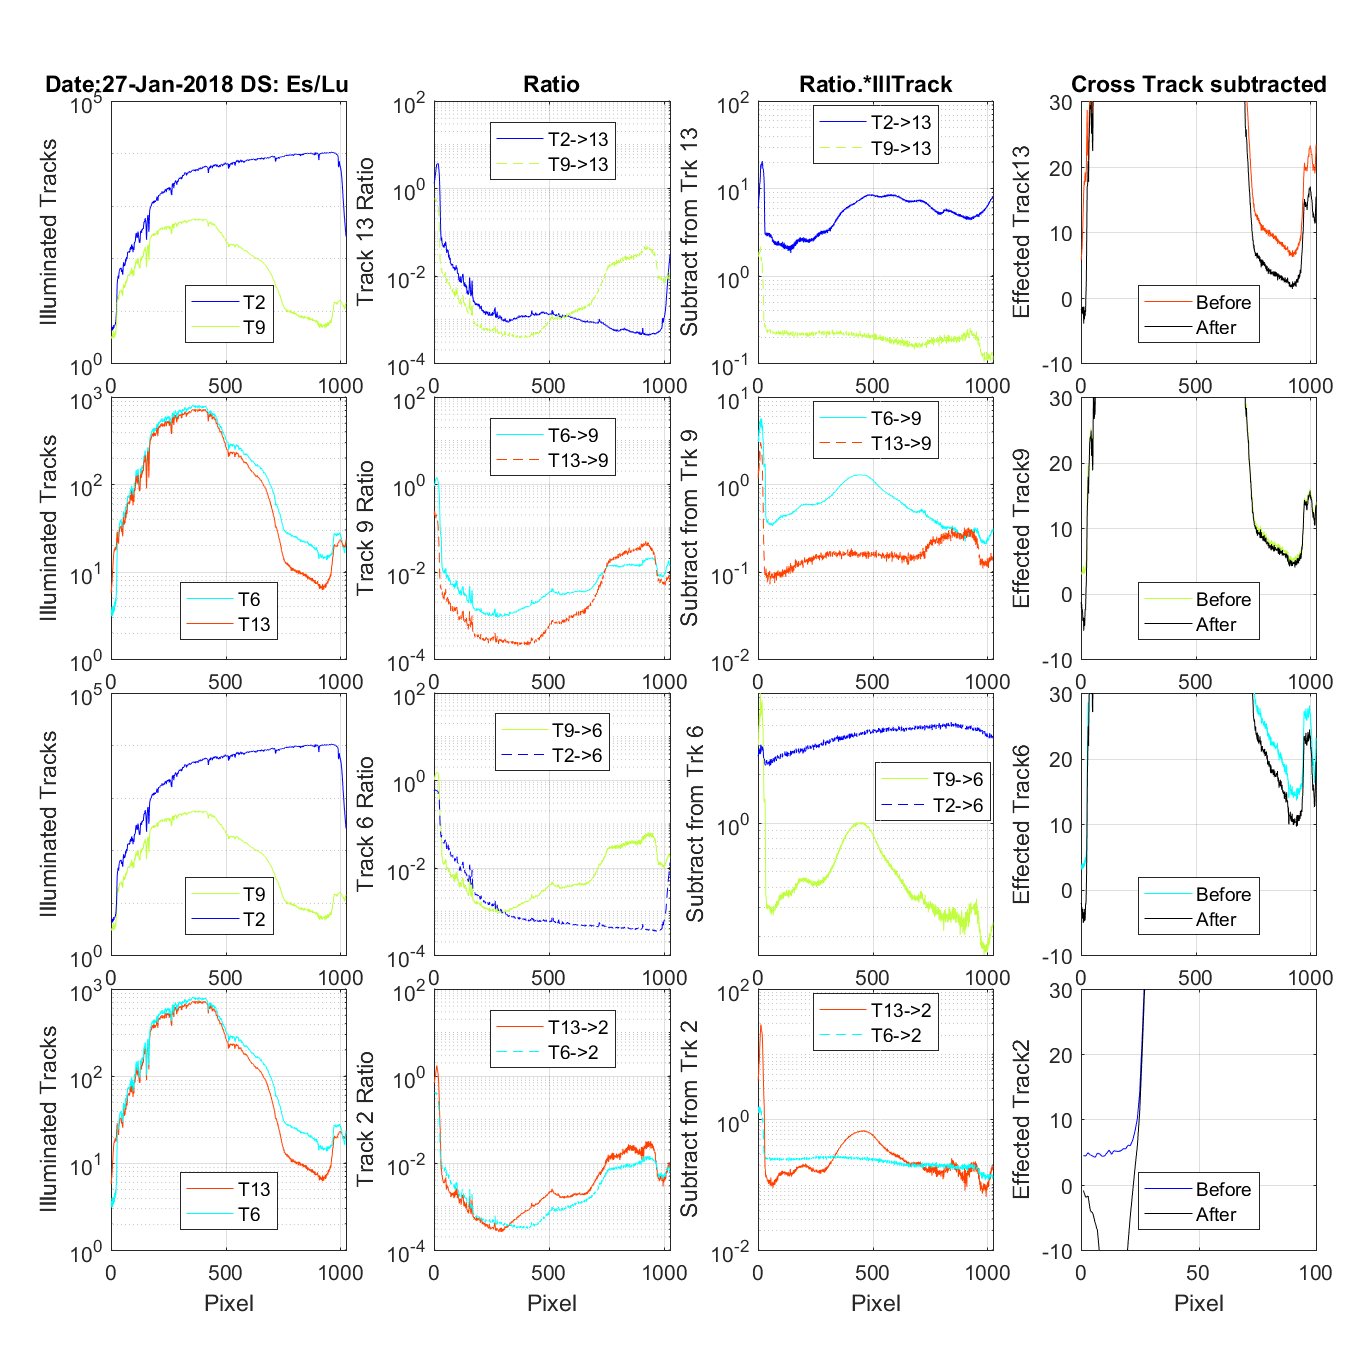
Figure 21 The title on the first row tells the date and if this is an Es/Lu data set (4 rows) or and Lu only data set (3 rows). The first column of graphs shows the tracks that are contaminating the track being corrected (Track in the last column). One of the tracks show in the first column is the mirror tracks causing UV ghosting problems the other is the closest track contamination with regular cross track light. The second column shows the UV or Cross track ratio for the contaminating tracks. The third column is the multiplication of the contaminating track and its ratio. The fourth column is the track being corrected. Before is the original data and after once the cross and UN ghosting contamination is removed. FYI: In the case of the Lu only data on column 2 you wil see the Es track shows as a ratio. But because there is no Es data it is not in any other column.
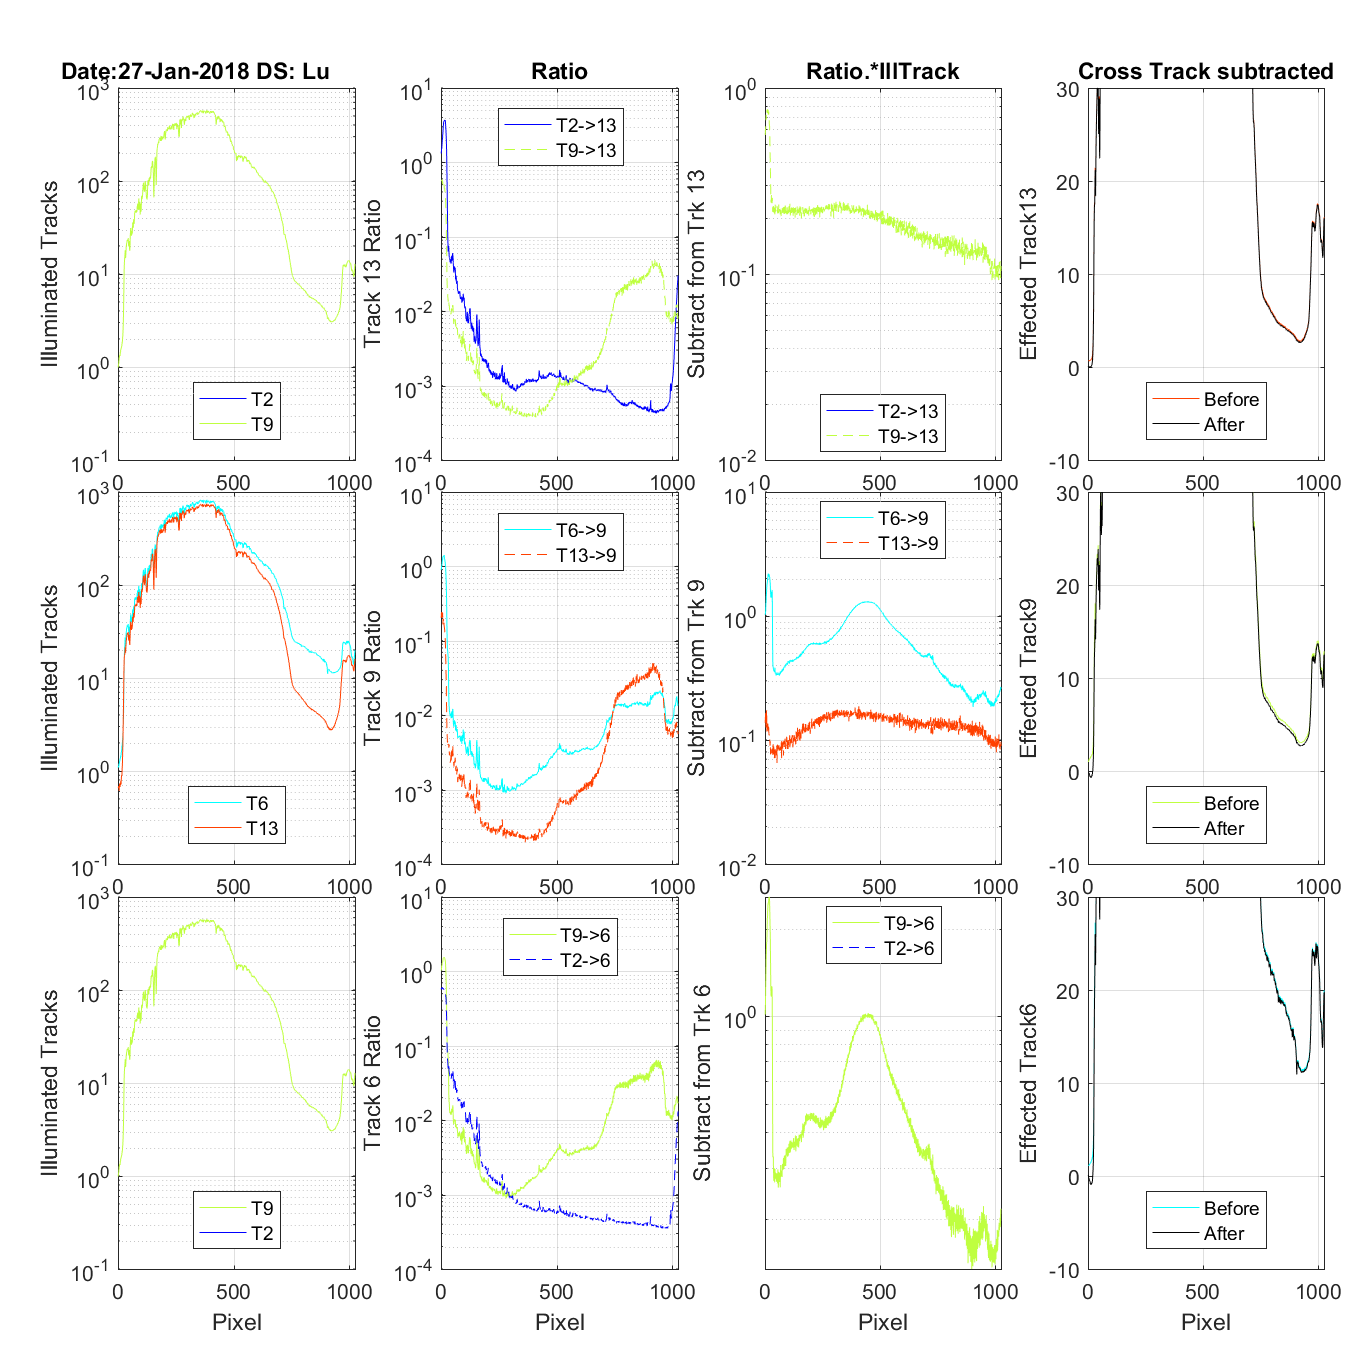
Figure 22 The title on the first row tells the date and if this is an Es/Lu data set (4 rows) or and Lu only data set (3 rows). The first column of graphs shows the tracks that are contaminating the track being corrected (Track in the last column). One of the tracks show in the first column is the mirror tracks causing UV ghosting problems the other is the closest track contamination with regular cross track light. The second column shows the UV or Cross track ratio for the contaminating tracks. The third column is the multiplication of the contaminating track and its ratio. The fourth column is the track being corrected. Before is the original data and after once the cross and UN ghosting contamination is removed. FYI: In the case of the Lu only data on column 2 you wil see the Es track shows as a ratio. But because there is no Es data it is not in any other column.
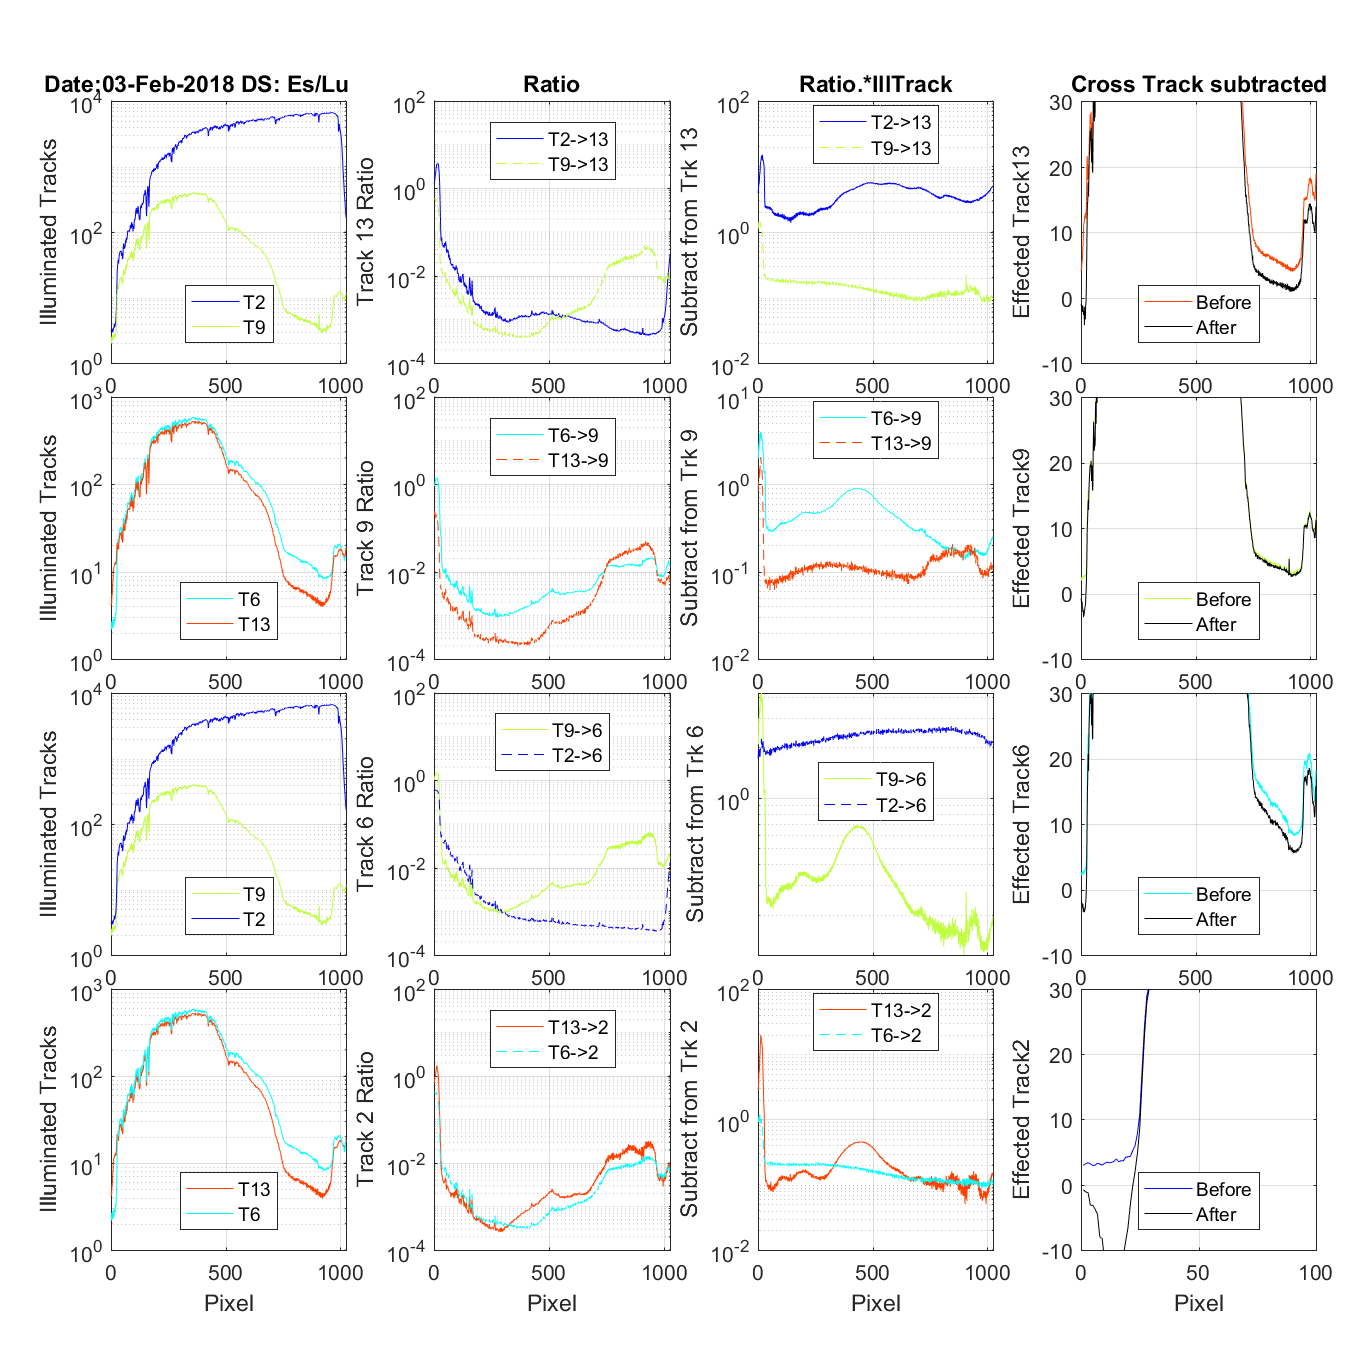
Figure 23 The title on the first row tells the date and if this is an Es/Lu data set (4 rows) or and Lu only data set (3 rows). The first column of graphs shows the tracks that are contaminating the track being corrected (Track in the last column). One of the tracks show in the first column is the mirror tracks causing UV ghosting problems the other is the closest track contamination with regular cross track light. The second column shows the UV or Cross track ratio for the contaminating tracks. The third column is the multiplication of the contaminating track and its ratio. The fourth column is the track being corrected. Before is the original data and after once the cross and UN ghosting contamination is removed. FYI: In the case of the Lu only data on column 2 you wil see the Es track shows as a ratio. But because there is no Es data it is not in any other column.
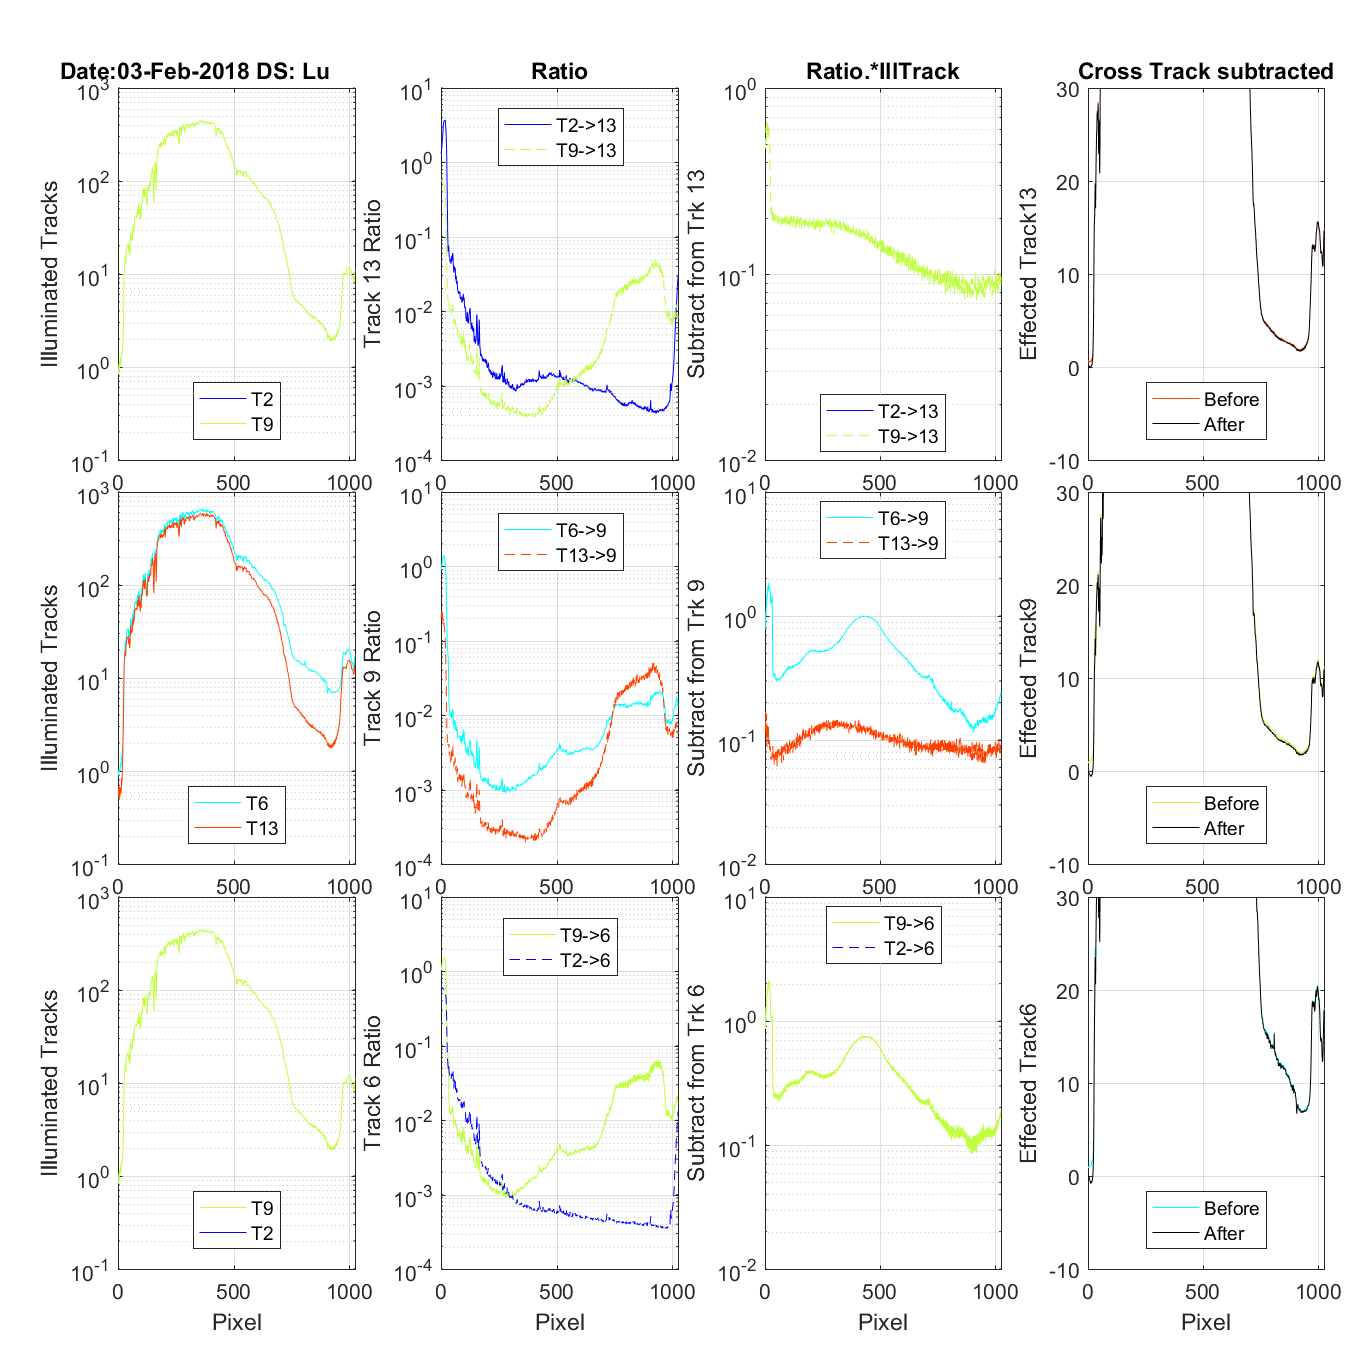
Figure 24 The title on the first row tells the date and if this is an Es/Lu data set (4 rows) or and Lu only data set (3 rows). The first column of graphs shows the tracks that are contaminating the track being corrected (Track in the last column). One of the tracks show in the first column is the mirror tracks causing UV ghosting problems the other is the closest track contamination with regular cross track light. The second column shows the UV or Cross track ratio for the contaminating tracks. The third column is the multiplication of the contaminating track and its ratio. The fourth column is the track being corrected. Before is the original data and after once the cross and UN ghosting contamination is removed. FYI: In the case of the Lu only data on column 2 you wil see the Es track shows as a ratio. But because there is no Es data it is not in any other column.
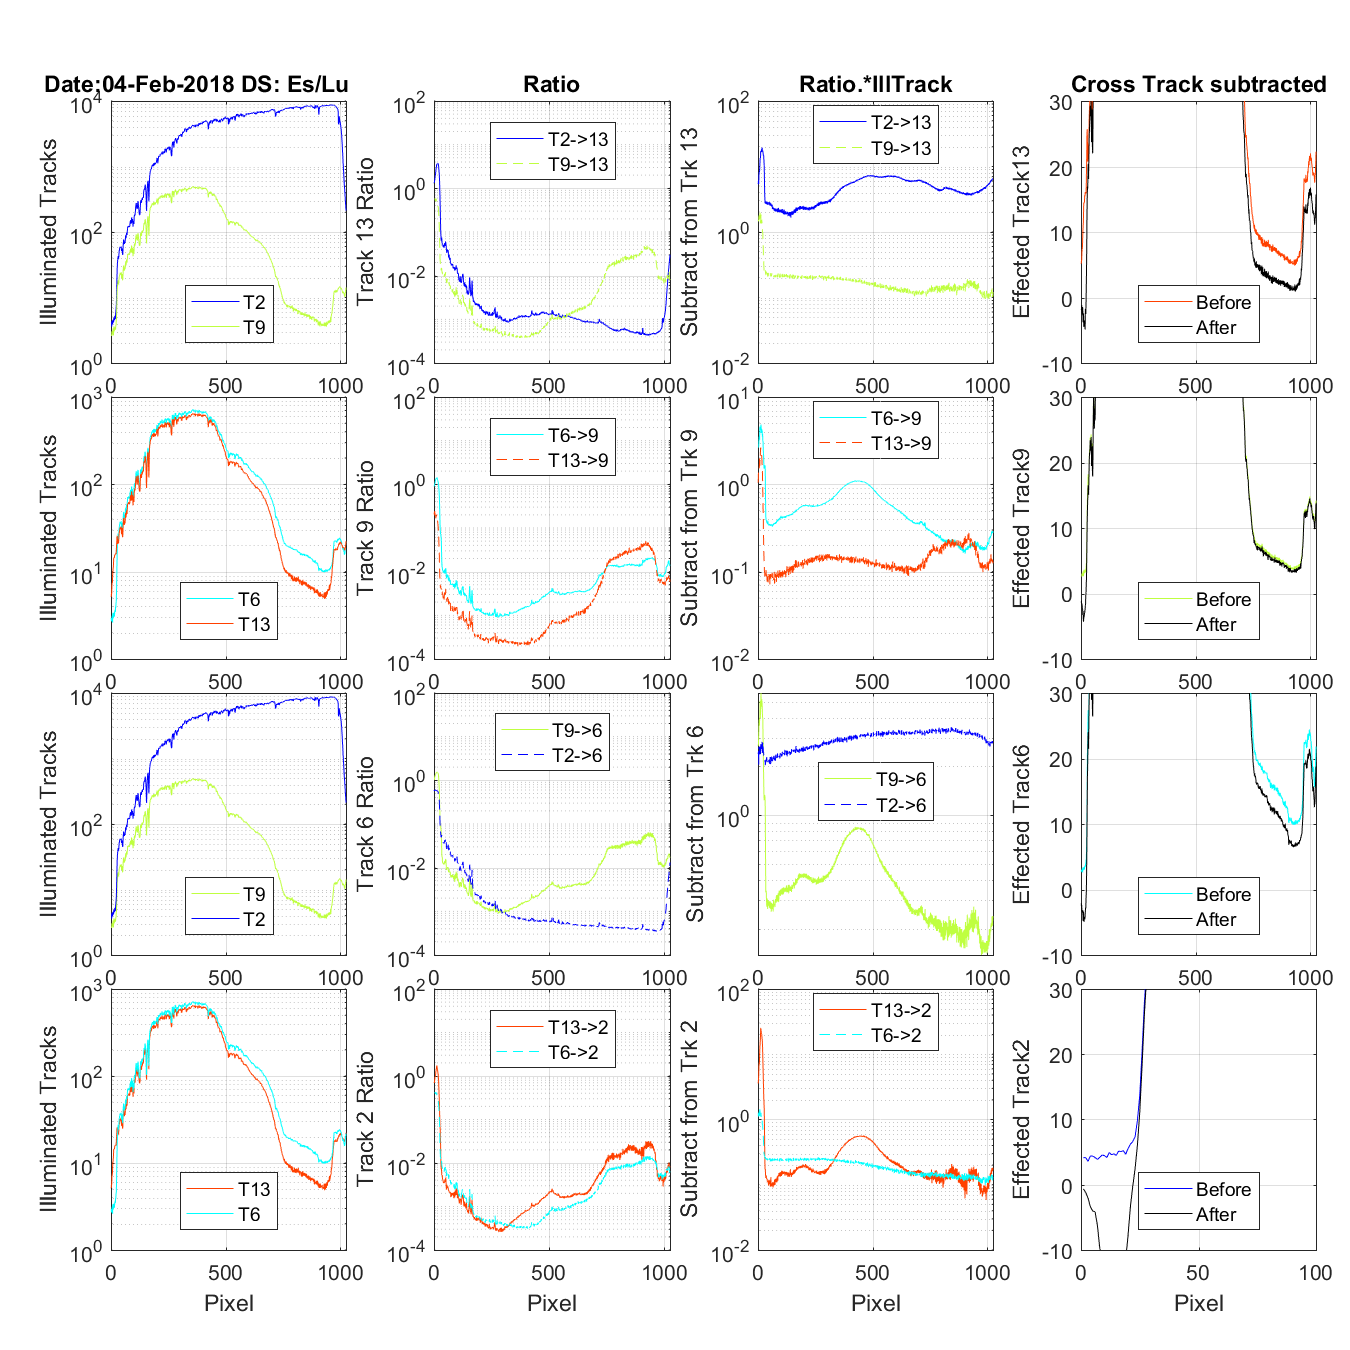
Figure 25 The title on the first row tells the date and if this is an Es/Lu data set (4 rows) or and Lu only data set (3 rows). The first column of graphs shows the tracks that are contaminating the track being corrected (Track in the last column). One of the tracks show in the first column is the mirror tracks causing UV ghosting problems the other is the closest track contamination with regular cross track light. The second column shows the UV or Cross track ratio for the contaminating tracks. The third column is the multiplication of the contaminating track and its ratio. The fourth column is the track being corrected. Before is the original data and after once the cross and UN ghosting contamination is removed. FYI: In the case of the Lu only data on column 2 you wil see the Es track shows as a ratio. But because there is no Es data it is not in any other column.
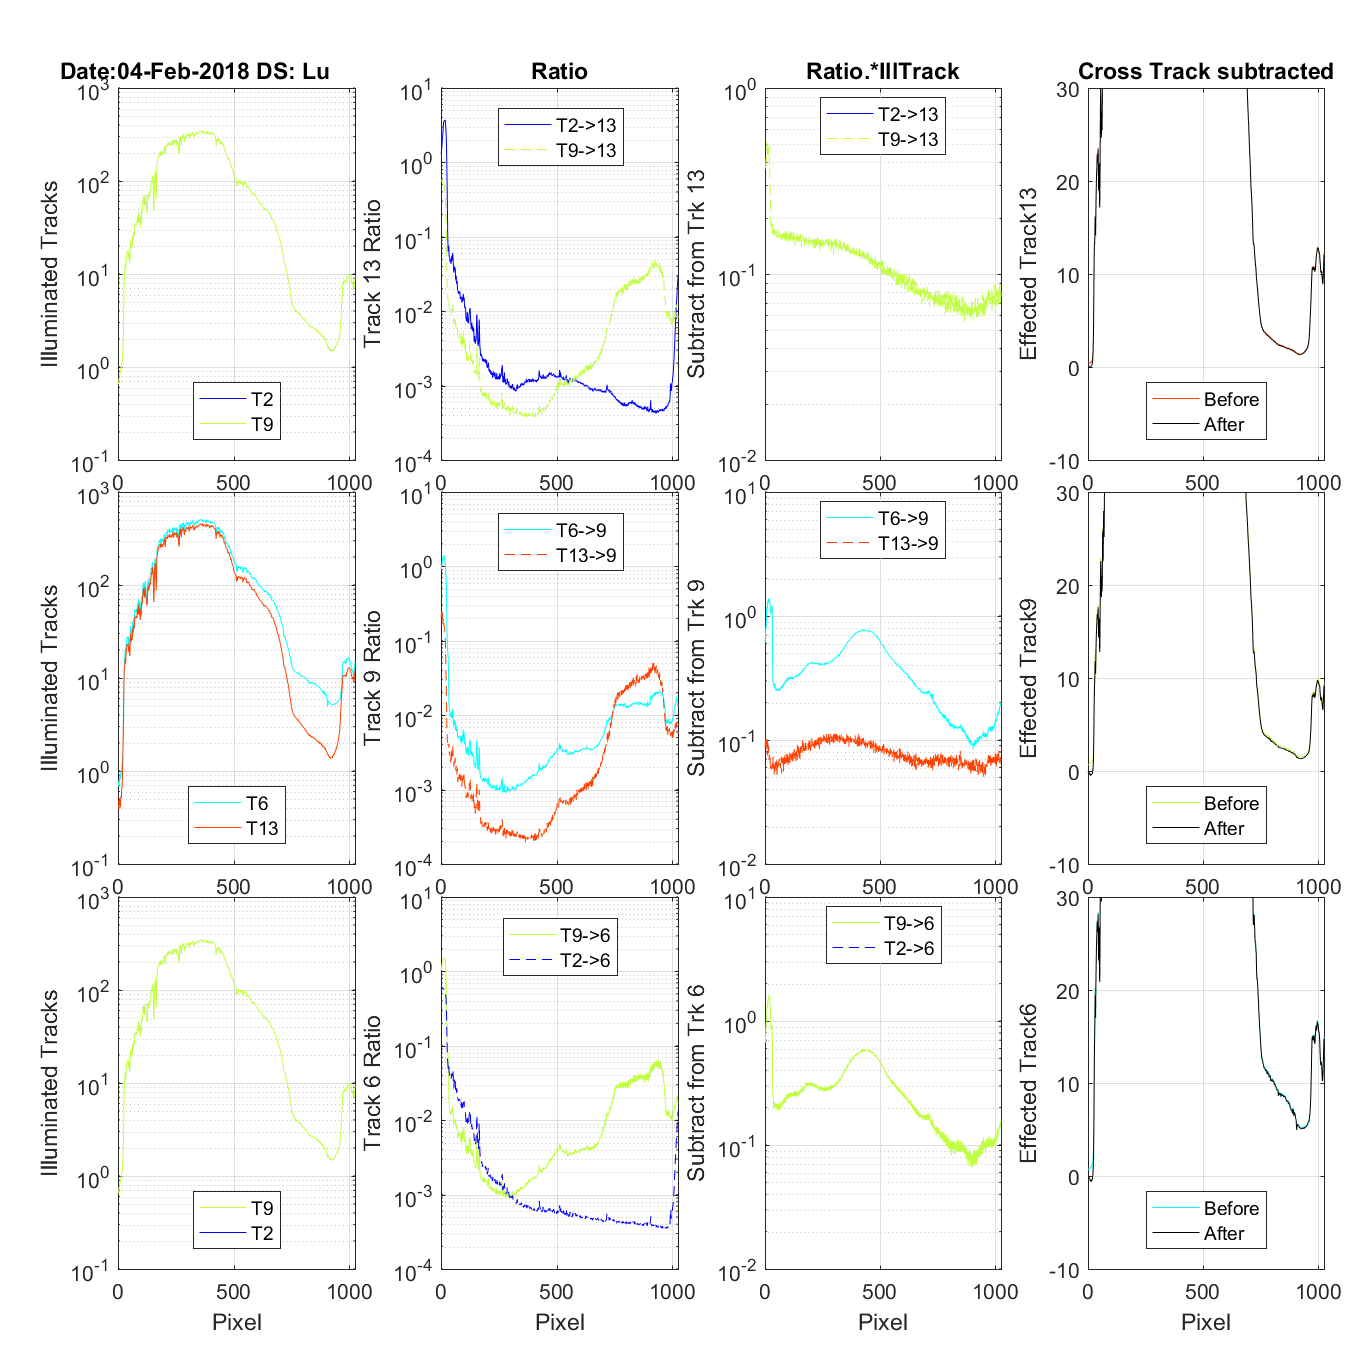
Figure 26 The title on the first row tells the date and if this is an Es/Lu data set (4 rows) or and Lu only data set (3 rows). The first column of graphs shows the tracks that are contaminating the track being corrected (Track in the last column). One of the tracks show in the first column is the mirror tracks causing UV ghosting problems the other is the closest track contamination with regular cross track light. The second column shows the UV or Cross track ratio for the contaminating tracks. The third column is the multiplication of the contaminating track and its ratio. The fourth column is the track being corrected. Before is the original data and after once the cross and UN ghosting contamination is removed. FYI: In the case of the Lu only data on column 2 you wil see the Es track shows as a ratio. But because there is no Es data it is not in any other column.
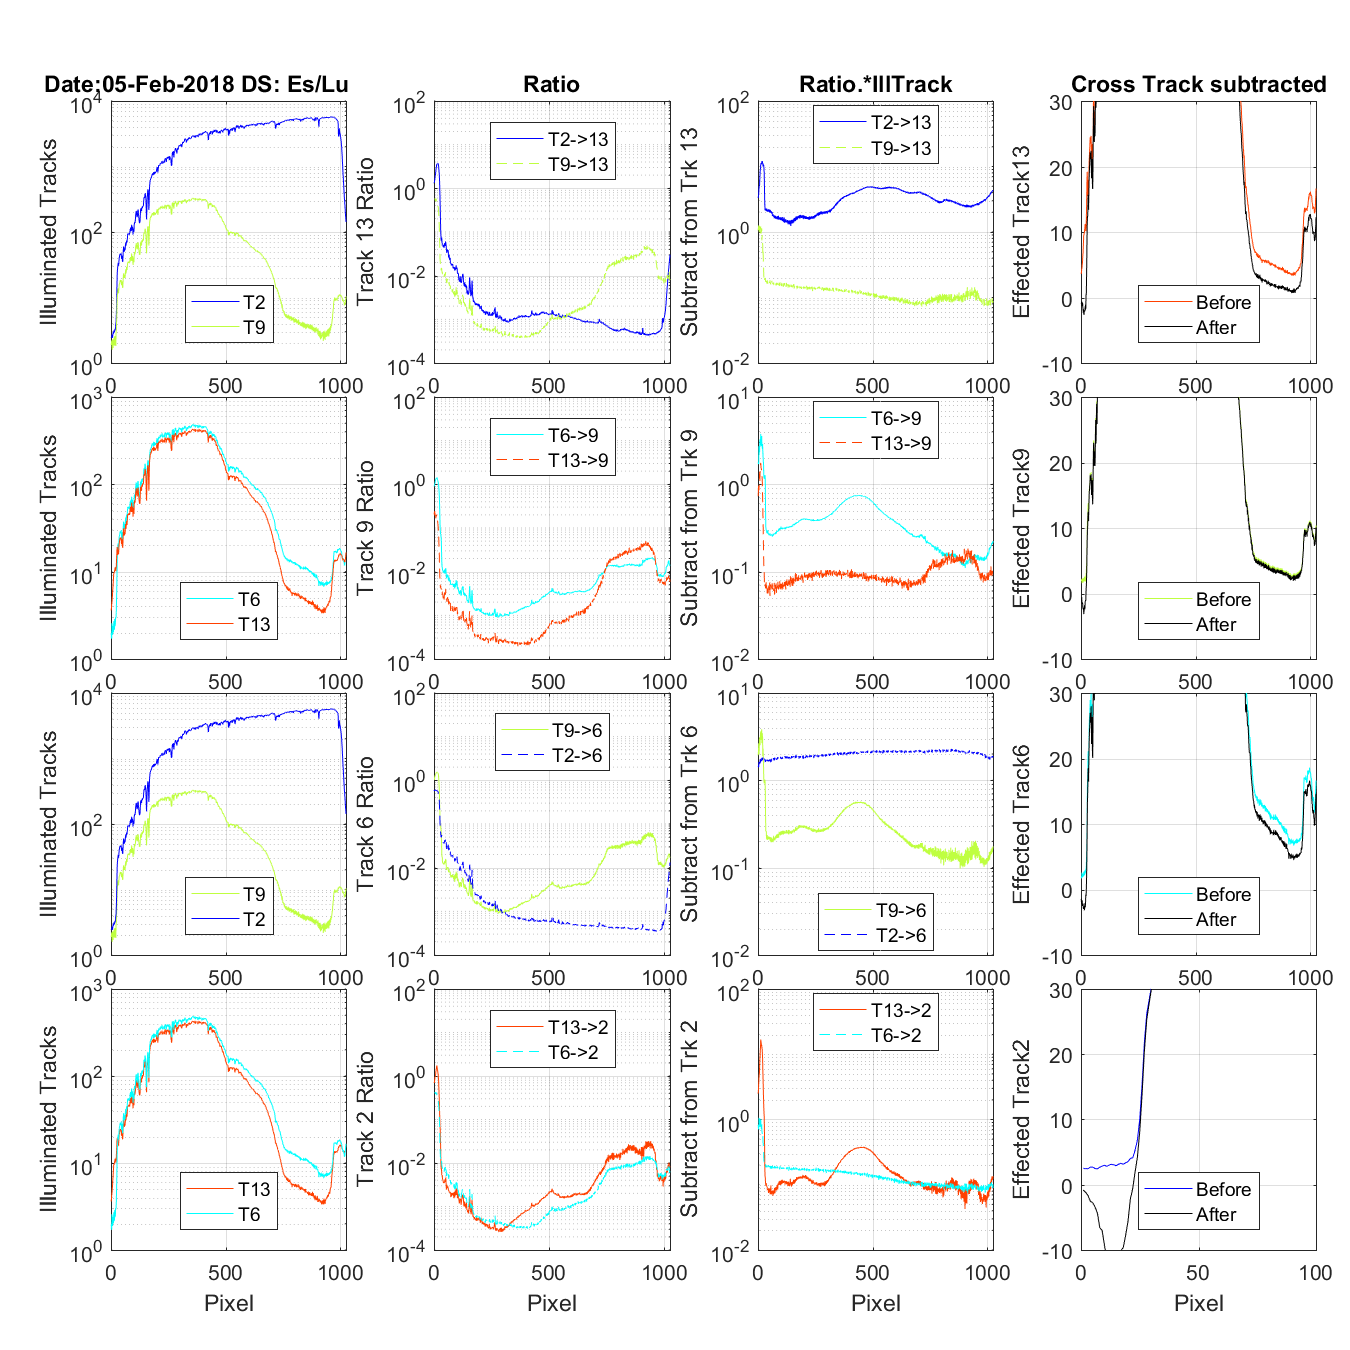
Figure 27 The title on the first row tells the date and if this is an Es/Lu data set (4 rows) or and Lu only data set (3 rows). The first column of graphs shows the tracks that are contaminating the track being corrected (Track in the last column). One of the tracks show in the first column is the mirror tracks causing UV ghosting problems the other is the closest track contamination with regular cross track light. The second column shows the UV or Cross track ratio for the contaminating tracks. The third column is the multiplication of the contaminating track and its ratio. The fourth column is the track being corrected. Before is the original data and after once the cross and UN ghosting contamination is removed. FYI: In the case of the Lu only data on column 2 you wil see the Es track shows as a ratio. But because there is no Es data it is not in any other column.
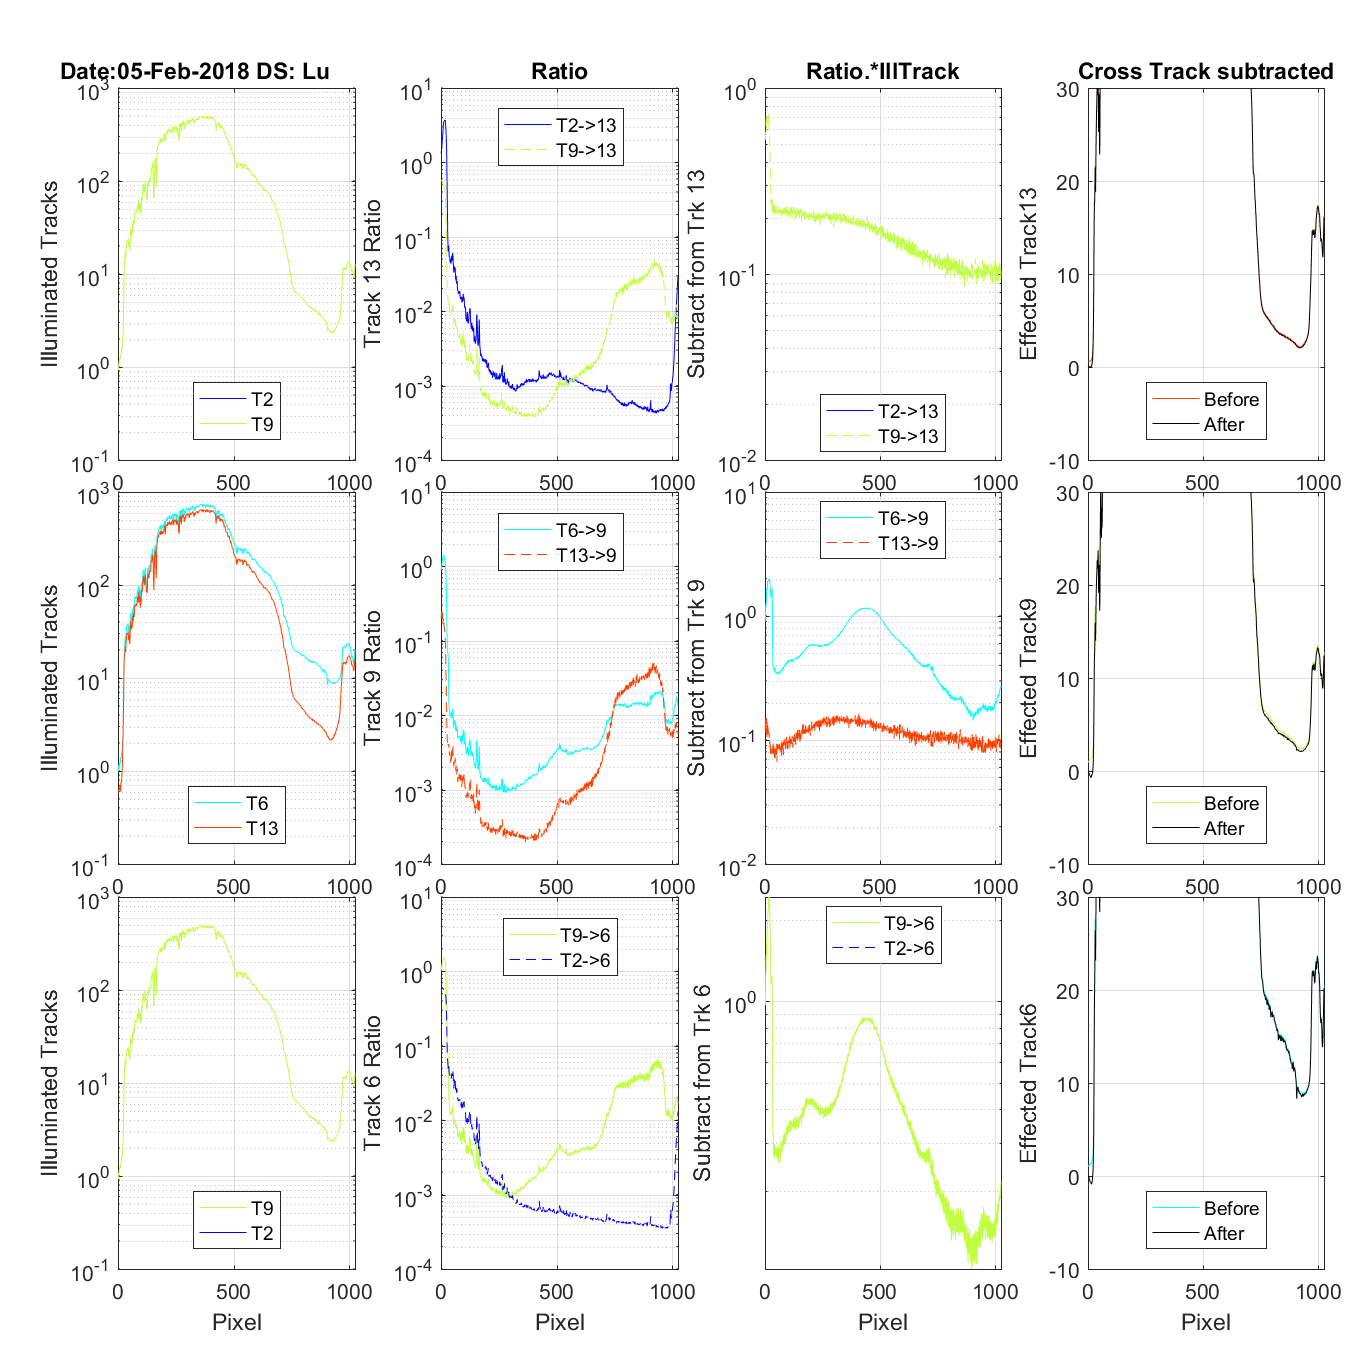
Figure 28 The title on the first row tells the date and if this is an Es/Lu data set (4 rows) or and Lu only data set (3 rows). The first column of graphs shows the tracks that are contaminating the track being corrected (Track in the last column). One of the tracks show in the first column is the mirror tracks causing UV ghosting problems the other is the closest track contamination with regular cross track light. The second column shows the UV or Cross track ratio for the contaminating tracks. The third column is the multiplication of the contaminating track and its ratio. The fourth column is the track being corrected. Before is the original data and after once the cross and UN ghosting contamination is removed. FYI: In the case of the Lu only data on column 2 you wil see the Es track shows as a ratio. But because there is no Es data it is not in any other column.
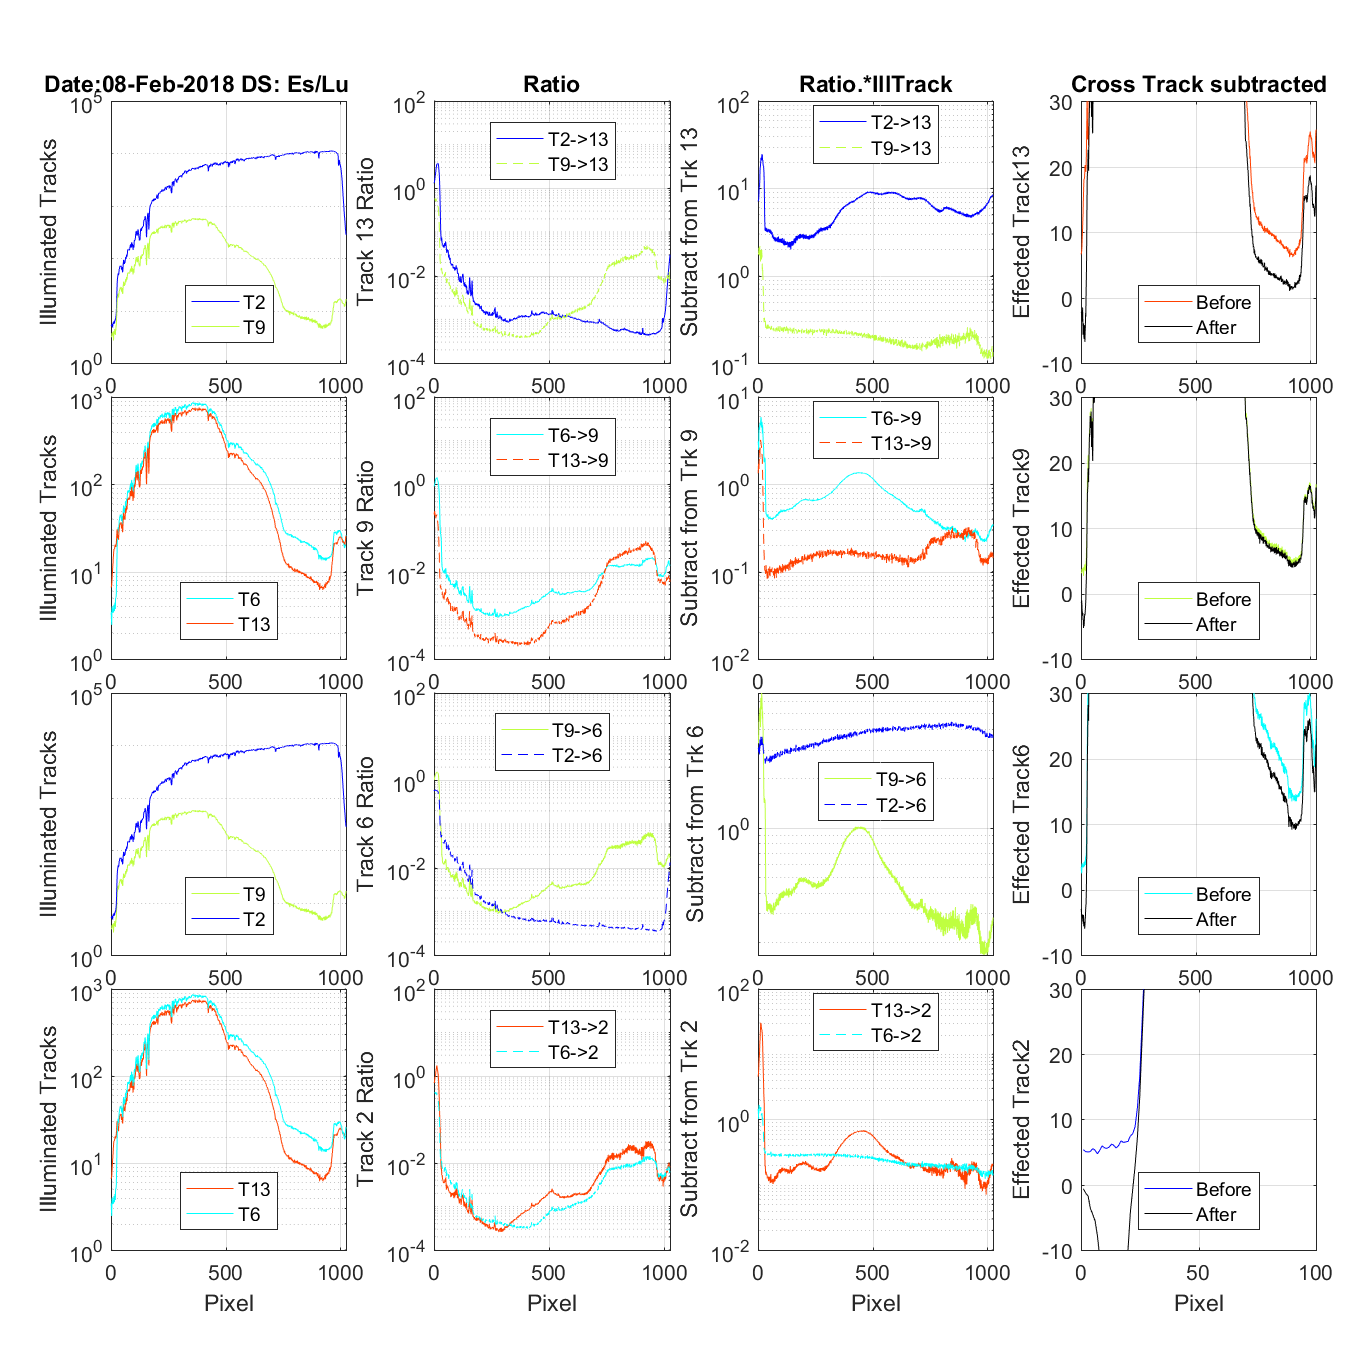
Figure 29 The title on the first row tells the date and if this is an Es/Lu data set (4 rows) or and Lu only data set (3 rows). The first column of graphs shows the tracks that are contaminating the track being corrected (Track in the last column). One of the tracks show in the first column is the mirror tracks causing UV ghosting problems the other is the closest track contamination with regular cross track light. The second column shows the UV or Cross track ratio for the contaminating tracks. The third column is the multiplication of the contaminating track and its ratio. The fourth column is the track being corrected. Before is the original data and after once the cross and UN ghosting contamination is removed. FYI: In the case of the Lu only data on column 2 you wil see the Es track shows as a ratio. But because there is no Es data it is not in any other column.
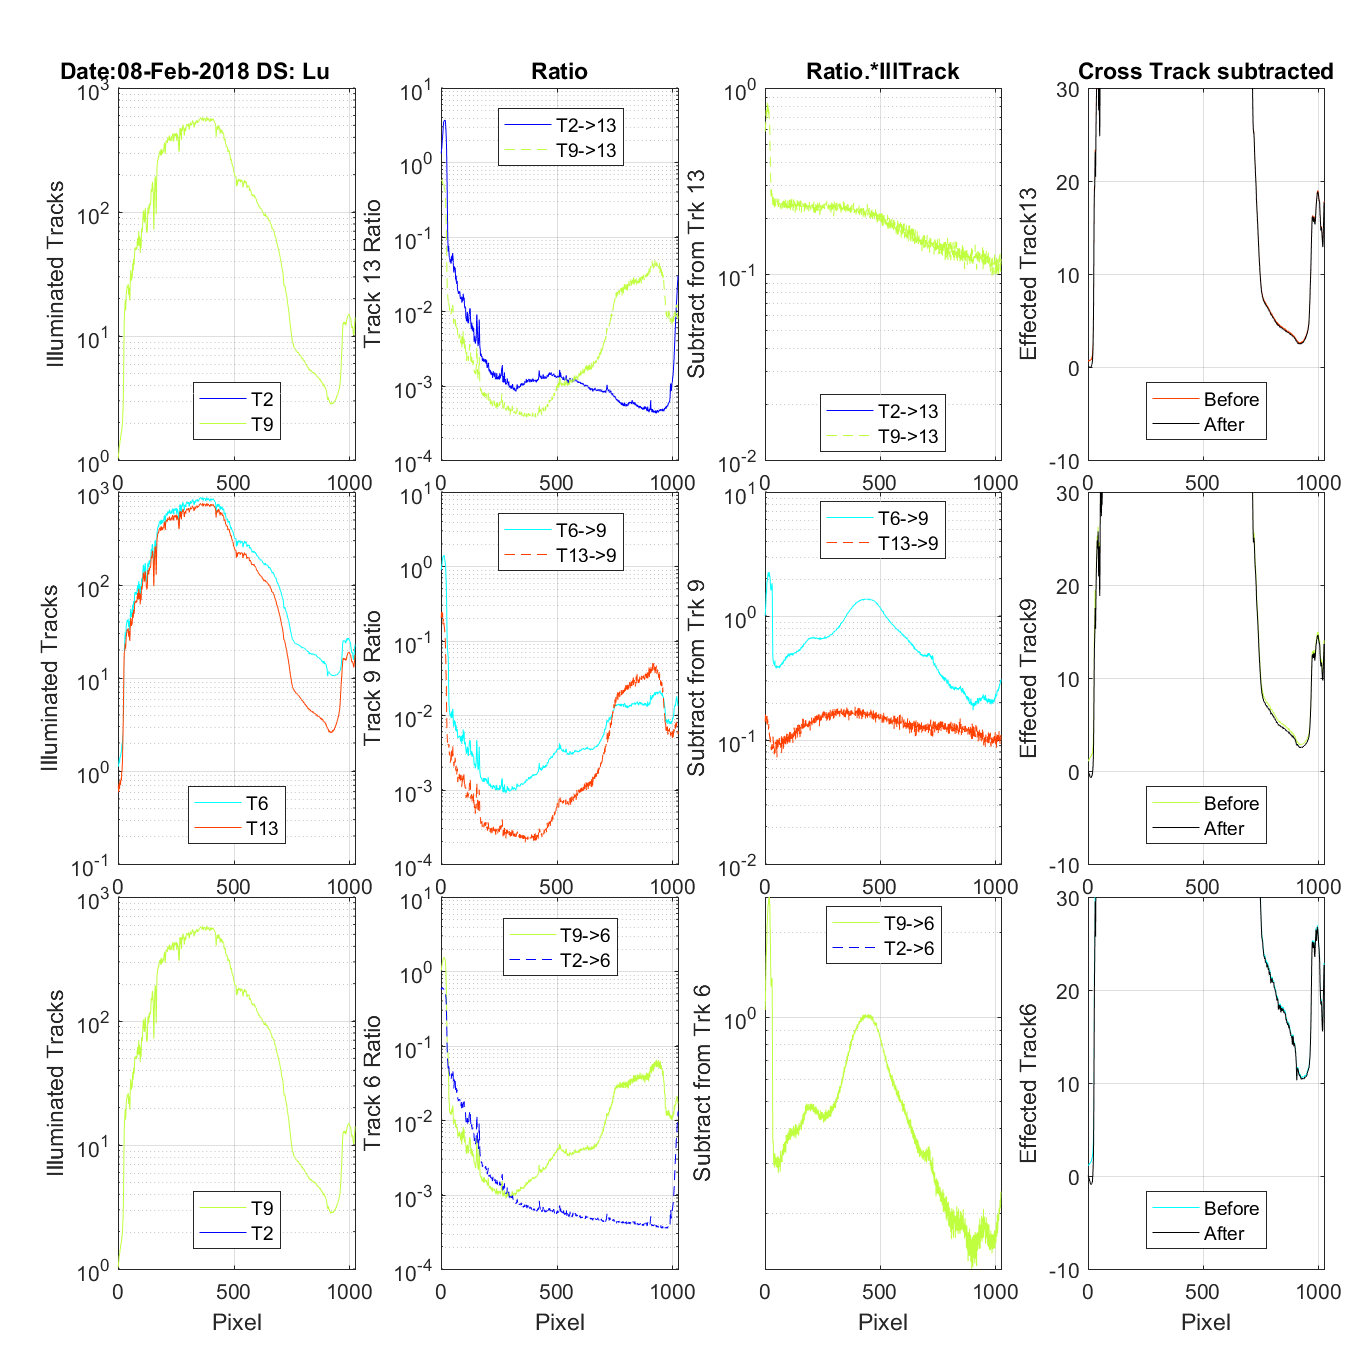
Figure 30 The title on the first row tells the date and if this is an Es/Lu data set (4 rows) or and Lu only data set (3 rows). The first column of graphs shows the tracks that are contaminating the track being corrected (Track in the last column). One of the tracks show in the first column is the mirror tracks causing UV ghosting problems the other is the closest track contamination with regular cross track light. The second column shows the UV or Cross track ratio for the contaminating tracks. The third column is the multiplication of the contaminating track and its ratio. The fourth column is the track being corrected. Before is the original data and after once the cross and UN ghosting contamination is removed. FYI: In the case of the Lu only data on column 2 you wil see the Es track shows as a ratio. But because there is no Es data it is not in any other column.
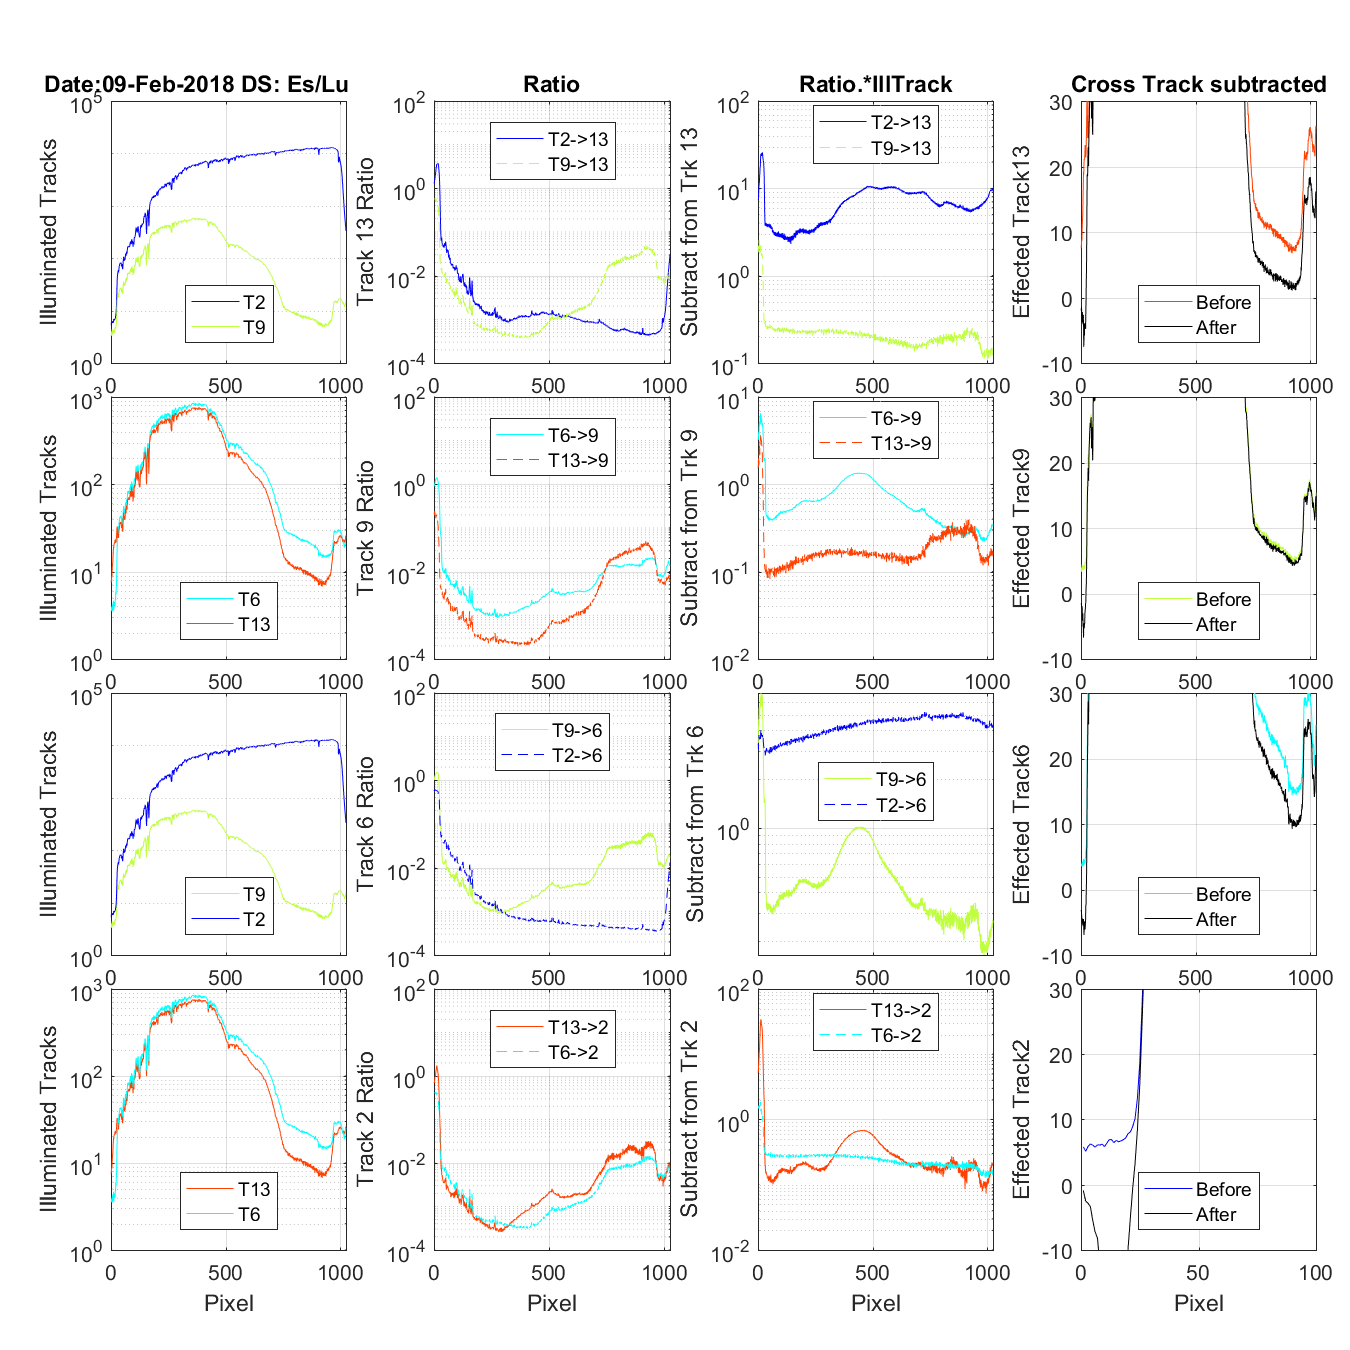
Figure 31 The title on the first row tells the date and if this is an Es/Lu data set (4 rows) or and Lu only data set (3 rows). The first column of graphs shows the tracks that are contaminating the track being corrected (Track in the last column). One of the tracks show in the first column is the mirror tracks causing UV ghosting problems the other is the closest track contamination with regular cross track light. The second column shows the UV or Cross track ratio for the contaminating tracks. The third column is the multiplication of the contaminating track and its ratio. The fourth column is the track being corrected. Before is the original data and after once the cross and UN ghosting contamination is removed. FYI: In the case of the Lu only data on column 2 you wil see the Es track shows as a ratio. But because there is no Es data it is not in any other column.

Figure 32 The title on the first row tells the date and if this is an Es/Lu data set (4 rows) or and Lu only data set (3 rows). The first column of graphs shows the tracks that are contaminating the track being corrected (Track in the last column). One of the tracks show in the first column is the mirror tracks causing UV ghosting problems the other is the closest track contamination with regular cross track light. The second column shows the UV or Cross track ratio for the contaminating tracks. The third column is the multiplication of the contaminating track and its ratio. The fourth column is the track being corrected. Before is the original data and after once the cross and UN ghosting contamination is removed. FYI: In the case of the Lu only data on column 2 you wil see the Es track shows as a ratio. But because there is no Es data it is not in any other column.
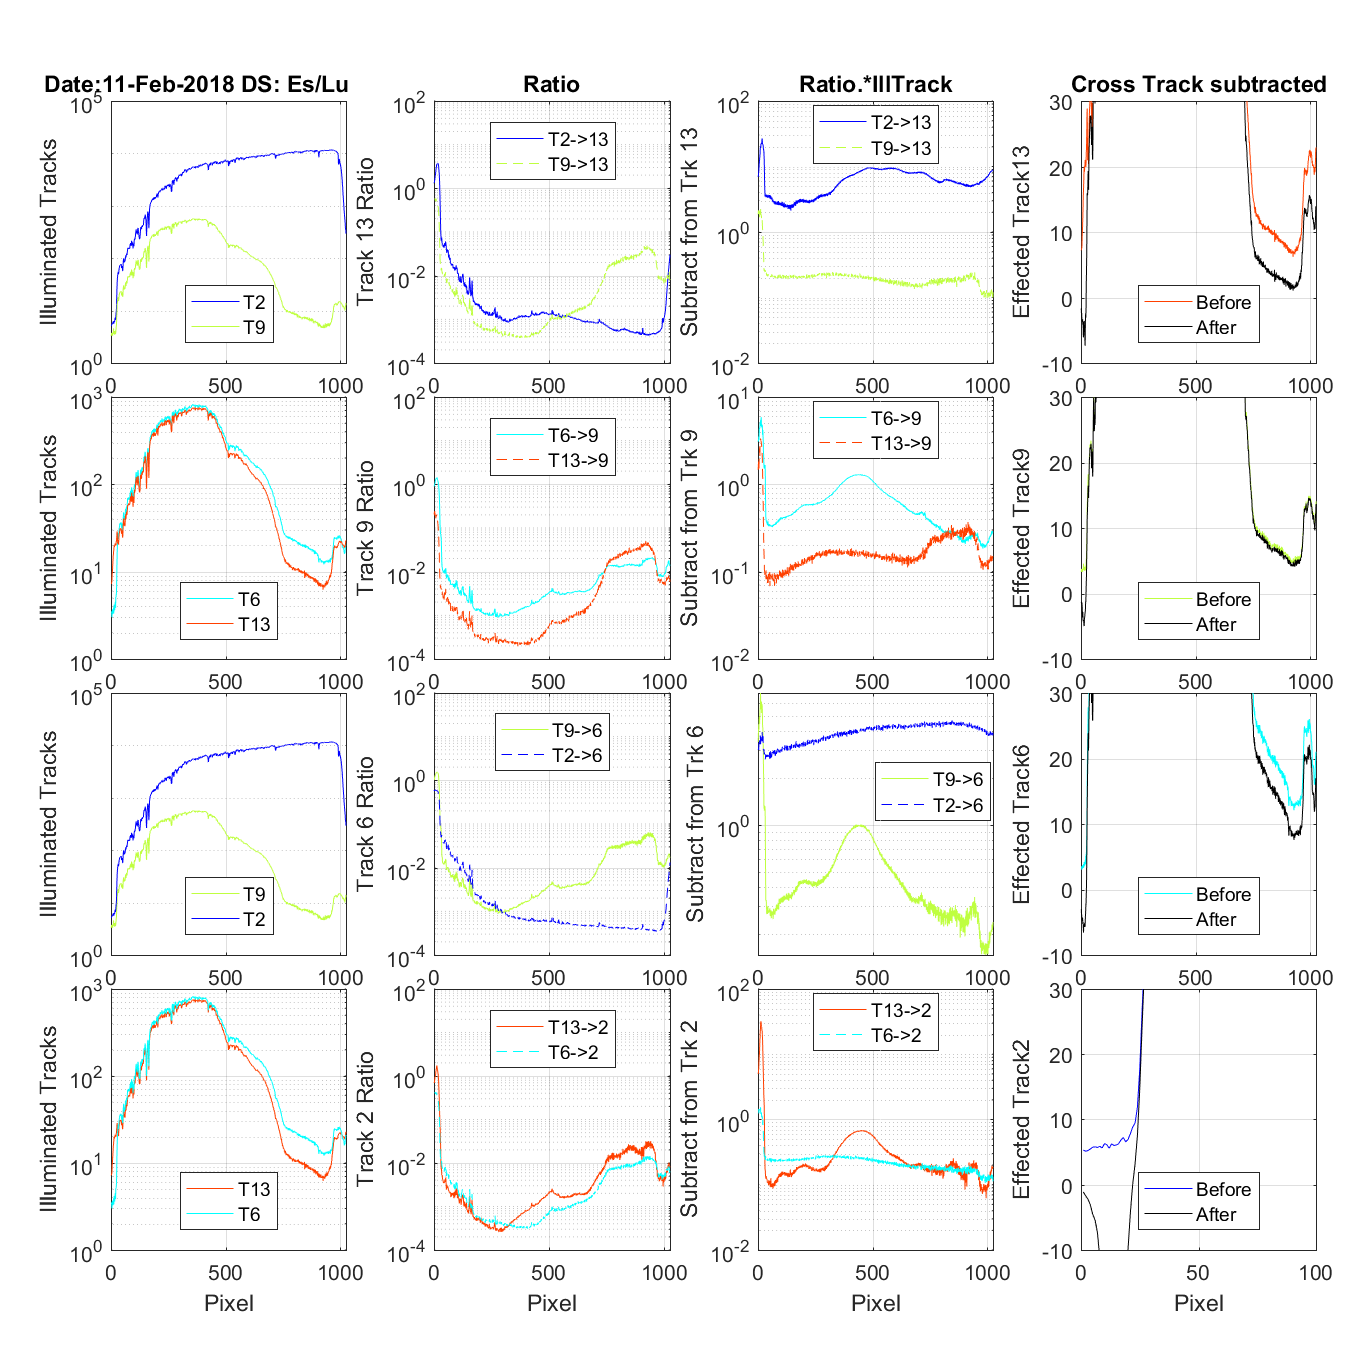
Figure 33 The title on the first row tells the date and if this is an Es/Lu data set (4 rows) or and Lu only data set (3 rows). The first column of graphs shows the tracks that are contaminating the track being corrected (Track in the last column). One of the tracks show in the first column is the mirror tracks causing UV ghosting problems the other is the closest track contamination with regular cross track light. The second column shows the UV or Cross track ratio for the contaminating tracks. The third column is the multiplication of the contaminating track and its ratio. The fourth column is the track being corrected. Before is the original data and after once the cross and UN ghosting contamination is removed. FYI: In the case of the Lu only data on column 2 you wil see the Es track shows as a ratio. But because there is no Es data it is not in any other column.

Figure 34 The title on the first row tells the date and if this is an Es/Lu data set (4 rows) or and Lu only data set (3 rows). The first column of graphs shows the tracks that are contaminating the track being corrected (Track in the last column). One of the tracks show in the first column is the mirror tracks causing UV ghosting problems the other is the closest track contamination with regular cross track light. The second column shows the UV or Cross track ratio for the contaminating tracks. The third column is the multiplication of the contaminating track and its ratio. The fourth column is the track being corrected. Before is the original data and after once the cross and UN ghosting contamination is removed. FYI: In the case of the Lu only data on column 2 you wil see the Es track shows as a ratio. But because there is no Es data it is not in any other column.
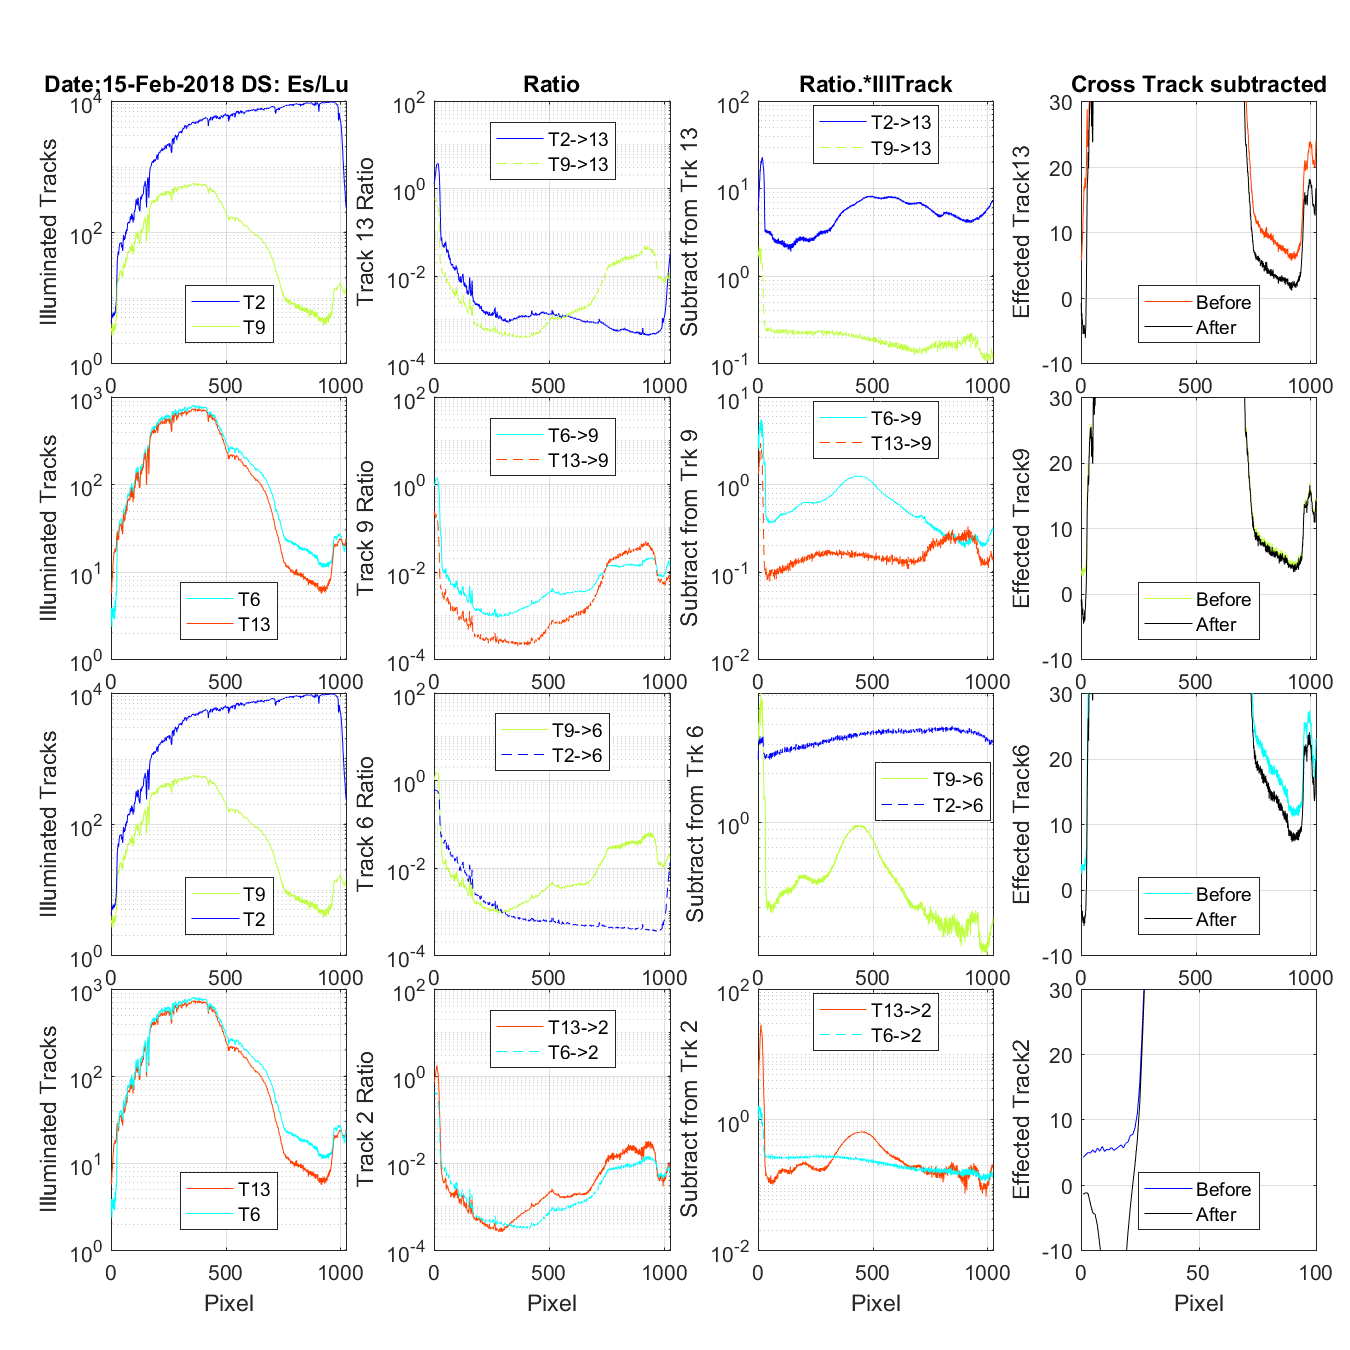
Figure 35 The title on the first row tells the date and if this is an Es/Lu data set (4 rows) or and Lu only data set (3 rows). The first column of graphs shows the tracks that are contaminating the track being corrected (Track in the last column). One of the tracks show in the first column is the mirror tracks causing UV ghosting problems the other is the closest track contamination with regular cross track light. The second column shows the UV or Cross track ratio for the contaminating tracks. The third column is the multiplication of the contaminating track and its ratio. The fourth column is the track being corrected. Before is the original data and after once the cross and UN ghosting contamination is removed. FYI: In the case of the Lu only data on column 2 you wil see the Es track shows as a ratio. But because there is no Es data it is not in any other column.
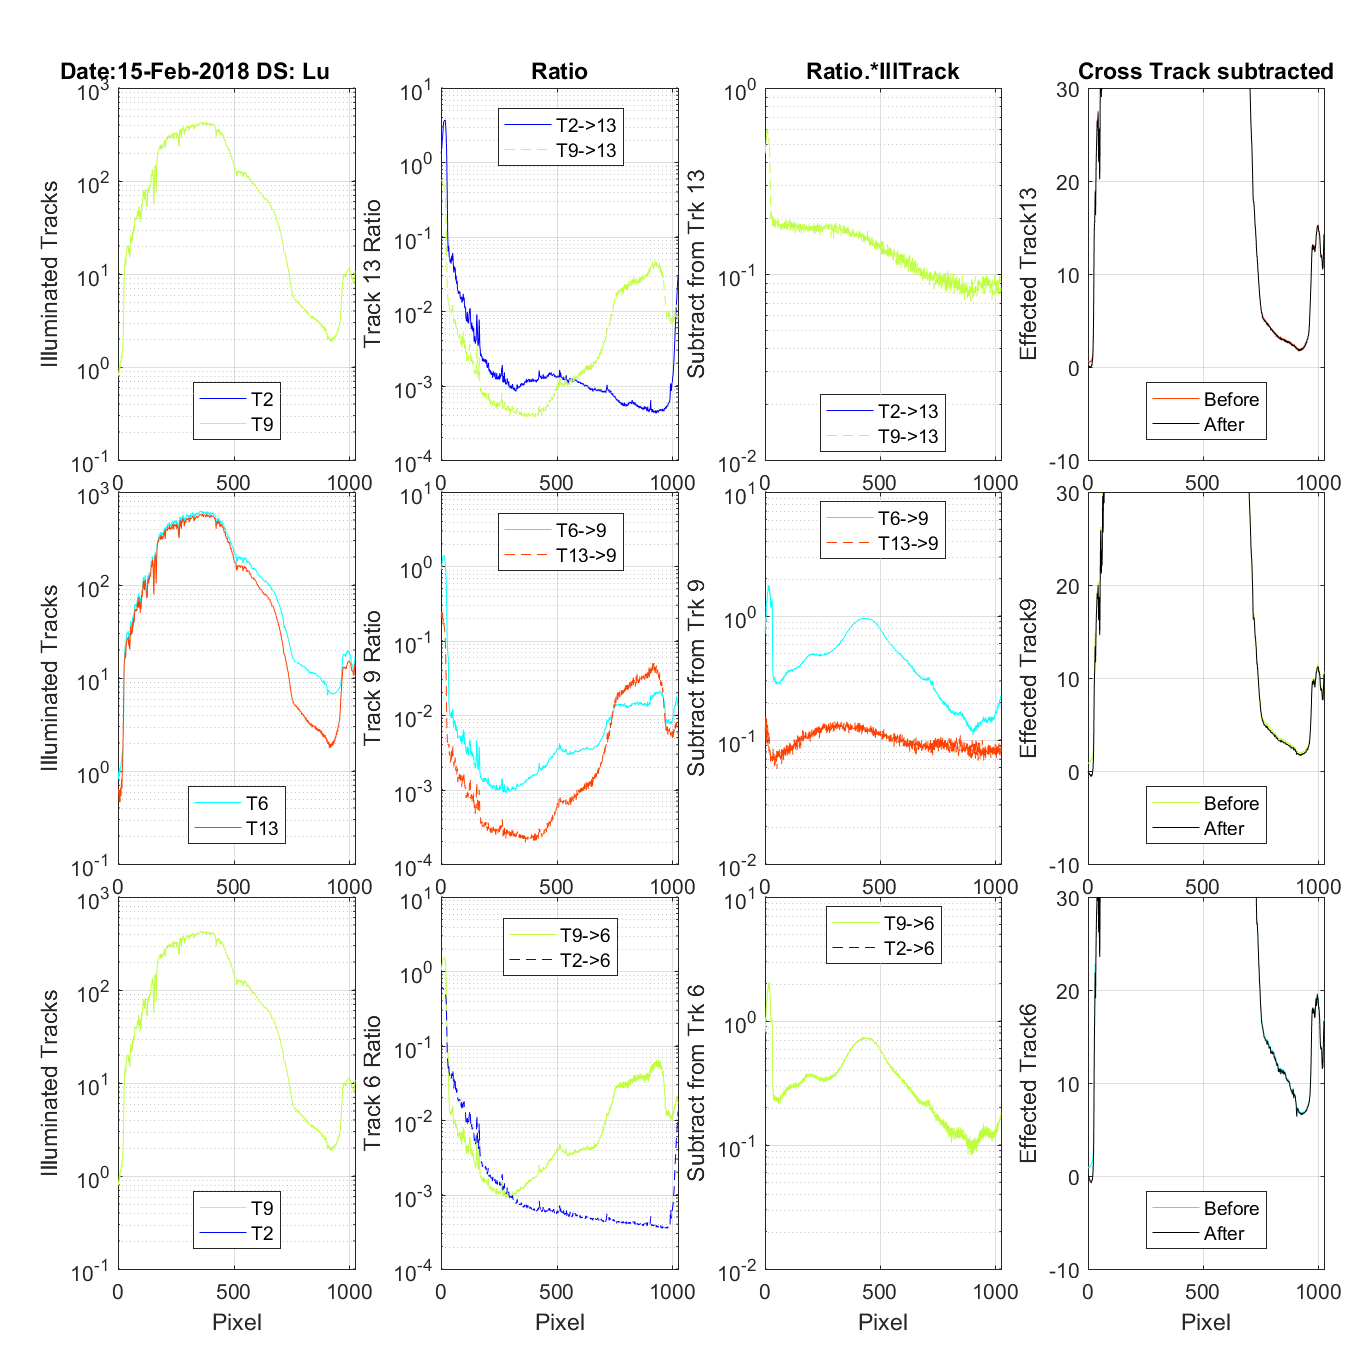
Figure 36 The title on the first row tells the date and if this is an Es/Lu data set (4 rows) or and Lu only data set (3 rows). The first column of graphs shows the tracks that are contaminating the track being corrected (Track in the last column). One of the tracks show in the first column is the mirror tracks causing UV ghosting problems the other is the closest track contamination with regular cross track light. The second column shows the UV or Cross track ratio for the contaminating tracks. The third column is the multiplication of the contaminating track and its ratio. The fourth column is the track being corrected. Before is the original data and after once the cross and UN ghosting contamination is removed. FYI: In the case of the Lu only data on column 2 you wil see the Es track shows as a ratio. But because there is no Es data it is not in any other column.
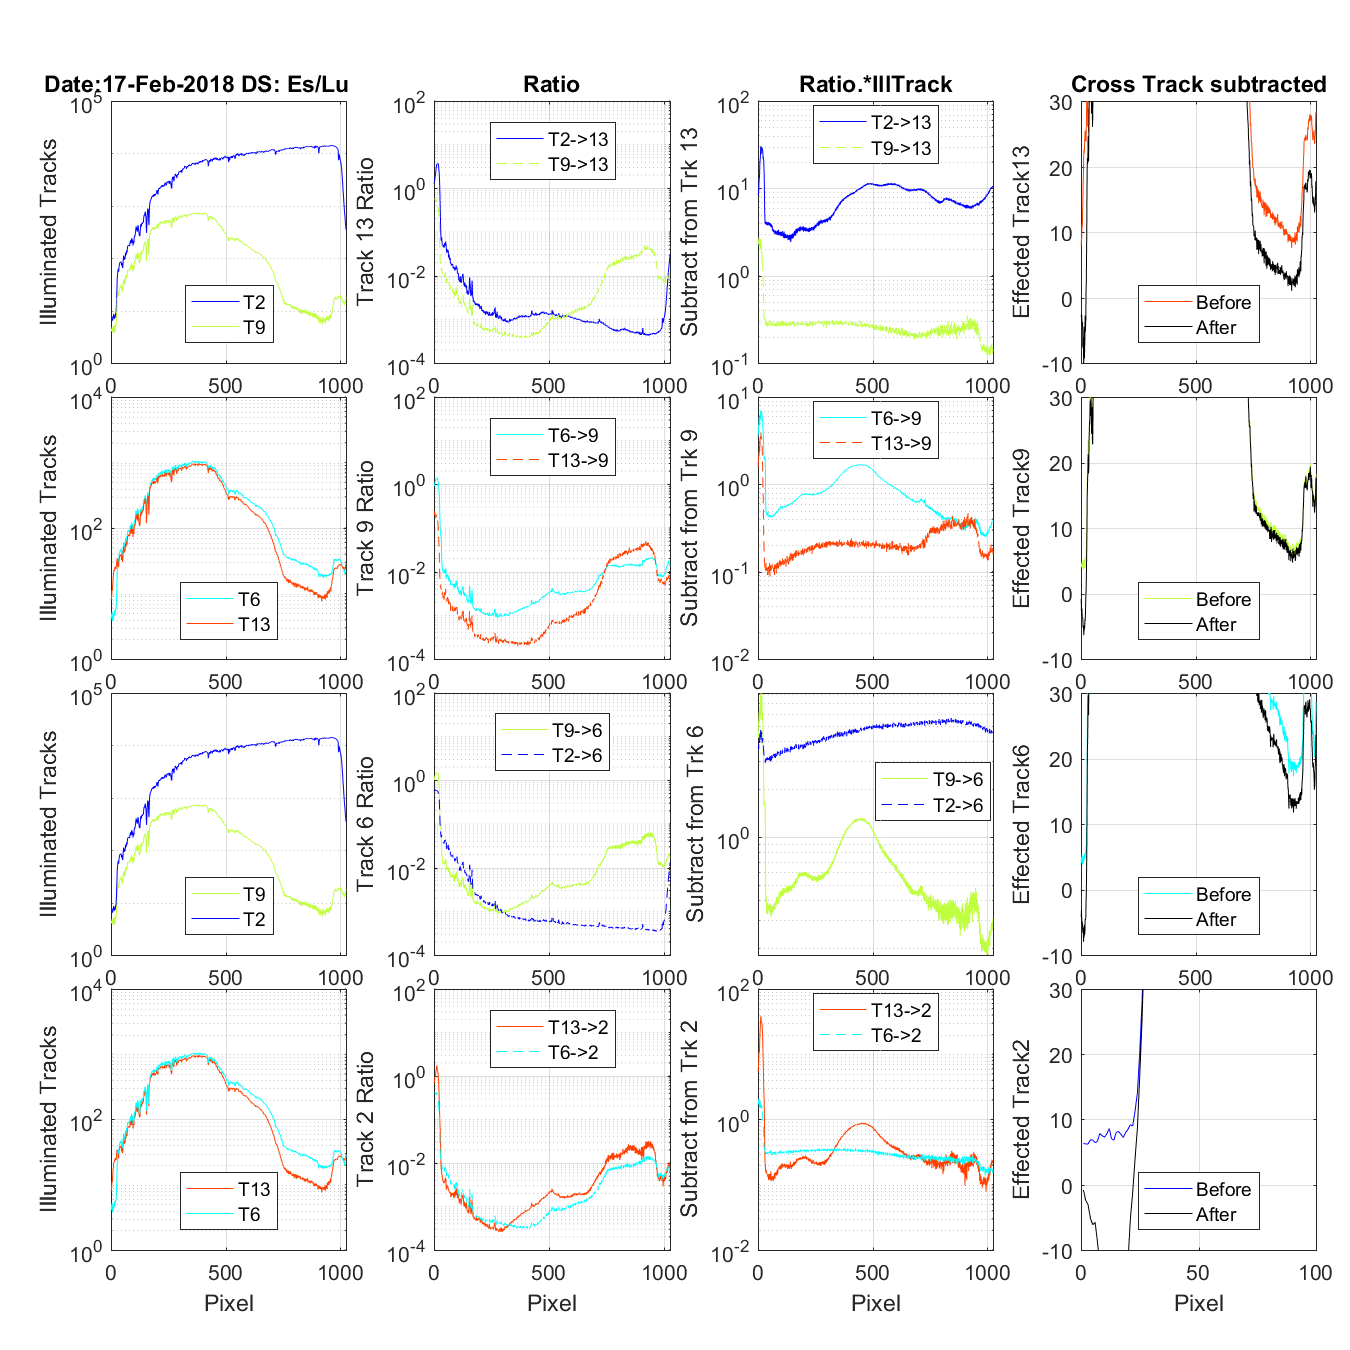
Figure 37 The title on the first row tells the date and if this is an Es/Lu data set (4 rows) or and Lu only data set (3 rows). The first column of graphs shows the tracks that are contaminating the track being corrected (Track in the last column). One of the tracks show in the first column is the mirror tracks causing UV ghosting problems the other is the closest track contamination with regular cross track light. The second column shows the UV or Cross track ratio for the contaminating tracks. The third column is the multiplication of the contaminating track and its ratio. The fourth column is the track being corrected. Before is the original data and after once the cross and UN ghosting contamination is removed. FYI: In the case of the Lu only data on column 2 you wil see the Es track shows as a ratio. But because there is no Es data it is not in any other column.
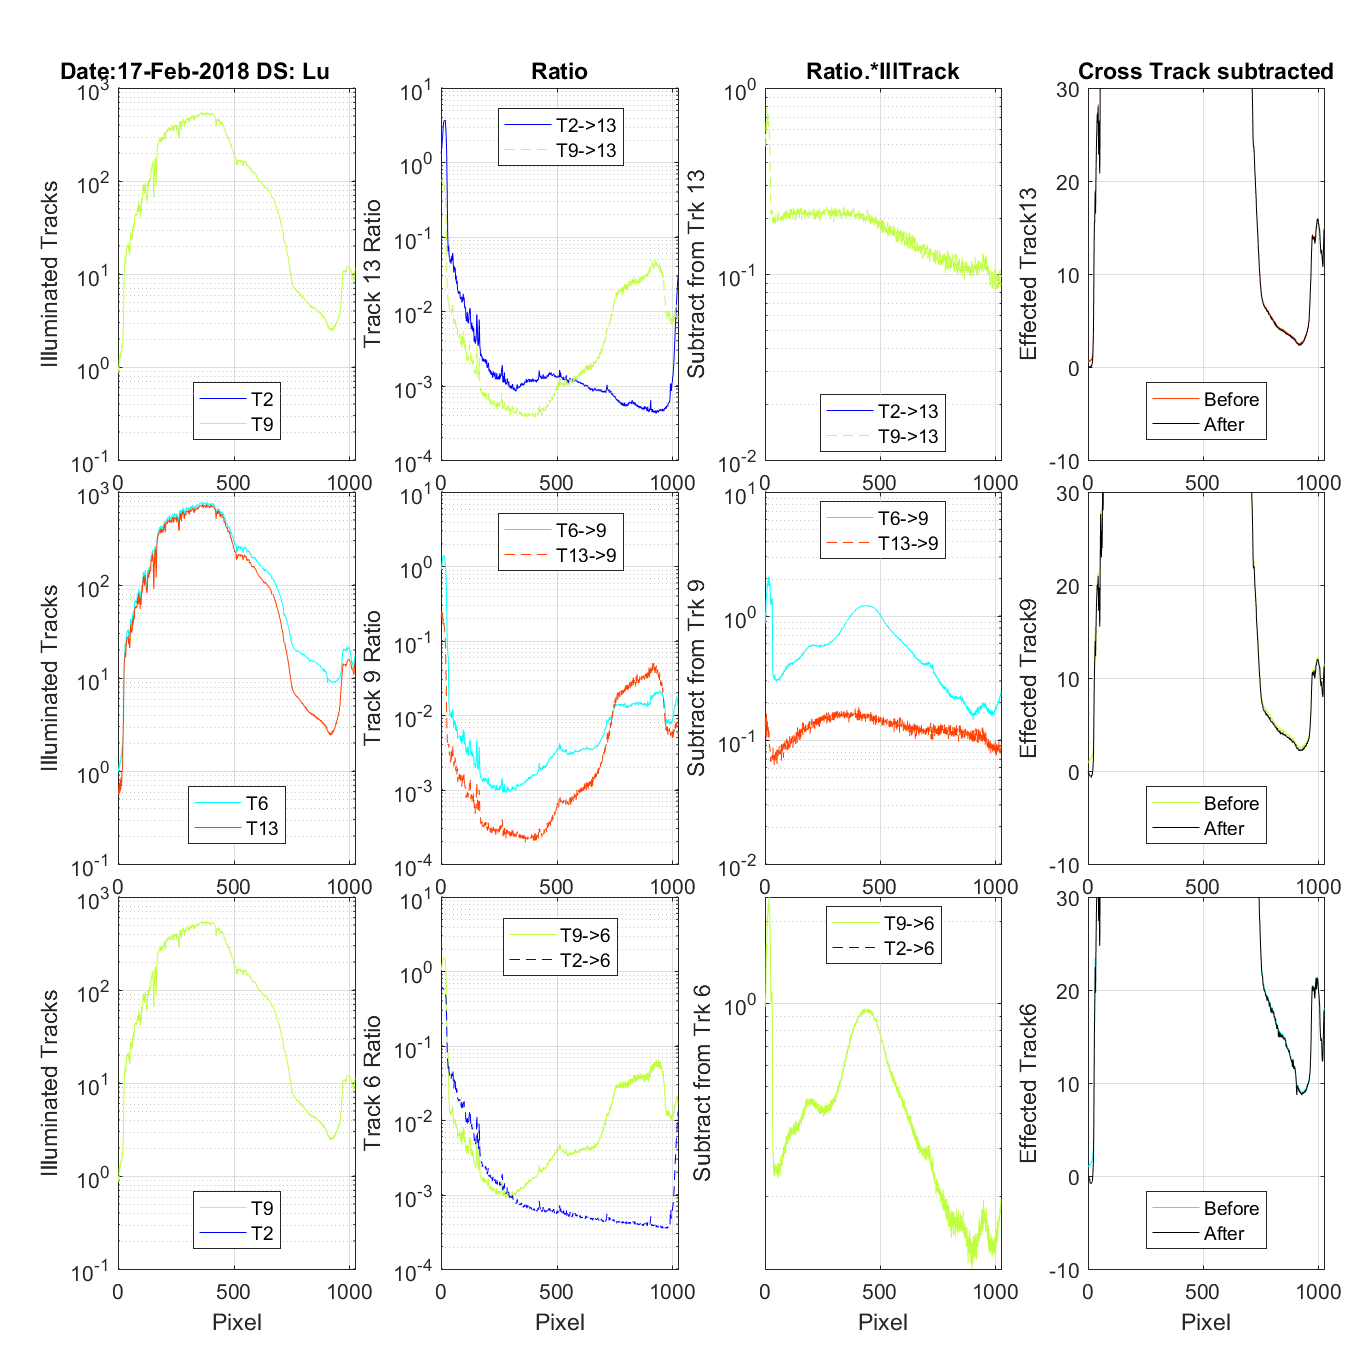
Figure 38 The title on the first row tells the date and if this is an Es/Lu data set (4 rows) or and Lu only data set (3 rows). The first column of graphs shows the tracks that are contaminating the track being corrected (Track in the last column). One of the tracks show in the first column is the mirror tracks causing UV ghosting problems the other is the closest track contamination with regular cross track light. The second column shows the UV or Cross track ratio for the contaminating tracks. The third column is the multiplication of the contaminating track and its ratio. The fourth column is the track being corrected. Before is the original data and after once the cross and UN ghosting contamination is removed. FYI: In the case of the Lu only data on column 2 you wil see the Es track shows as a ratio. But because there is no Es data it is not in any other column.
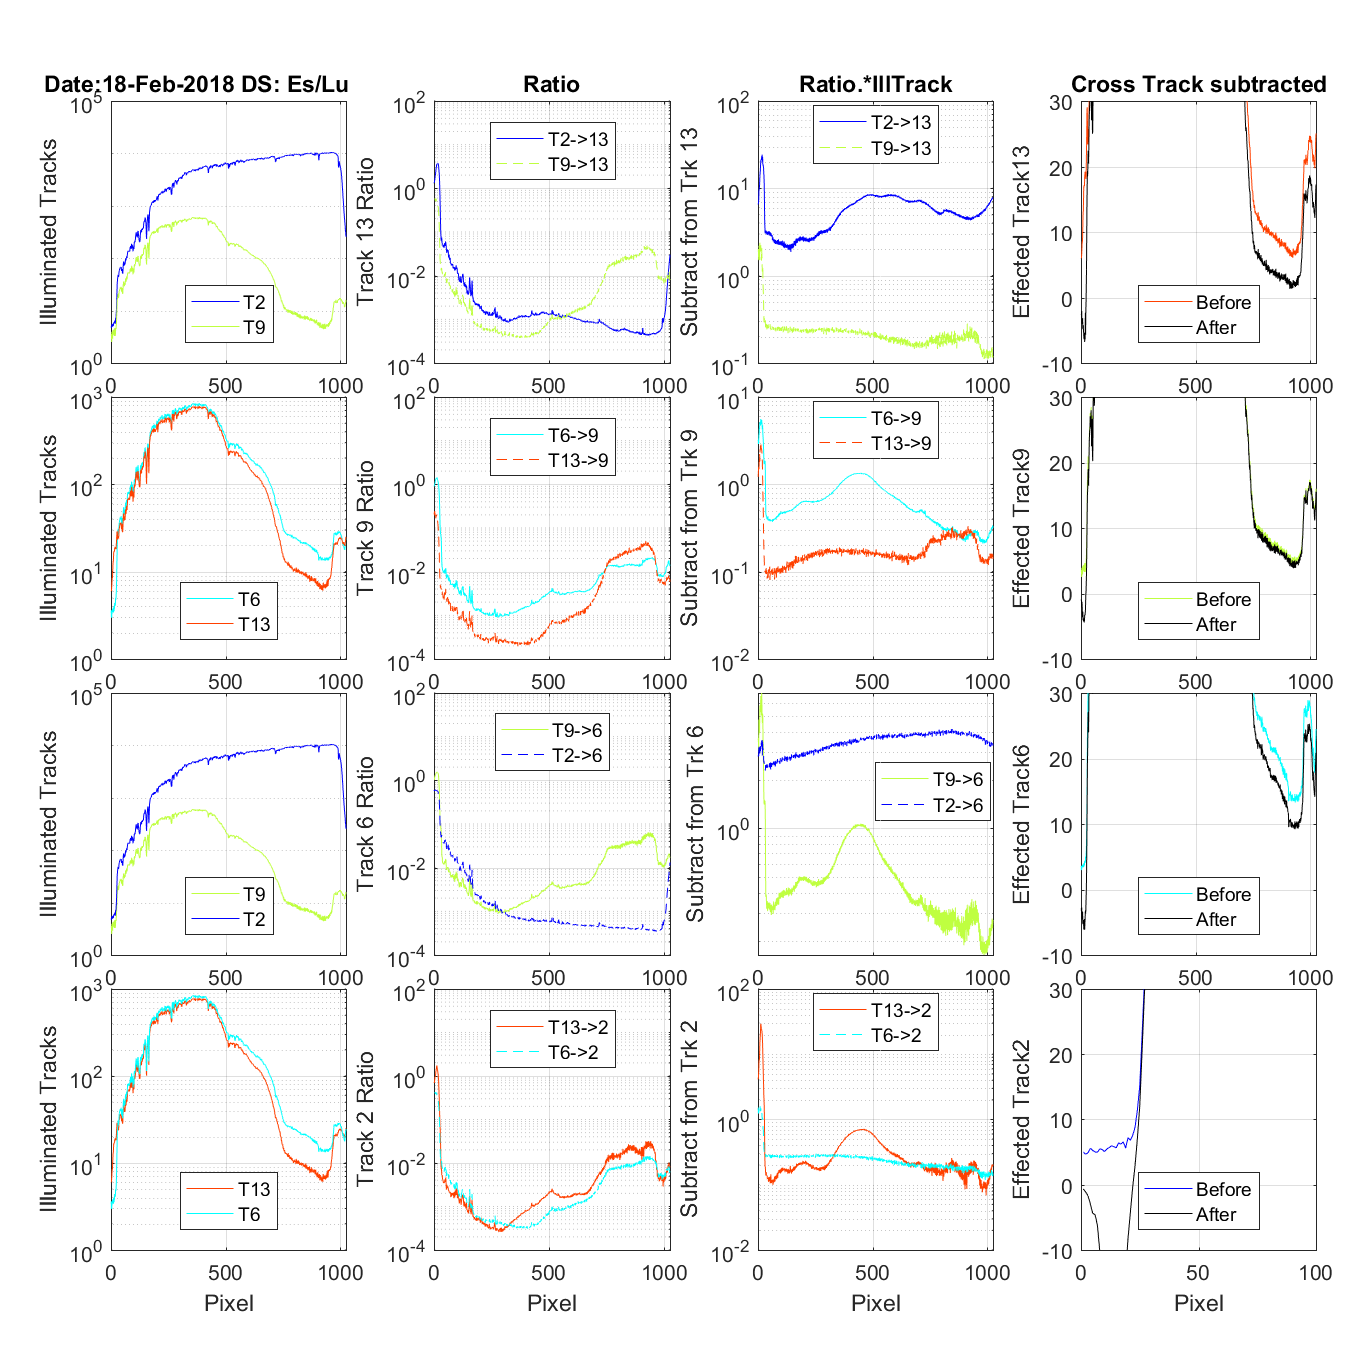
Figure 39 The title on the first row tells the date and if this is an Es/Lu data set (4 rows) or and Lu only data set (3 rows). The first column of graphs shows the tracks that are contaminating the track being corrected (Track in the last column). One of the tracks show in the first column is the mirror tracks causing UV ghosting problems the other is the closest track contamination with regular cross track light. The second column shows the UV or Cross track ratio for the contaminating tracks. The third column is the multiplication of the contaminating track and its ratio. The fourth column is the track being corrected. Before is the original data and after once the cross and UN ghosting contamination is removed. FYI: In the case of the Lu only data on column 2 you wil see the Es track shows as a ratio. But because there is no Es data it is not in any other column.
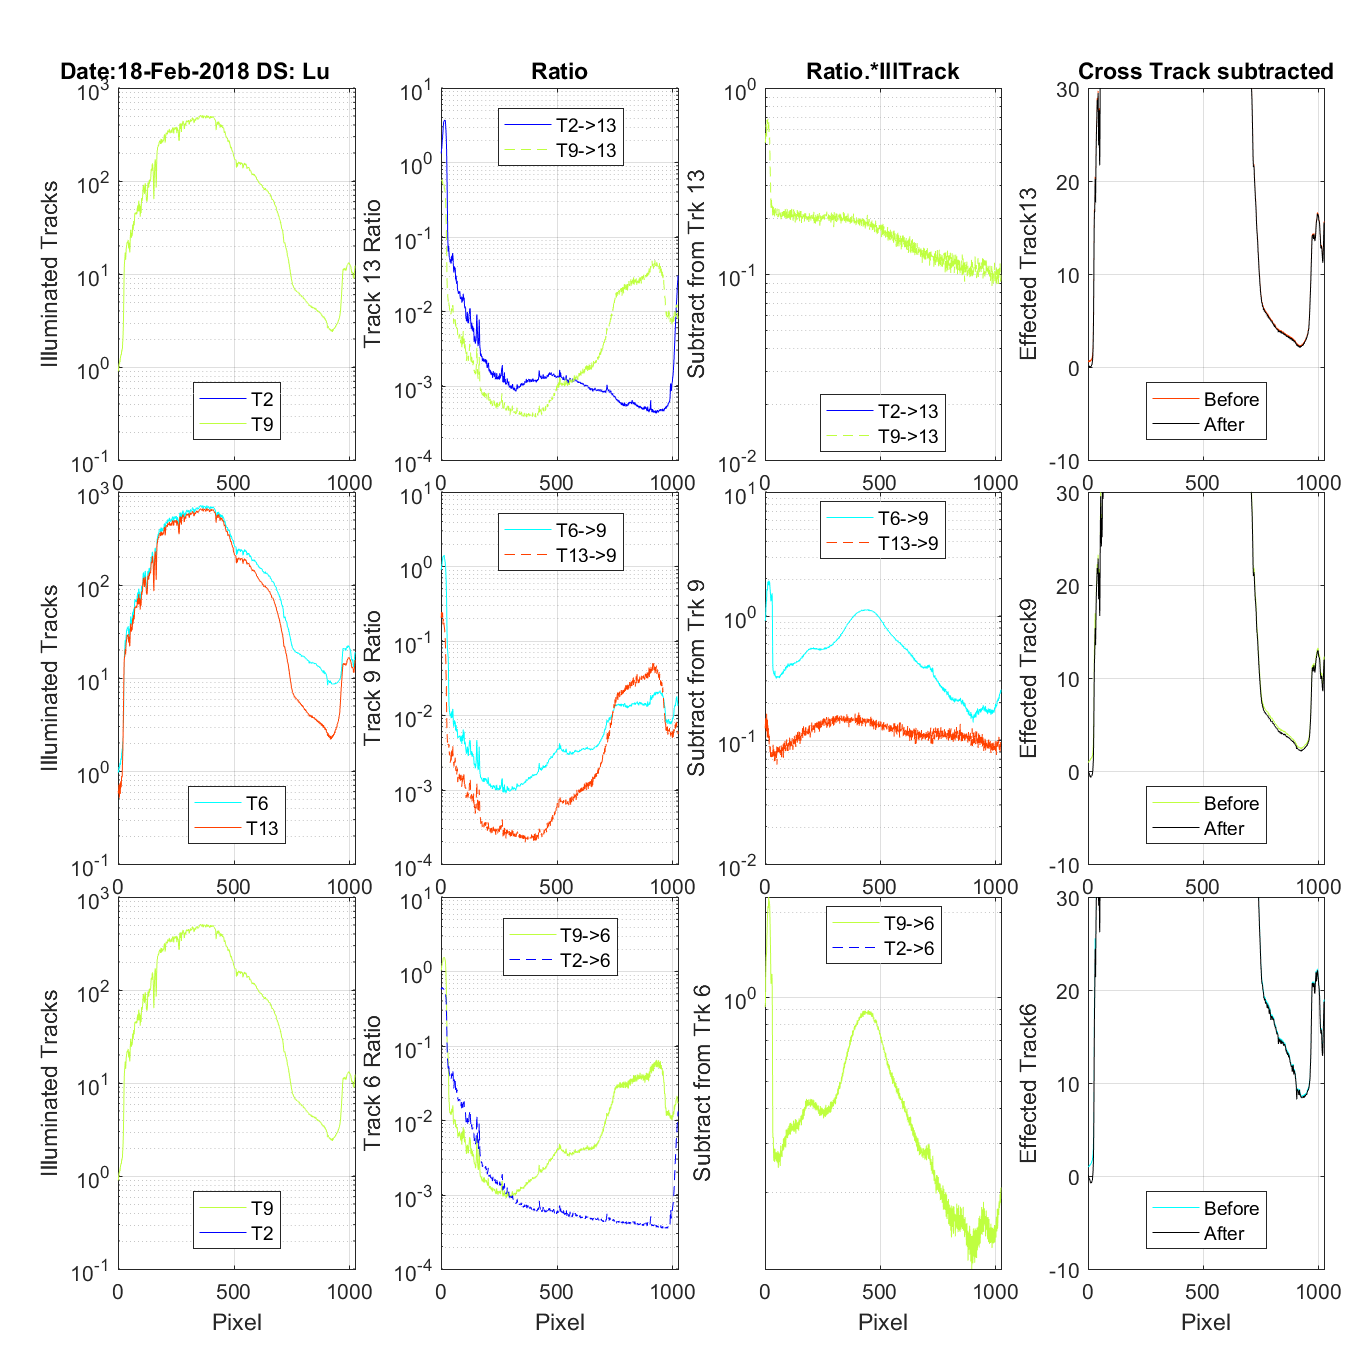
Figure 40 The title on the first row tells the date and if this is an Es/Lu data set (4 rows) or and Lu only data set (3 rows). The first column of graphs shows the tracks that are contaminating the track being corrected (Track in the last column). One of the tracks show in the first column is the mirror tracks causing UV ghosting problems the other is the closest track contamination with regular cross track light. The second column shows the UV or Cross track ratio for the contaminating tracks. The third column is the multiplication of the contaminating track and its ratio. The fourth column is the track being corrected. Before is the original data and after once the cross and UN ghosting contamination is removed. FYI: In the case of the Lu only data on column 2 you wil see the Es track shows as a ratio. But because there is no Es data it is not in any other column.
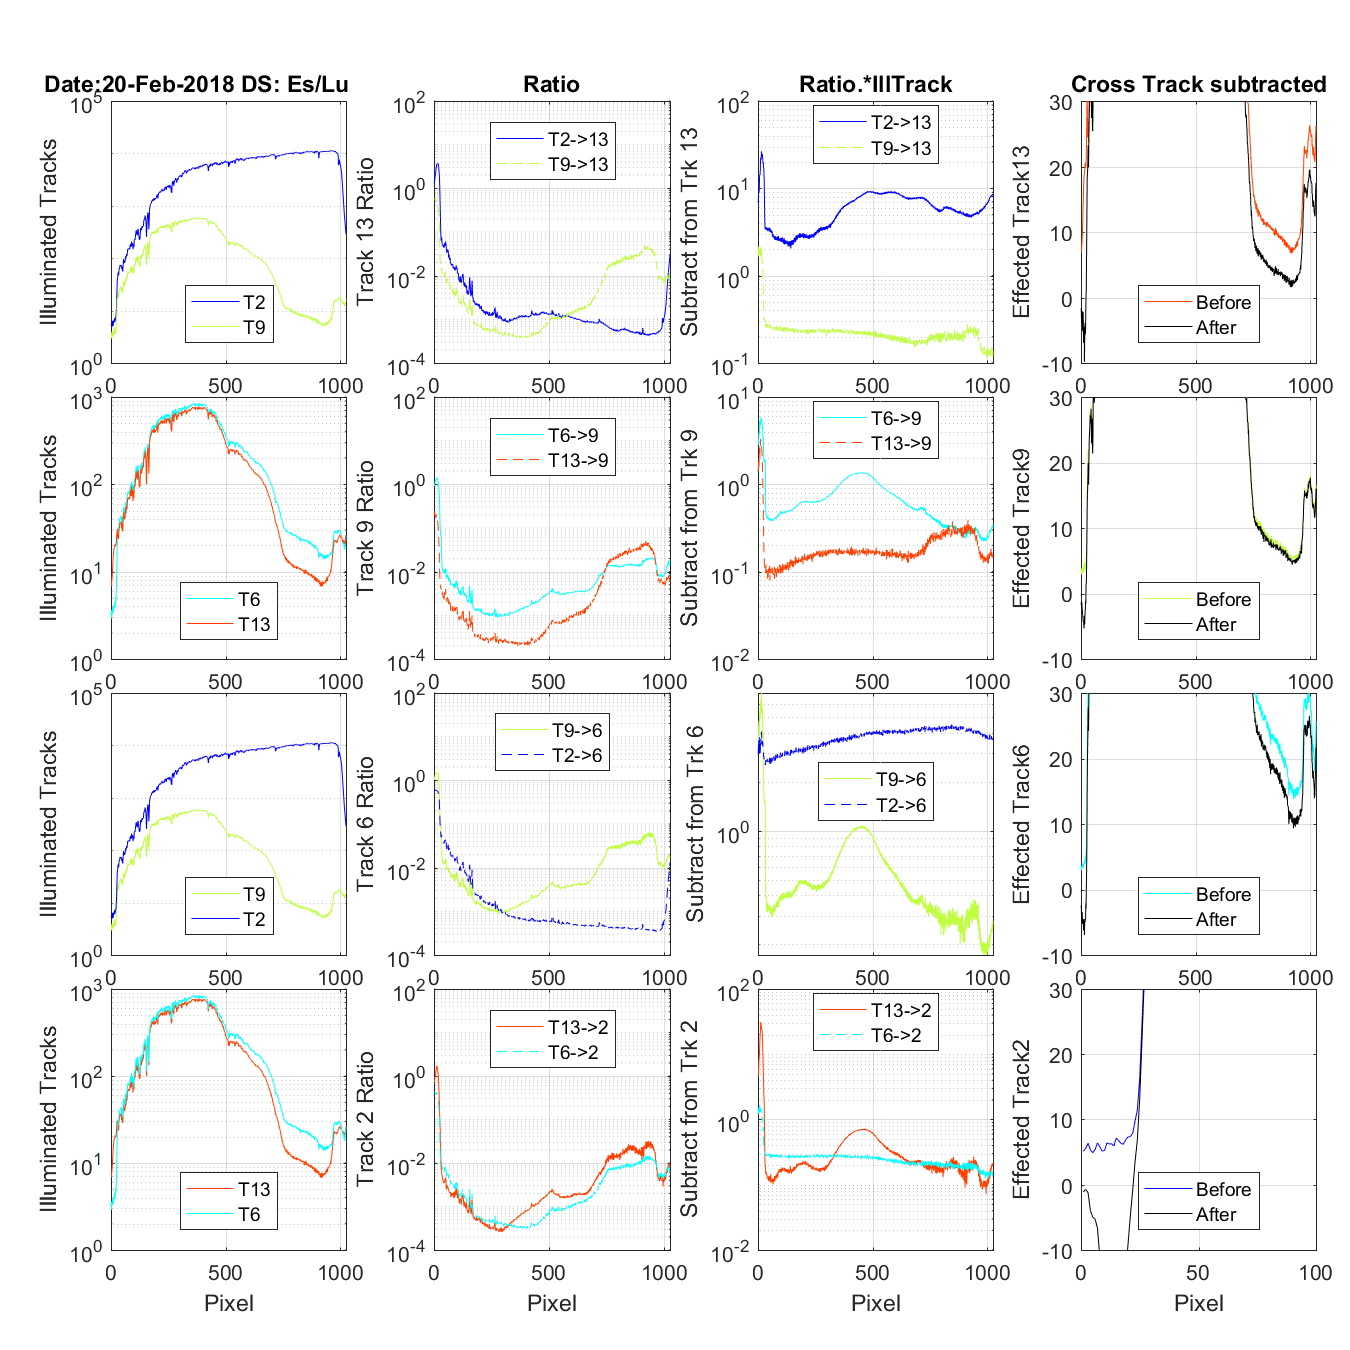
Figure 41 The title on the first row tells the date and if this is an Es/Lu data set (4 rows) or and Lu only data set (3 rows). The first column of graphs shows the tracks that are contaminating the track being corrected (Track in the last column). One of the tracks show in the first column is the mirror tracks causing UV ghosting problems the other is the closest track contamination with regular cross track light. The second column shows the UV or Cross track ratio for the contaminating tracks. The third column is the multiplication of the contaminating track and its ratio. The fourth column is the track being corrected. Before is the original data and after once the cross and UN ghosting contamination is removed. FYI: In the case of the Lu only data on column 2 you wil see the Es track shows as a ratio. But because there is no Es data it is not in any other column.
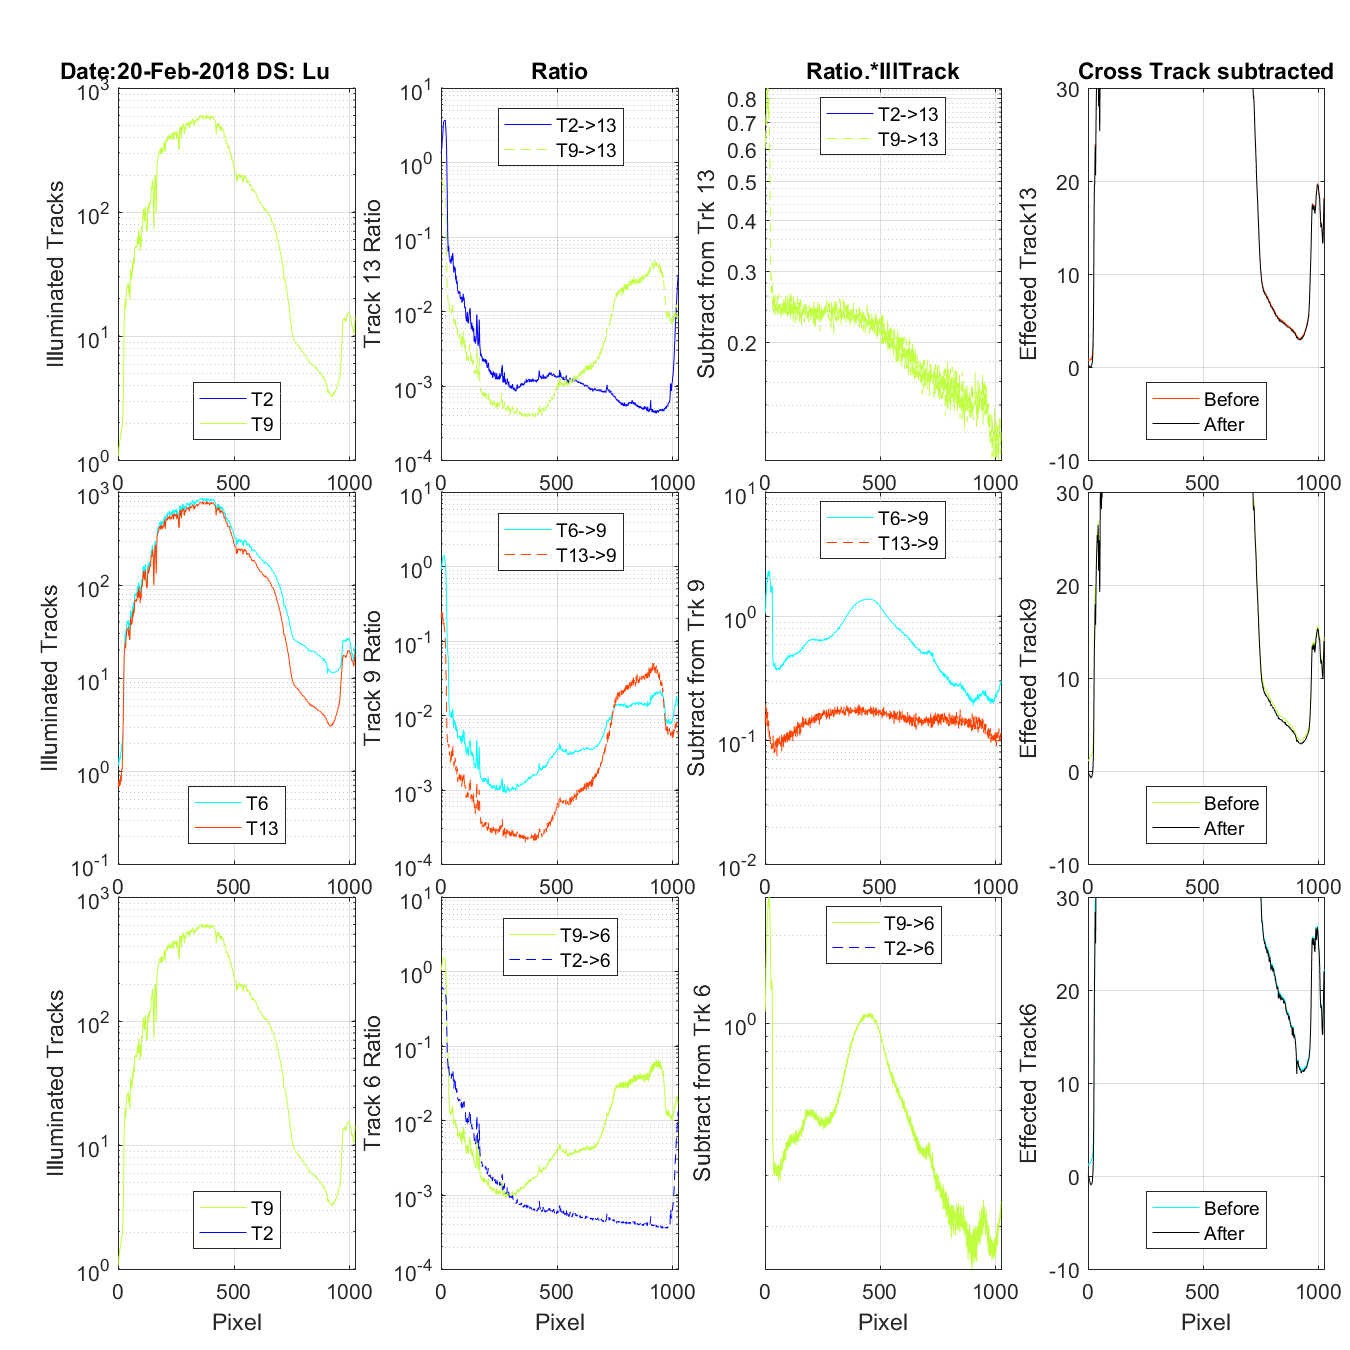
Figure 42 The title on the first row tells the date and if this is an Es/Lu data set (4 rows) or and Lu only data set (3 rows). The first column of graphs shows the tracks that are contaminating the track being corrected (Track in the last column). One of the tracks show in the first column is the mirror tracks causing UV ghosting problems the other is the closest track contamination with regular cross track light. The second column shows the UV or Cross track ratio for the contaminating tracks. The third column is the multiplication of the contaminating track and its ratio. The fourth column is the track being corrected. Before is the original data and after once the cross and UN ghosting contamination is removed. FYI: In the case of the Lu only data on column 2 you wil see the Es track shows as a ratio. But because there is no Es data it is not in any other column.
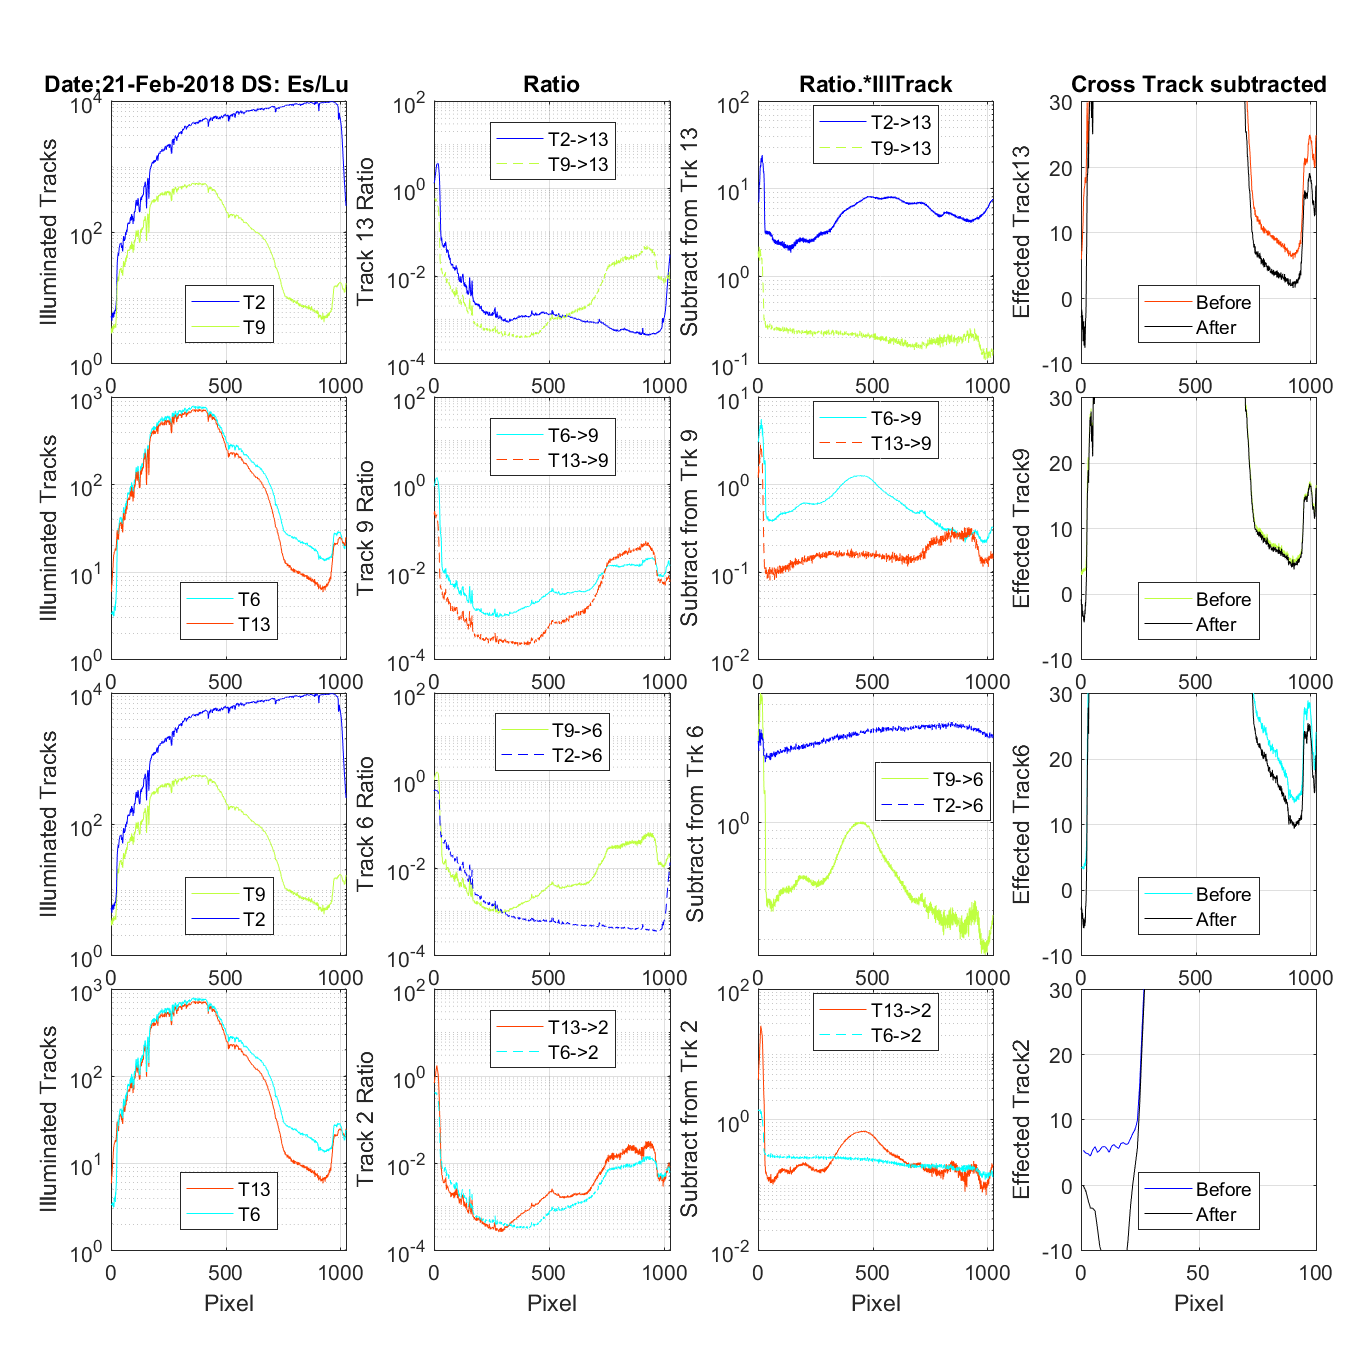
Figure 43 The title on the first row tells the date and if this is an Es/Lu data set (4 rows) or and Lu only data set (3 rows). The first column of graphs shows the tracks that are contaminating the track being corrected (Track in the last column). One of the tracks show in the first column is the mirror tracks causing UV ghosting problems the other is the closest track contamination with regular cross track light. The second column shows the UV or Cross track ratio for the contaminating tracks. The third column is the multiplication of the contaminating track and its ratio. The fourth column is the track being corrected. Before is the original data and after once the cross and UN ghosting contamination is removed. FYI: In the case of the Lu only data on column 2 you wil see the Es track shows as a ratio. But because there is no Es data it is not in any other column.
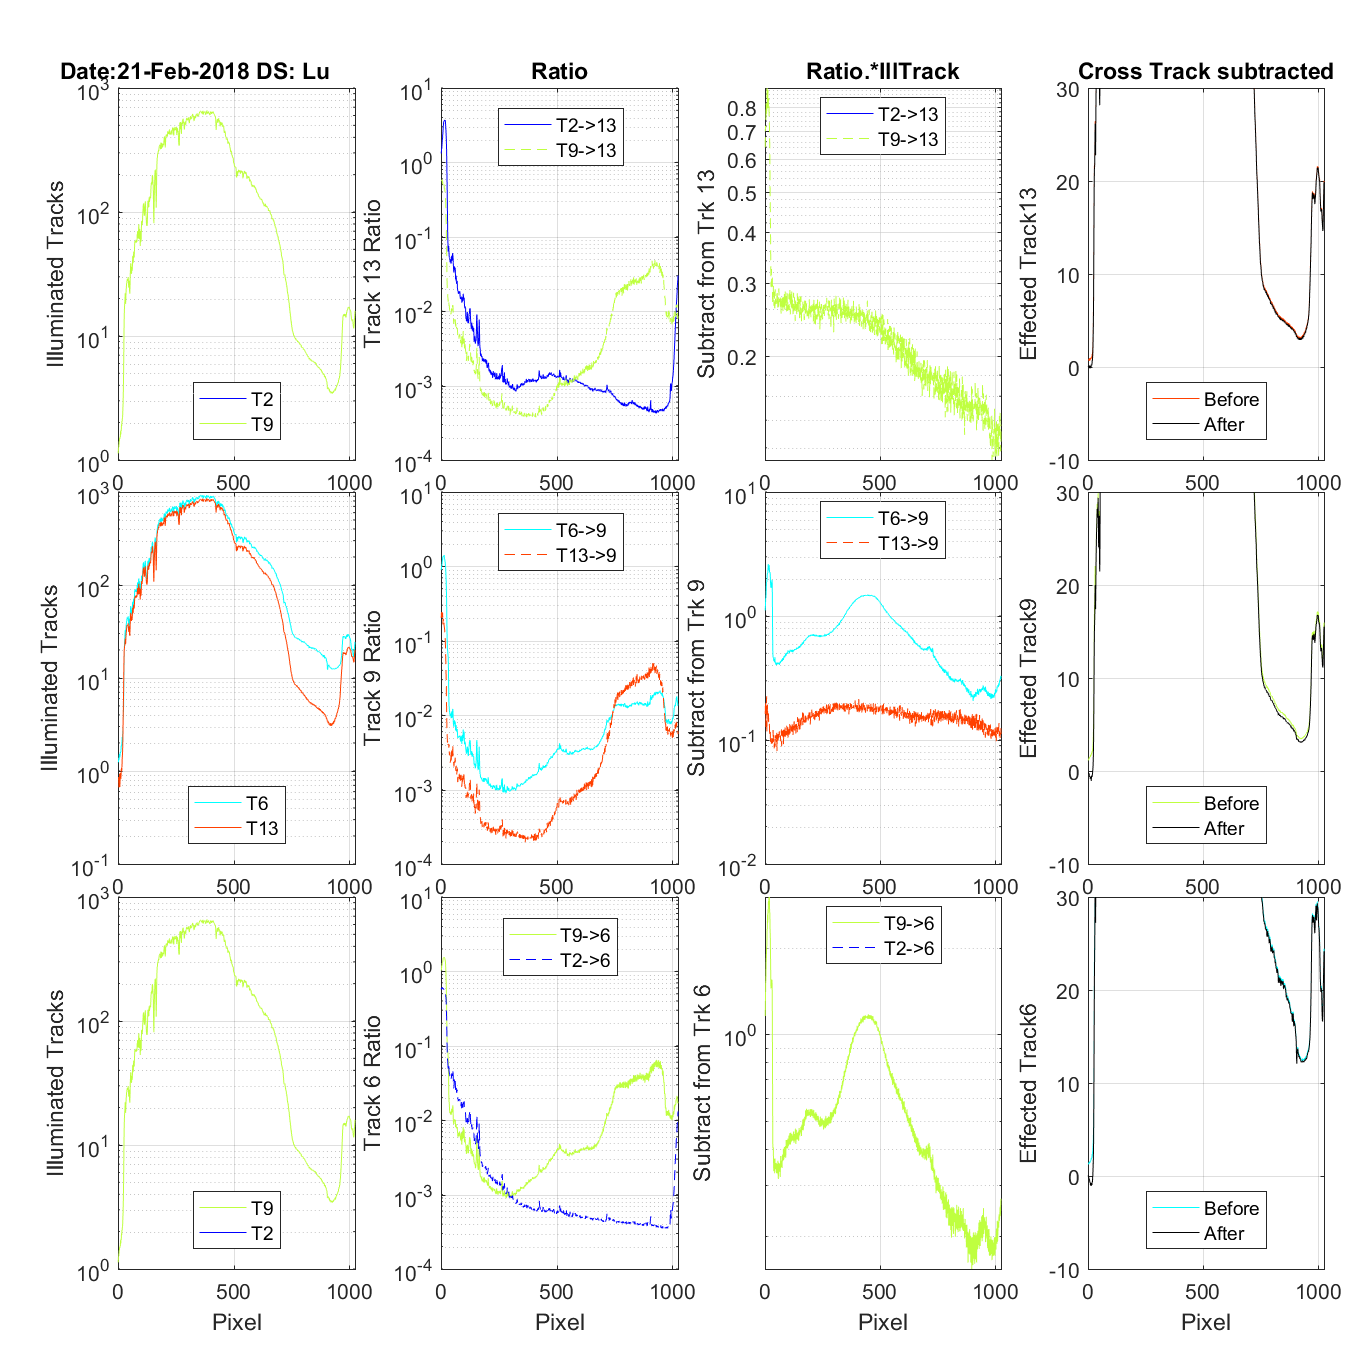
Figure 44 The title on the first row tells the date and if this is an Es/Lu data set (4 rows) or and Lu only data set (3 rows). The first column of graphs shows the tracks that are contaminating the track being corrected (Track in the last column). One of the tracks show in the first column is the mirror tracks causing UV ghosting problems the other is the closest track contamination with regular cross track light. The second column shows the UV or Cross track ratio for the contaminating tracks. The third column is the multiplication of the contaminating track and its ratio. The fourth column is the track being corrected. Before is the original data and after once the cross and UN ghosting contamination is removed. FYI: In the case of the Lu only data on column 2 you wil see the Es track shows as a ratio. But because there is no Es data it is not in any other column.
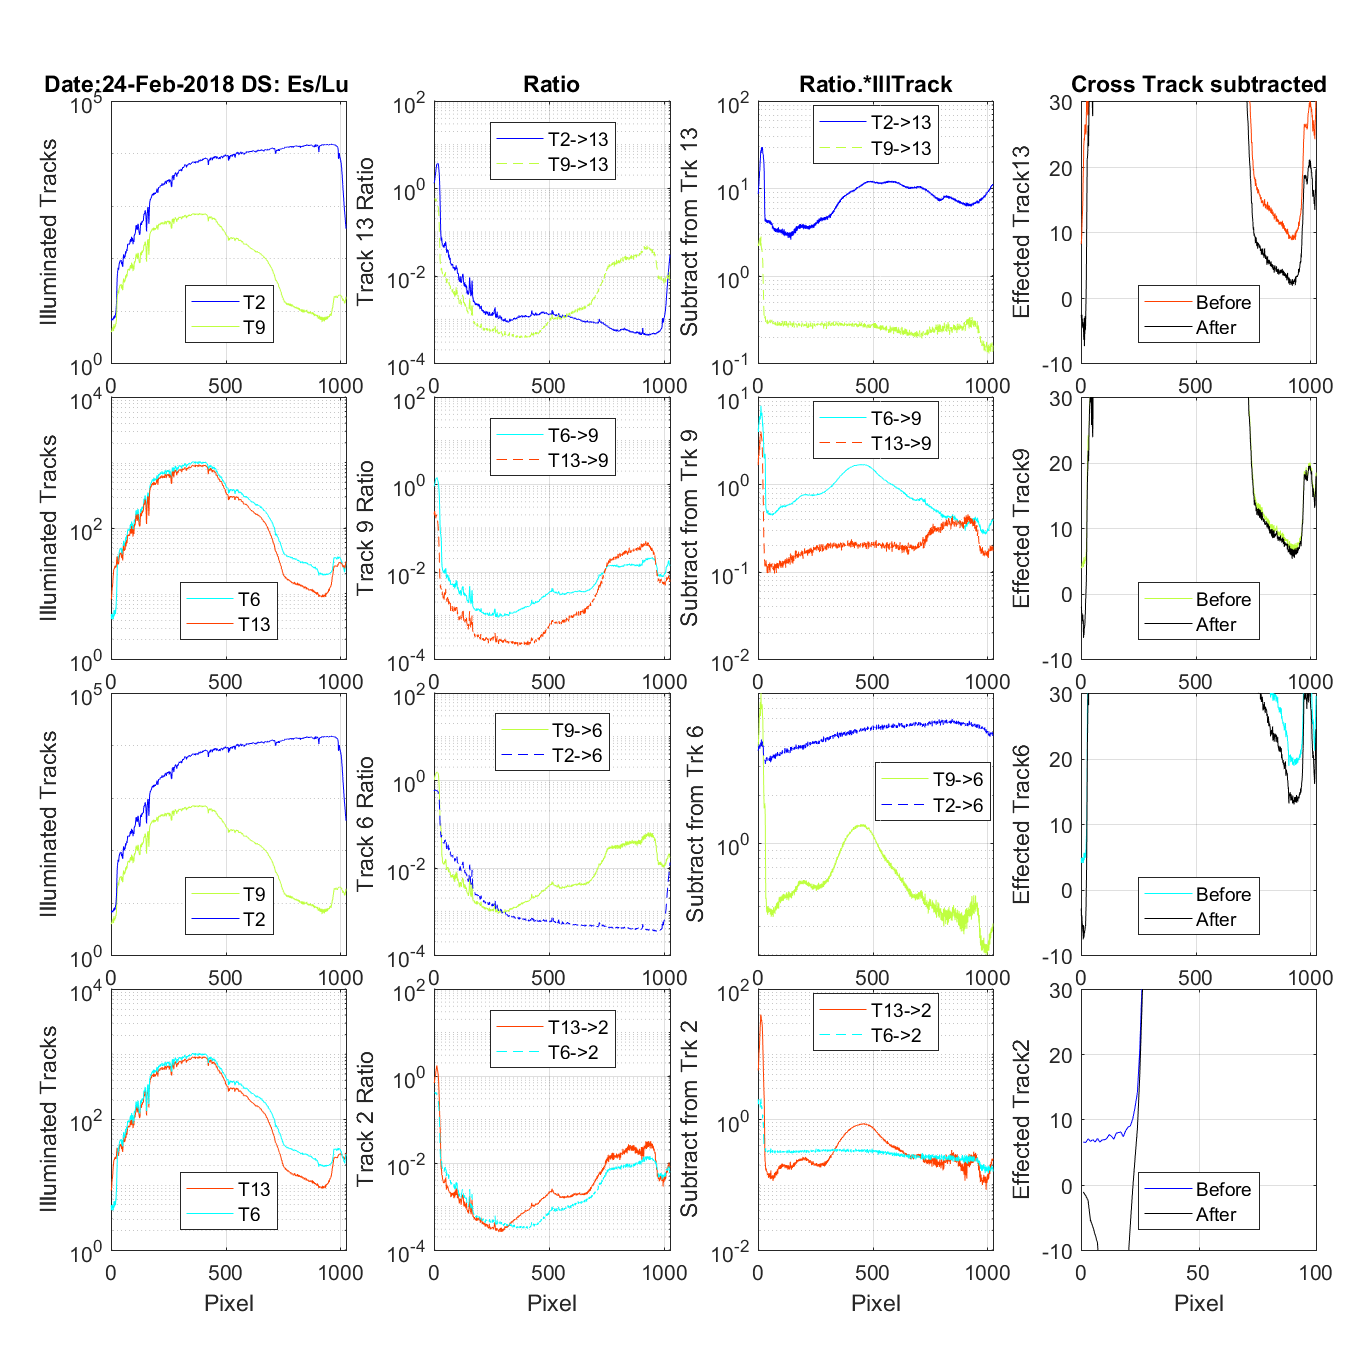
Figure 45 The title on the first row tells the date and if this is an Es/Lu data set (4 rows) or and Lu only data set (3 rows). The first column of graphs shows the tracks that are contaminating the track being corrected (Track in the last column). One of the tracks show in the first column is the mirror tracks causing UV ghosting problems the other is the closest track contamination with regular cross track light. The second column shows the UV or Cross track ratio for the contaminating tracks. The third column is the multiplication of the contaminating track and its ratio. The fourth column is the track being corrected. Before is the original data and after once the cross and UN ghosting contamination is removed. FYI: In the case of the Lu only data on column 2 you wil see the Es track shows as a ratio. But because there is no Es data it is not in any other column.
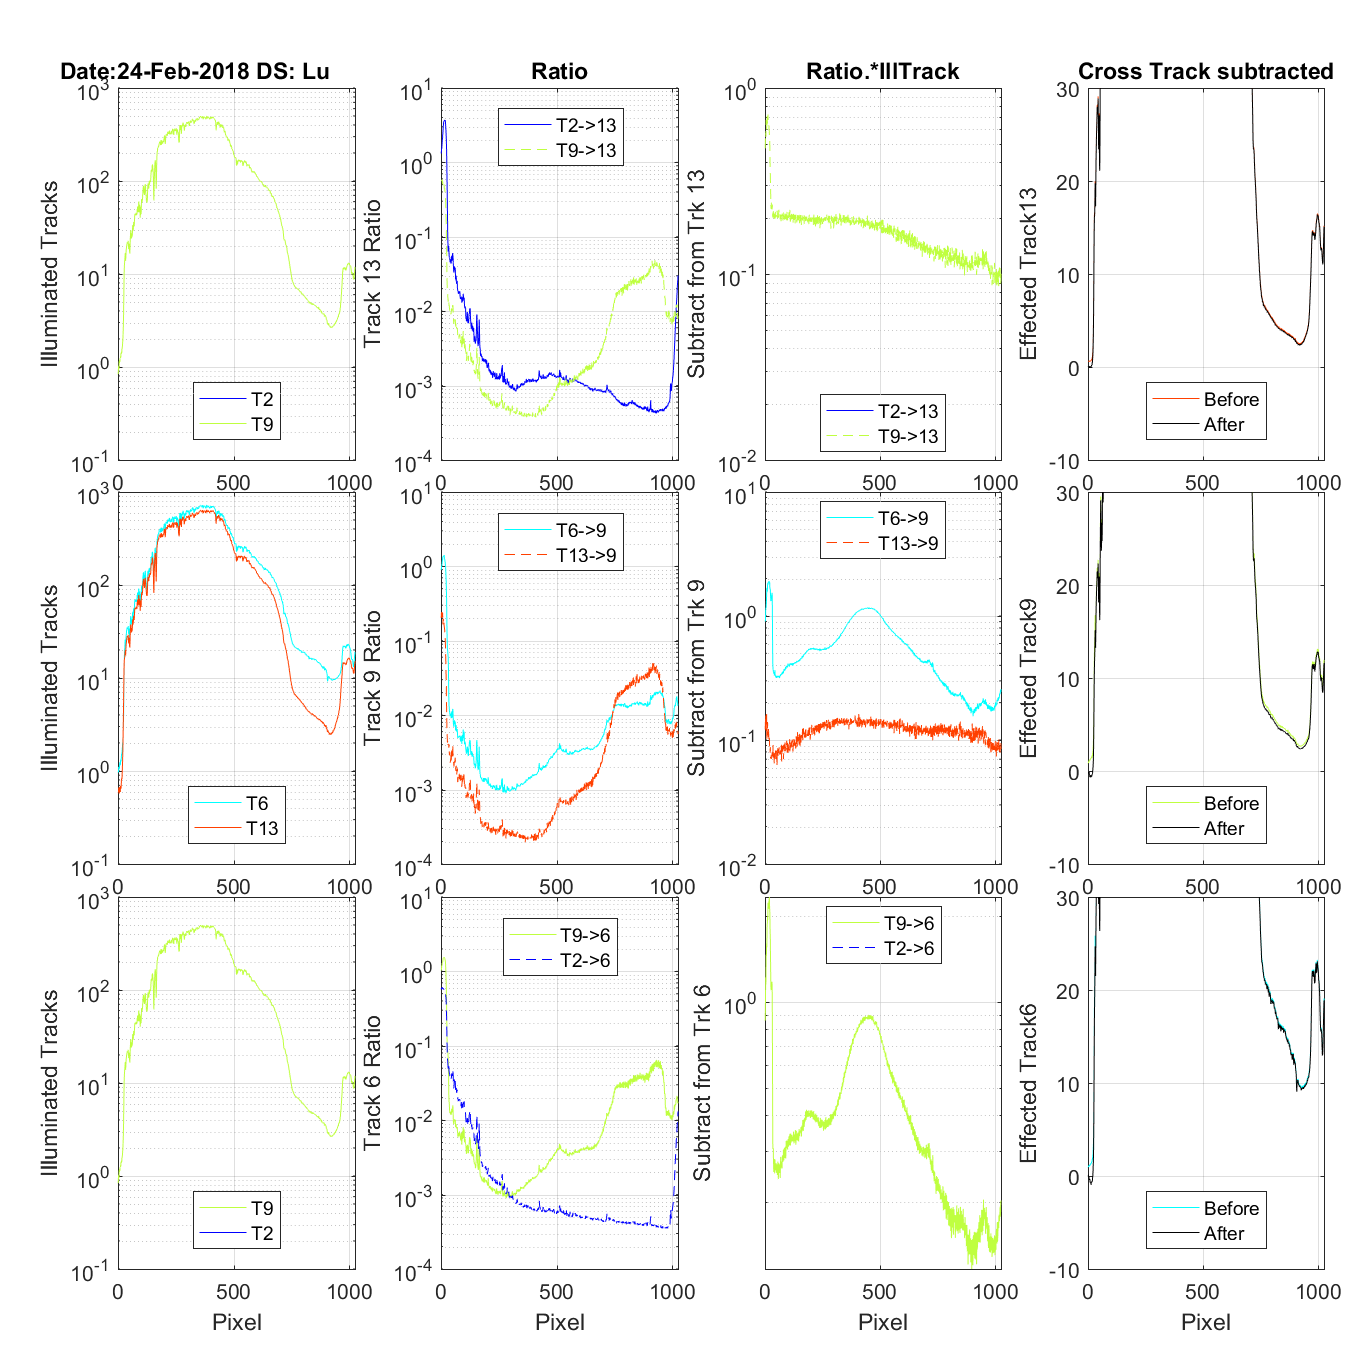
Figure 46 The title on the first row tells the date and if this is an Es/Lu data set (4 rows) or and Lu only data set (3 rows). The first column of graphs shows the tracks that are contaminating the track being corrected (Track in the last column). One of the tracks show in the first column is the mirror tracks causing UV ghosting problems the other is the closest track contamination with regular cross track light. The second column shows the UV or Cross track ratio for the contaminating tracks. The third column is the multiplication of the contaminating track and its ratio. The fourth column is the track being corrected. Before is the original data and after once the cross and UN ghosting contamination is removed. FYI: In the case of the Lu only data on column 2 you wil see the Es track shows as a ratio. But because there is no Es data it is not in any other column.
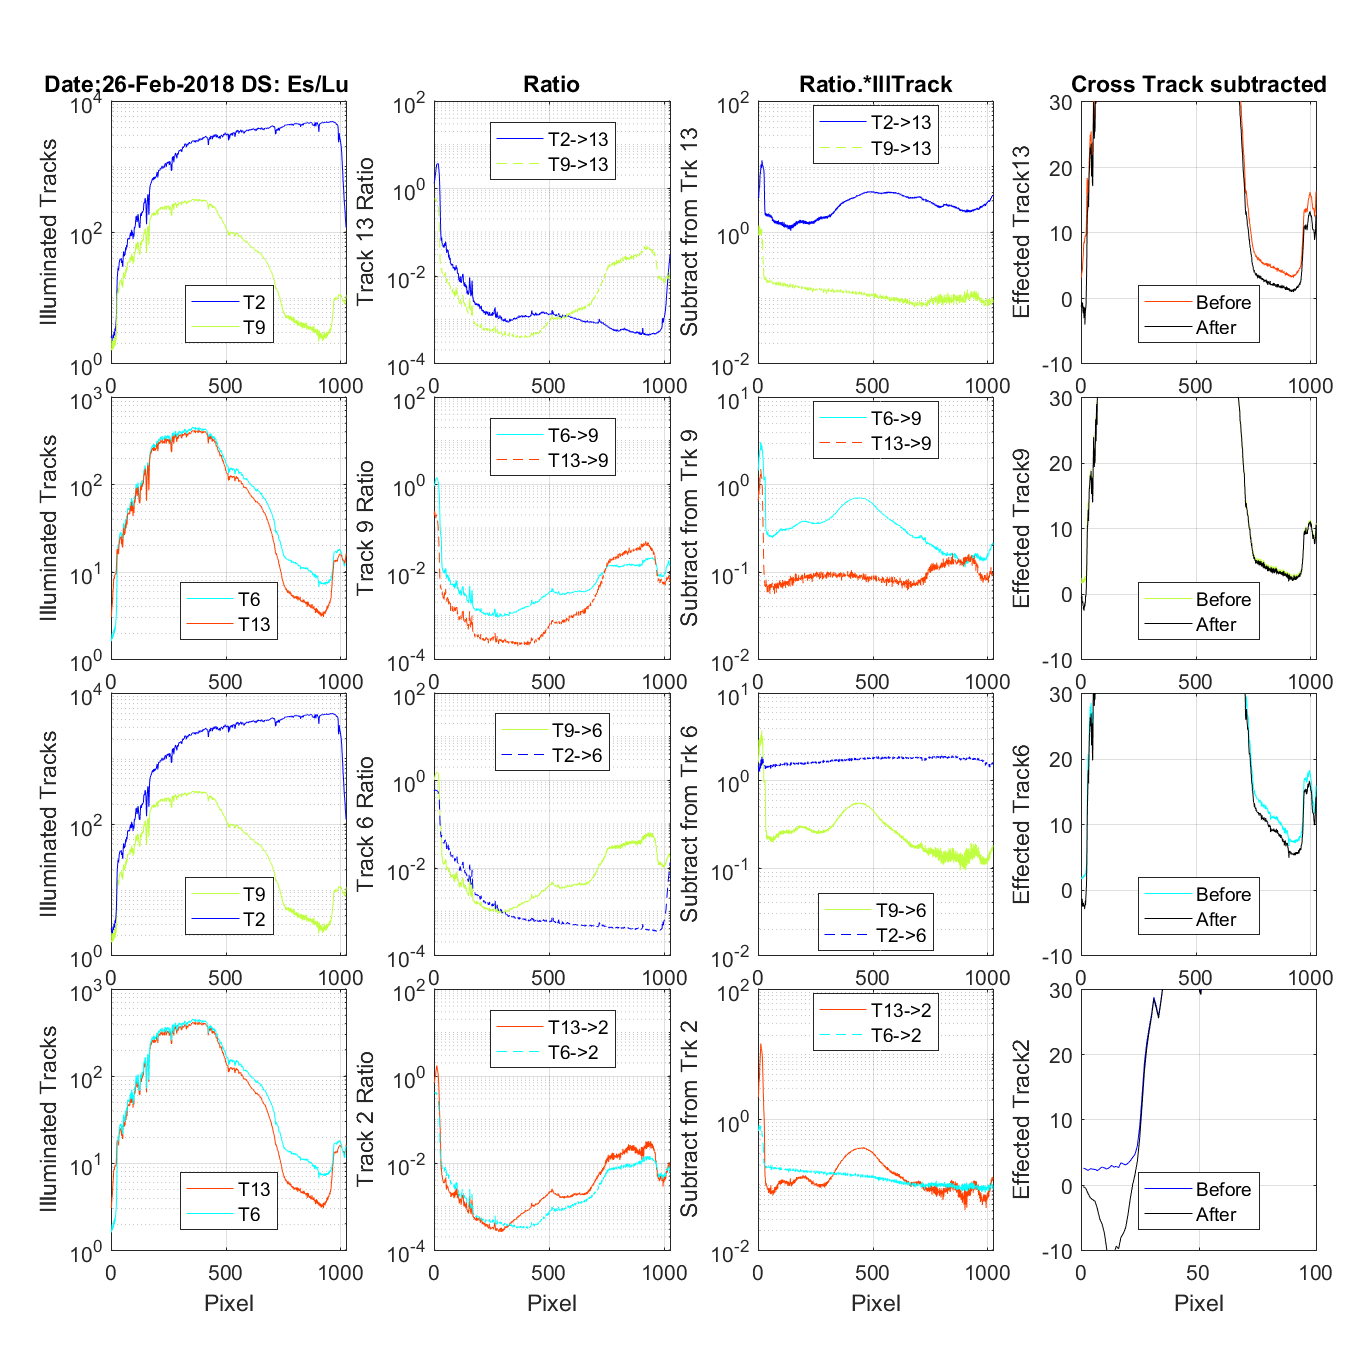
Figure 47 The title on the first row tells the date and if this is an Es/Lu data set (4 rows) or and Lu only data set (3 rows). The first column of graphs shows the tracks that are contaminating the track being corrected (Track in the last column). One of the tracks show in the first column is the mirror tracks causing UV ghosting problems the other is the closest track contamination with regular cross track light. The second column shows the UV or Cross track ratio for the contaminating tracks. The third column is the multiplication of the contaminating track and its ratio. The fourth column is the track being corrected. Before is the original data and after once the cross and UN ghosting contamination is removed. FYI: In the case of the Lu only data on column 2 you wil see the Es track shows as a ratio. But because there is no Es data it is not in any other column.
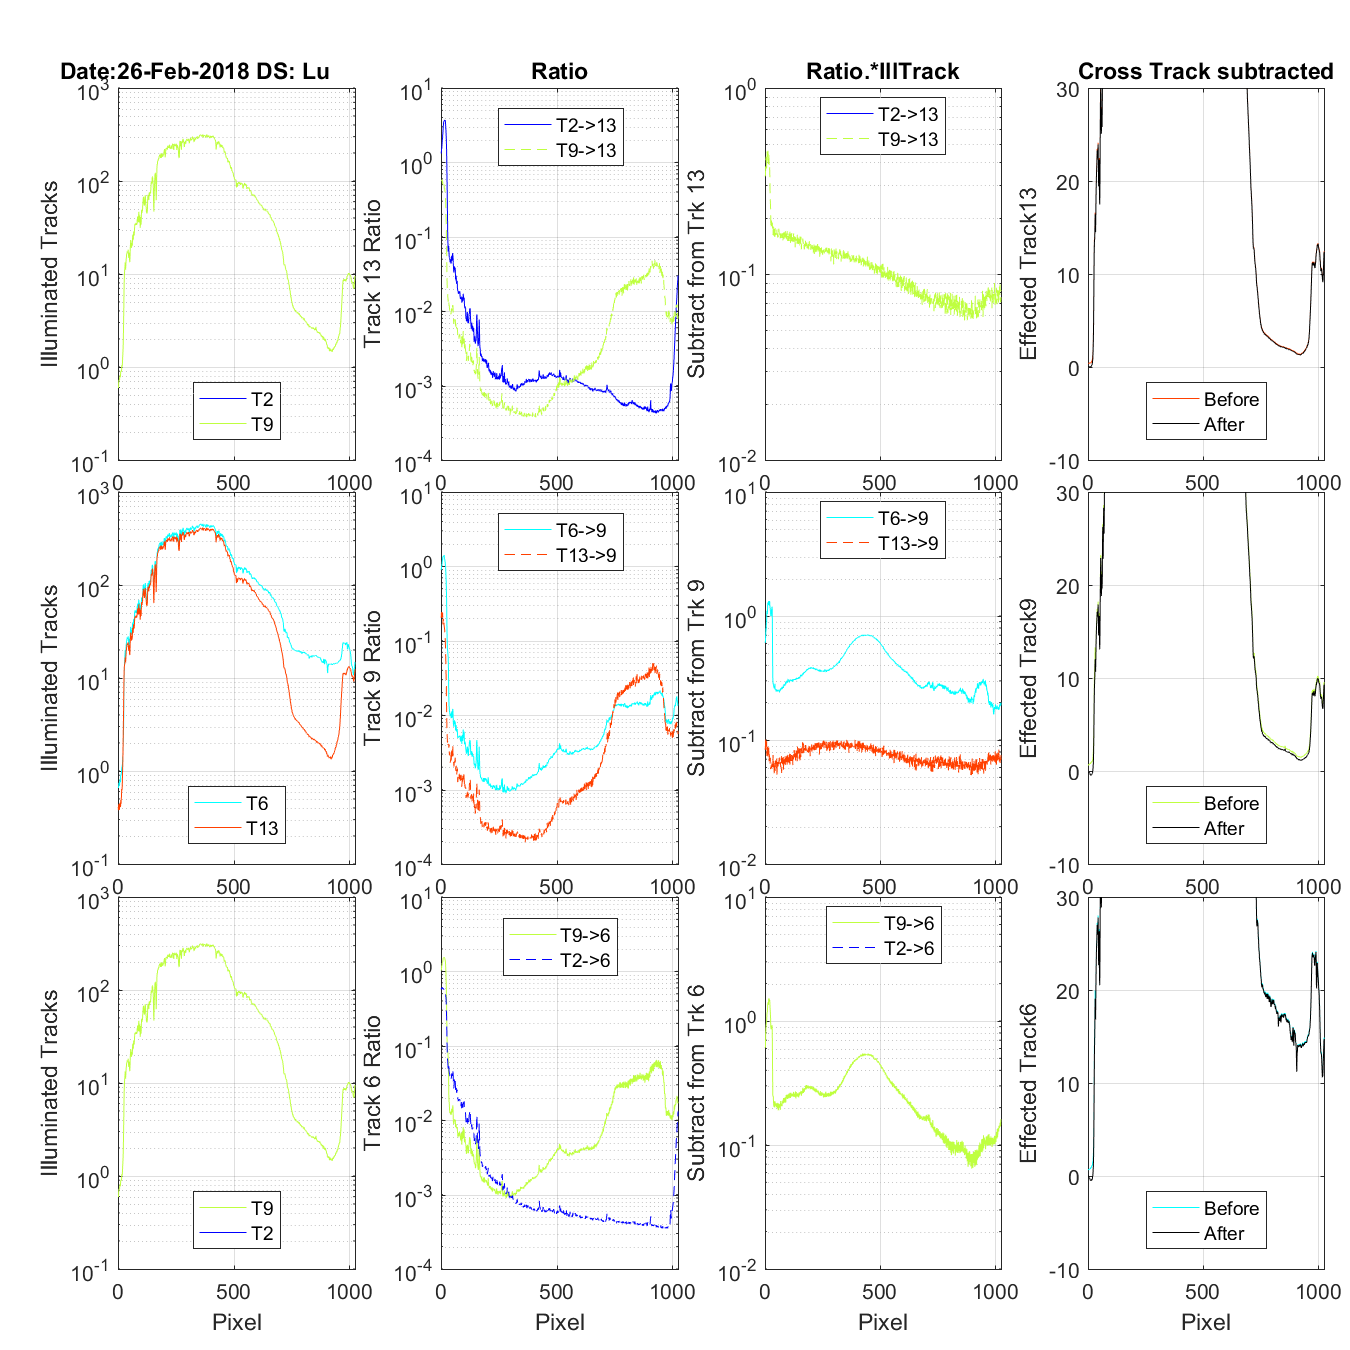
Figure 48 The title on the first row tells the date and if this is an Es/Lu data set (4 rows) or and Lu only data set (3 rows). The first column of graphs shows the tracks that are contaminating the track being corrected (Track in the last column). One of the tracks show in the first column is the mirror tracks causing UV ghosting problems the other is the closest track contamination with regular cross track light. The second column shows the UV or Cross track ratio for the contaminating tracks. The third column is the multiplication of the contaminating track and its ratio. The fourth column is the track being corrected. Before is the original data and after once the cross and UN ghosting contamination is removed. FYI: In the case of the Lu only data on column 2 you wil see the Es track shows as a ratio. But because there is no Es data it is not in any other column.
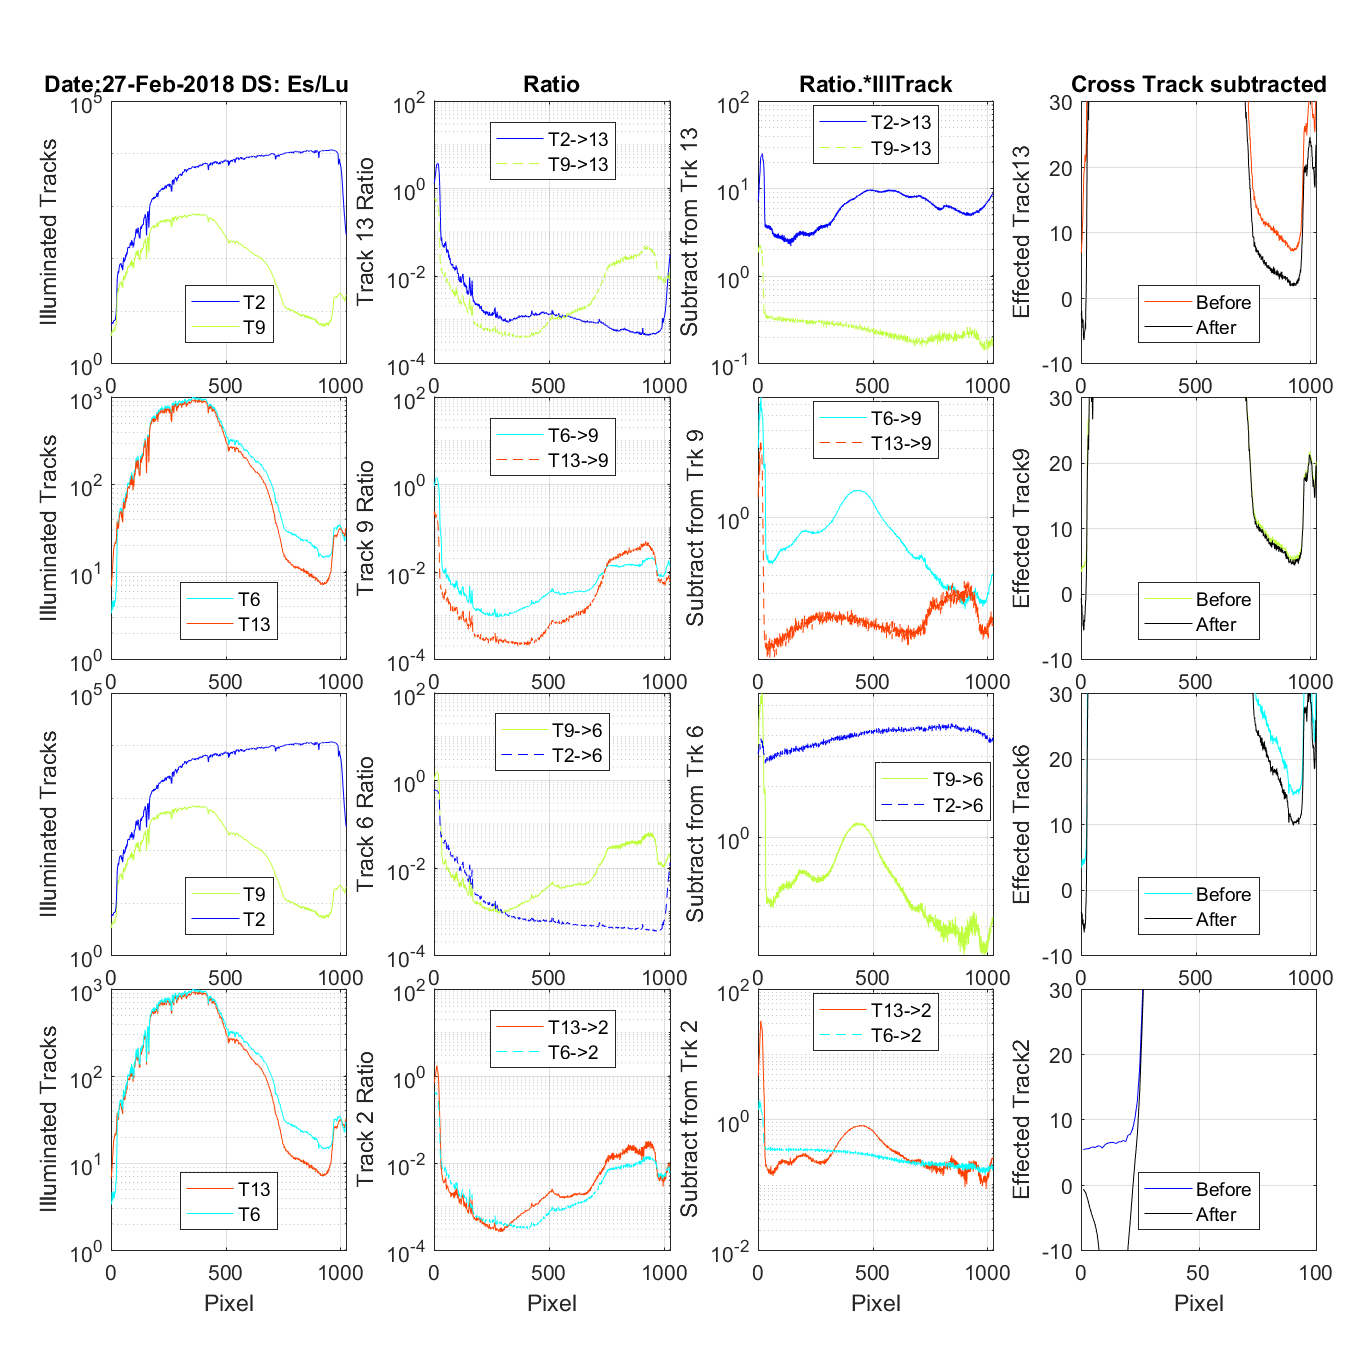
Figure 49 The title on the first row tells the date and if this is an Es/Lu data set (4 rows) or and Lu only data set (3 rows). The first column of graphs shows the tracks that are contaminating the track being corrected (Track in the last column). One of the tracks show in the first column is the mirror tracks causing UV ghosting problems the other is the closest track contamination with regular cross track light. The second column shows the UV or Cross track ratio for the contaminating tracks. The third column is the multiplication of the contaminating track and its ratio. The fourth column is the track being corrected. Before is the original data and after once the cross and UN ghosting contamination is removed. FYI: In the case of the Lu only data on column 2 you wil see the Es track shows as a ratio. But because there is no Es data it is not in any other column.
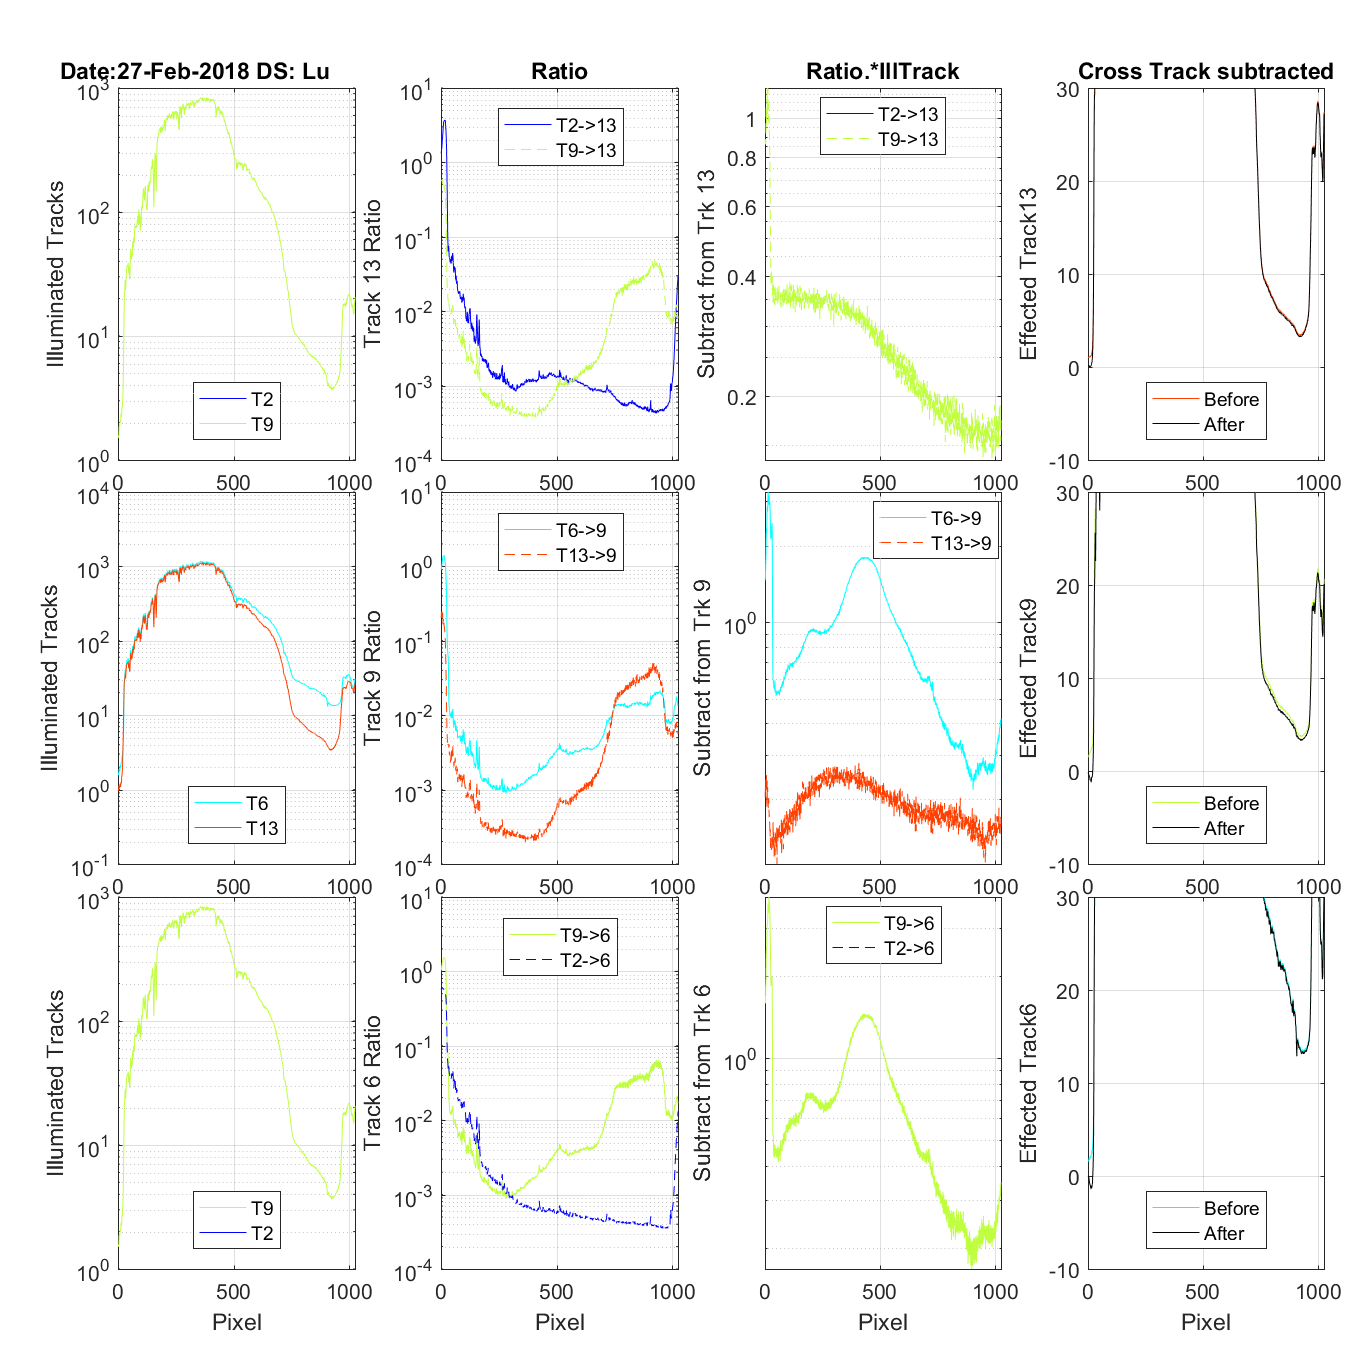
Figure 50 The title on the first row tells the date and if this is an Es/Lu data set (4 rows) or and Lu only data set (3 rows). The first column of graphs shows the tracks that are contaminating the track being corrected (Track in the last column). One of the tracks show in the first column is the mirror tracks causing UV ghosting problems the other is the closest track contamination with regular cross track light. The second column shows the UV or Cross track ratio for the contaminating tracks. The third column is the multiplication of the contaminating track and its ratio. The fourth column is the track being corrected. Before is the original data and after once the cross and UN ghosting contamination is removed. FYI: In the case of the Lu only data on column 2 you wil see the Es track shows as a ratio. But because there is no Es data it is not in any other column.

Figure 51 The title on the first row tells the date and if this is an Es/Lu data set (4 rows) or and Lu only data set (3 rows). The first column of graphs shows the tracks that are contaminating the track being corrected (Track in the last column). One of the tracks show in the first column is the mirror tracks causing UV ghosting problems the other is the closest track contamination with regular cross track light. The second column shows the UV or Cross track ratio for the contaminating tracks. The third column is the multiplication of the contaminating track and its ratio. The fourth column is the track being corrected. Before is the original data and after once the cross and UN ghosting contamination is removed. FYI: In the case of the Lu only data on column 2 you wil see the Es track shows as a ratio. But because there is no Es data it is not in any other column.
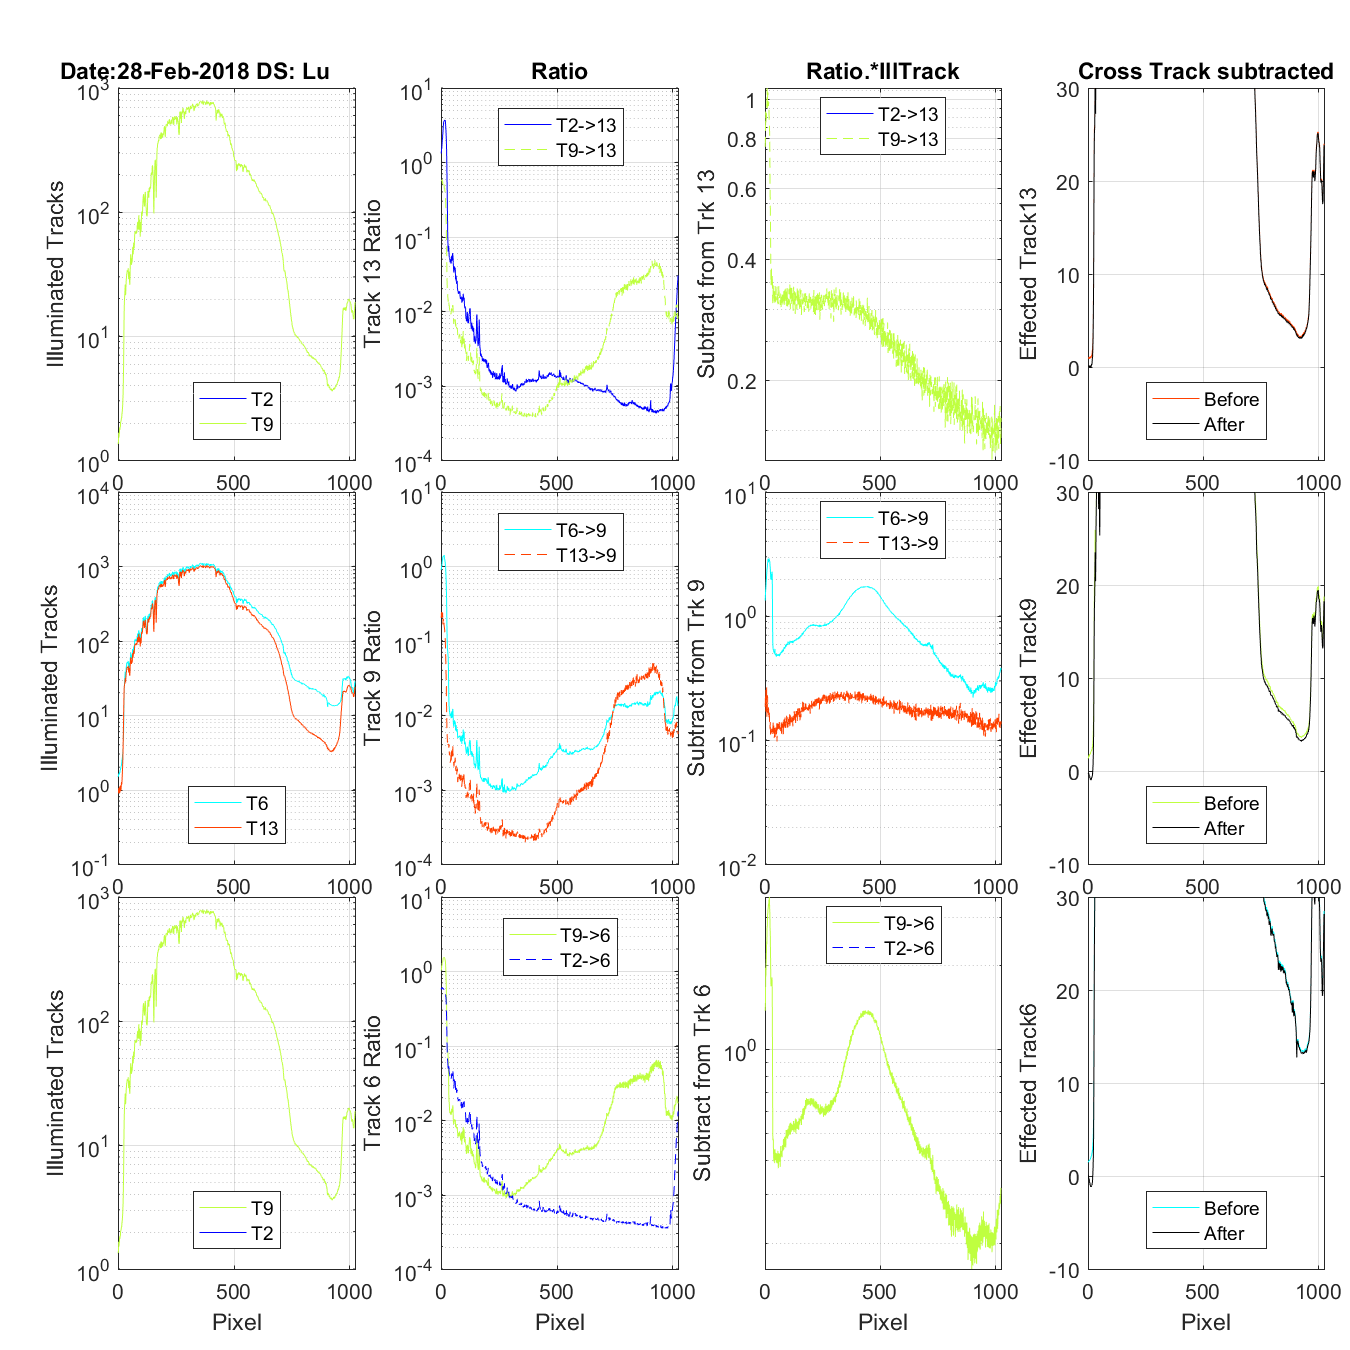
Figure 52 The title on the first row tells the date and if this is an Es/Lu data set (4 rows) or and Lu only data set (3 rows). The first column of graphs shows the tracks that are contaminating the track being corrected (Track in the last column). One of the tracks show in the first column is the mirror tracks causing UV ghosting problems the other is the closest track contamination with regular cross track light. The second column shows the UV or Cross track ratio for the contaminating tracks. The third column is the multiplication of the contaminating track and its ratio. The fourth column is the track being corrected. Before is the original data and after once the cross and UN ghosting contamination is removed. FYI: In the case of the Lu only data on column 2 you wil see the Es track shows as a ratio. But because there is no Es data it is not in any other column.
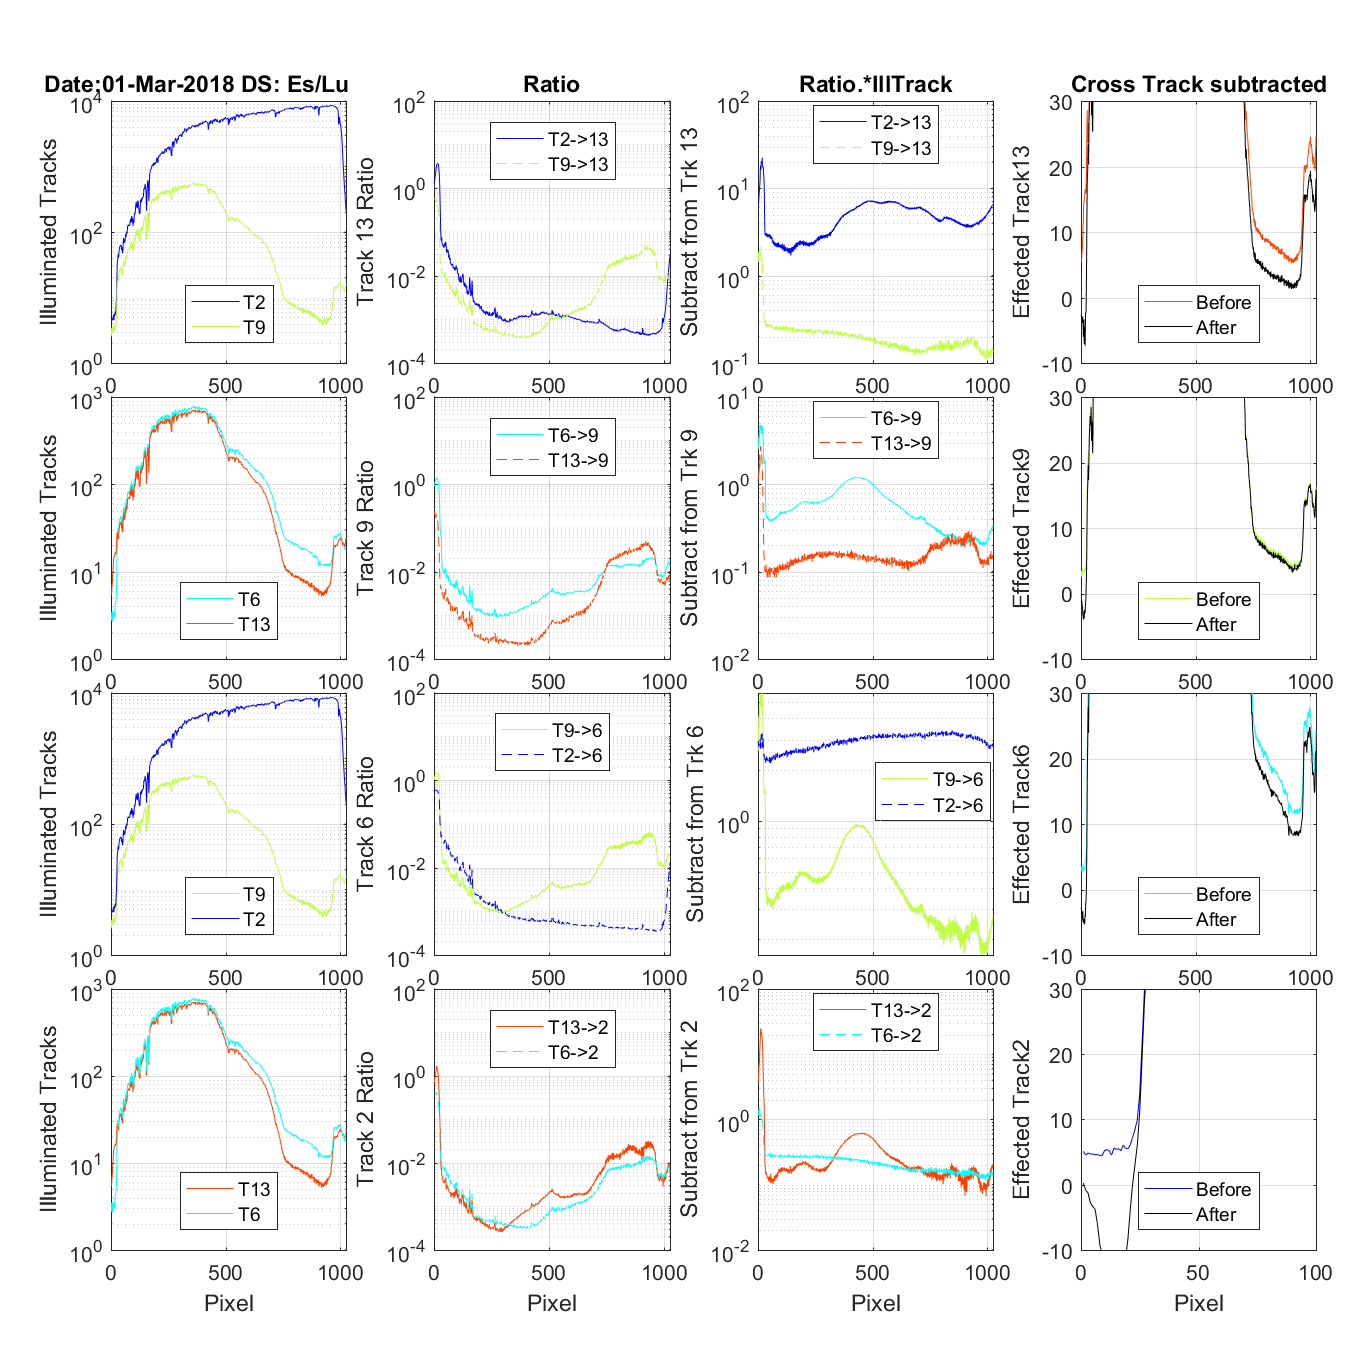
Figure 53 The title on the first row tells the date and if this is an Es/Lu data set (4 rows) or and Lu only data set (3 rows). The first column of graphs shows the tracks that are contaminating the track being corrected (Track in the last column). One of the tracks show in the first column is the mirror tracks causing UV ghosting problems the other is the closest track contamination with regular cross track light. The second column shows the UV or Cross track ratio for the contaminating tracks. The third column is the multiplication of the contaminating track and its ratio. The fourth column is the track being corrected. Before is the original data and after once the cross and UN ghosting contamination is removed. FYI: In the case of the Lu only data on column 2 you wil see the Es track shows as a ratio. But because there is no Es data it is not in any other column.
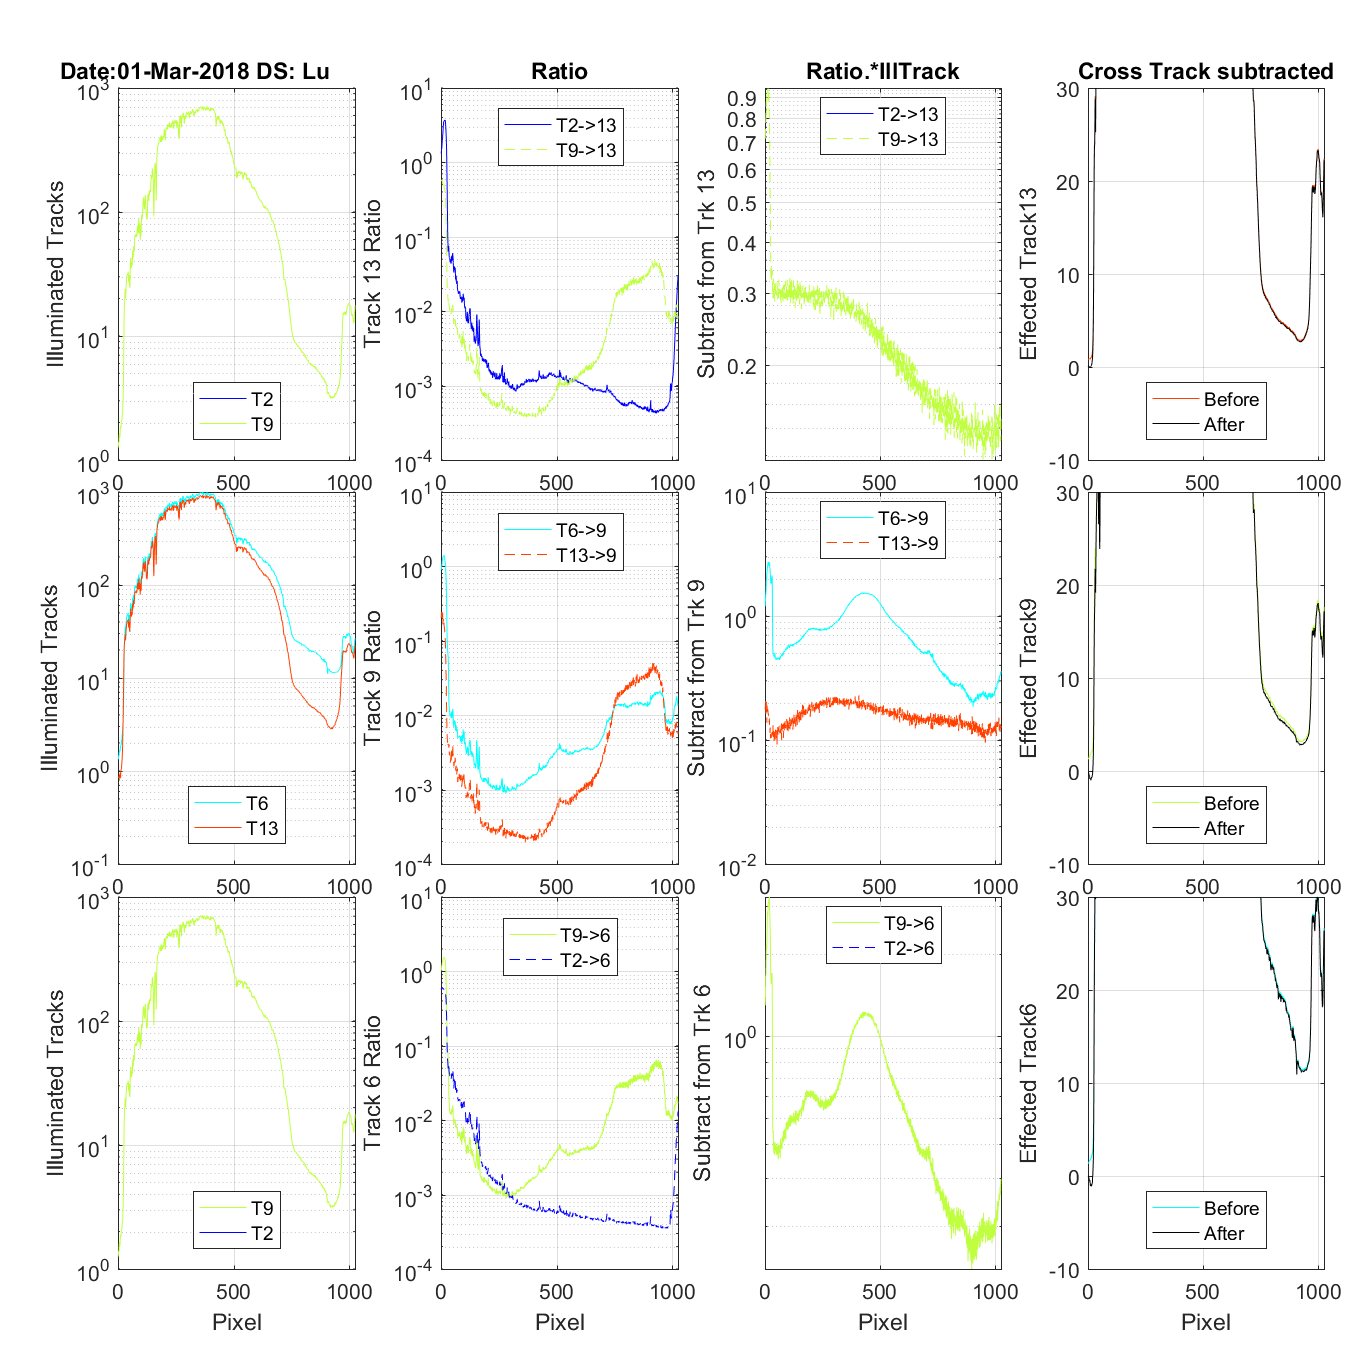
Figure 54 The title on the first row tells the date and if this is an Es/Lu data set (4 rows) or and Lu only data set (3 rows). The first column of graphs shows the tracks that are contaminating the track being corrected (Track in the last column). One of the tracks show in the first column is the mirror tracks causing UV ghosting problems the other is the closest track contamination with regular cross track light. The second column shows the UV or Cross track ratio for the contaminating tracks. The third column is the multiplication of the contaminating track and its ratio. The fourth column is the track being corrected. Before is the original data and after once the cross and UN ghosting contamination is removed. FYI: In the case of the Lu only data on column 2 you wil see the Es track shows as a ratio. But because there is no Es data it is not in any other column.
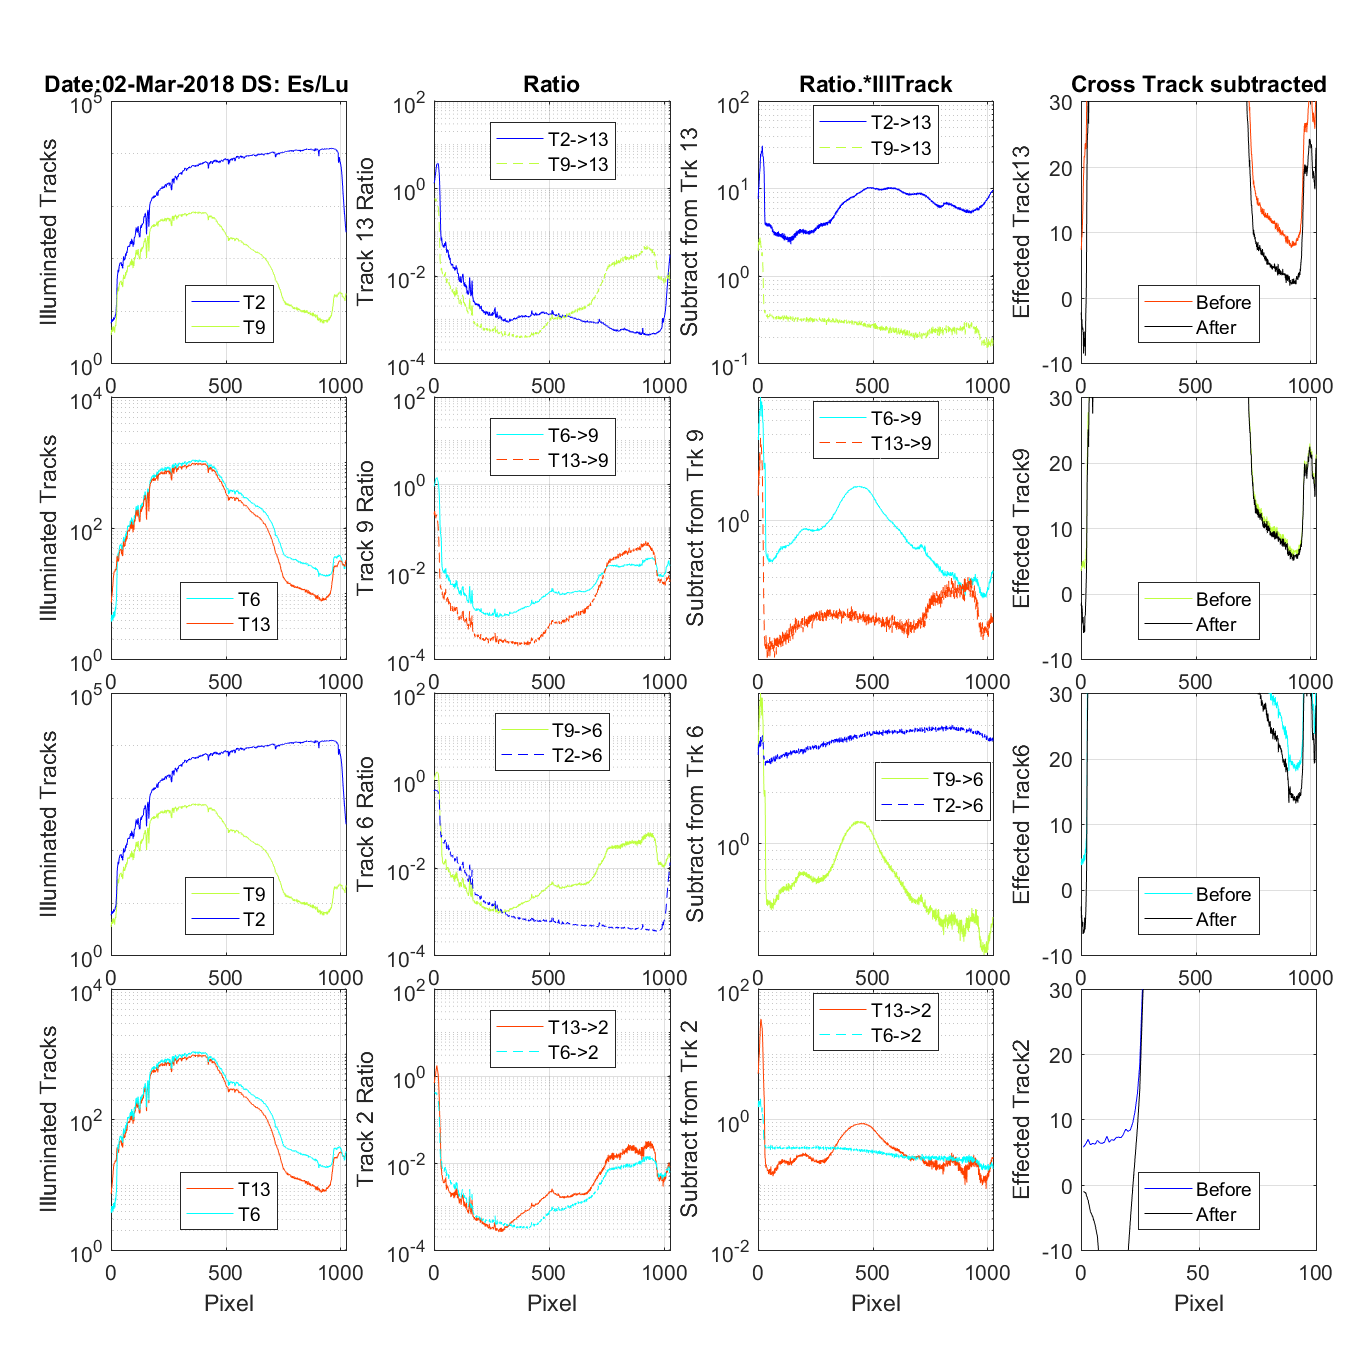
Figure 55 The title on the first row tells the date and if this is an Es/Lu data set (4 rows) or and Lu only data set (3 rows). The first column of graphs shows the tracks that are contaminating the track being corrected (Track in the last column). One of the tracks show in the first column is the mirror tracks causing UV ghosting problems the other is the closest track contamination with regular cross track light. The second column shows the UV or Cross track ratio for the contaminating tracks. The third column is the multiplication of the contaminating track and its ratio. The fourth column is the track being corrected. Before is the original data and after once the cross and UN ghosting contamination is removed. FYI: In the case of the Lu only data on column 2 you wil see the Es track shows as a ratio. But because there is no Es data it is not in any other column.
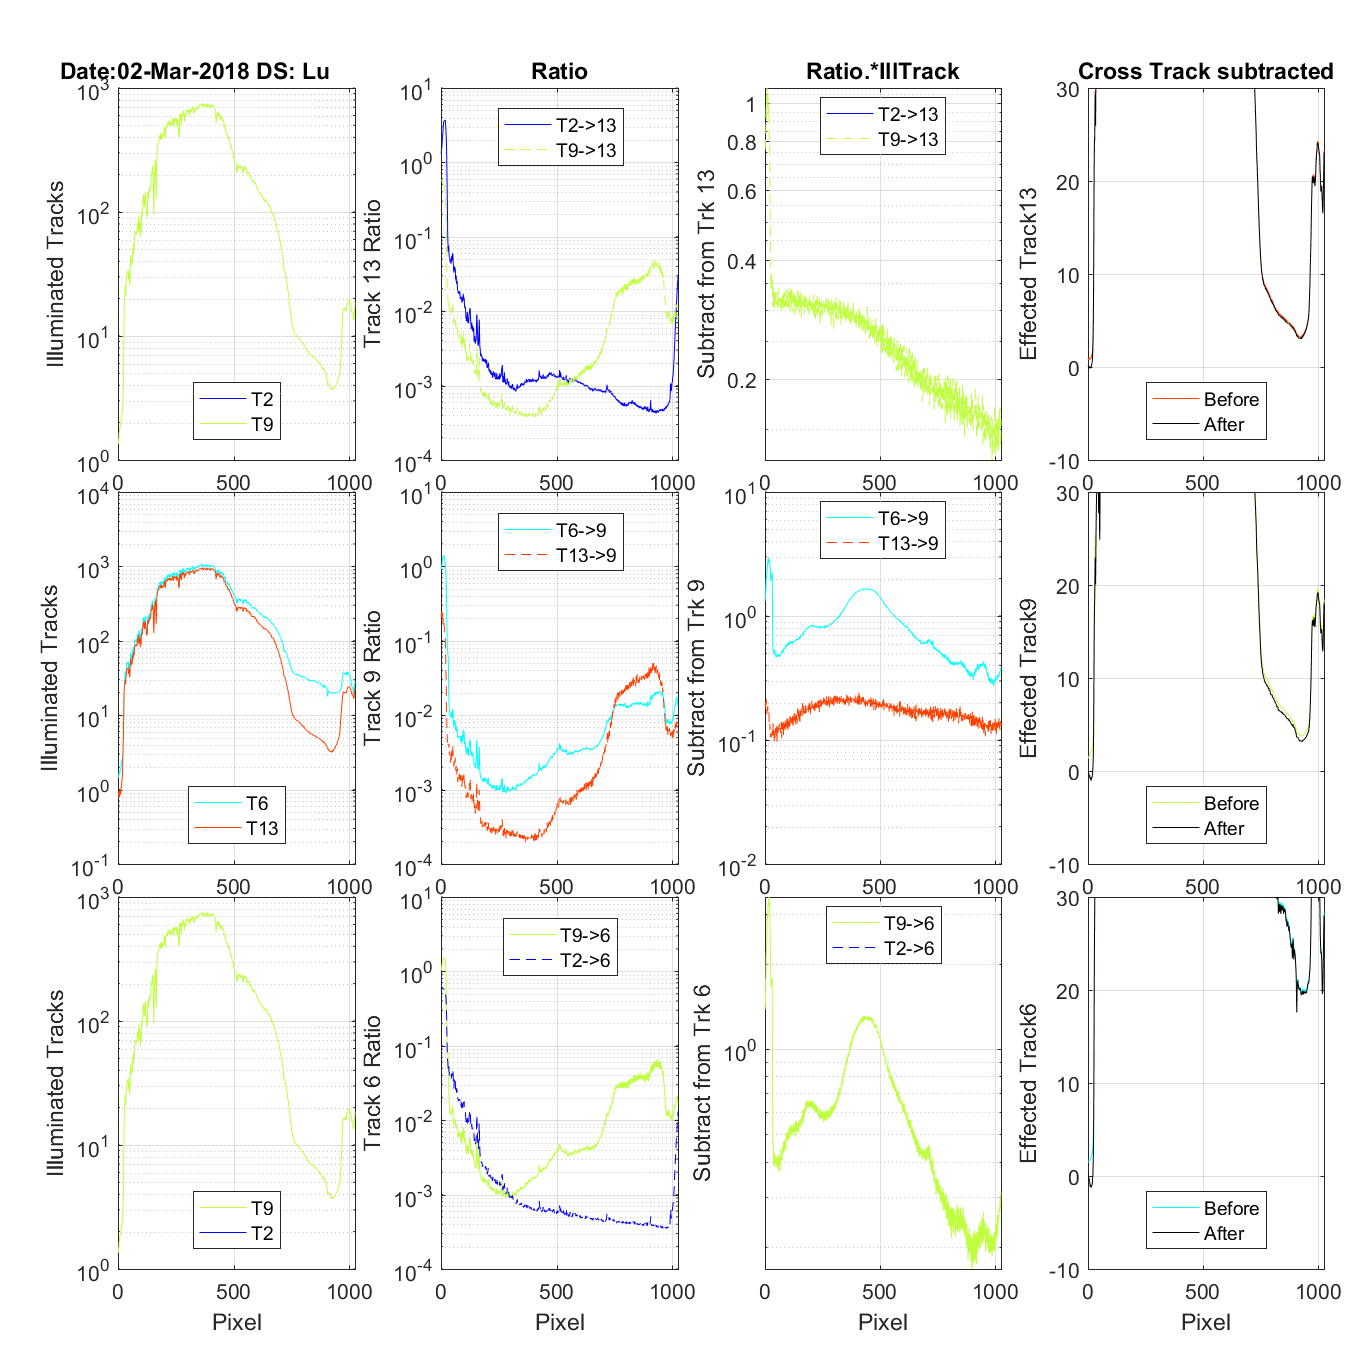
Figure 56 The title on the first row tells the date and if this is an Es/Lu data set (4 rows) or and Lu only data set (3 rows). The first column of graphs shows the tracks that are contaminating the track being corrected (Track in the last column). One of the tracks show in the first column is the mirror tracks causing UV ghosting problems the other is the closest track contamination with regular cross track light. The second column shows the UV or Cross track ratio for the contaminating tracks. The third column is the multiplication of the contaminating track and its ratio. The fourth column is the track being corrected. Before is the original data and after once the cross and UN ghosting contamination is removed. FYI: In the case of the Lu only data on column 2 you wil see the Es track shows as a ratio. But because there is no Es data it is not in any other column.
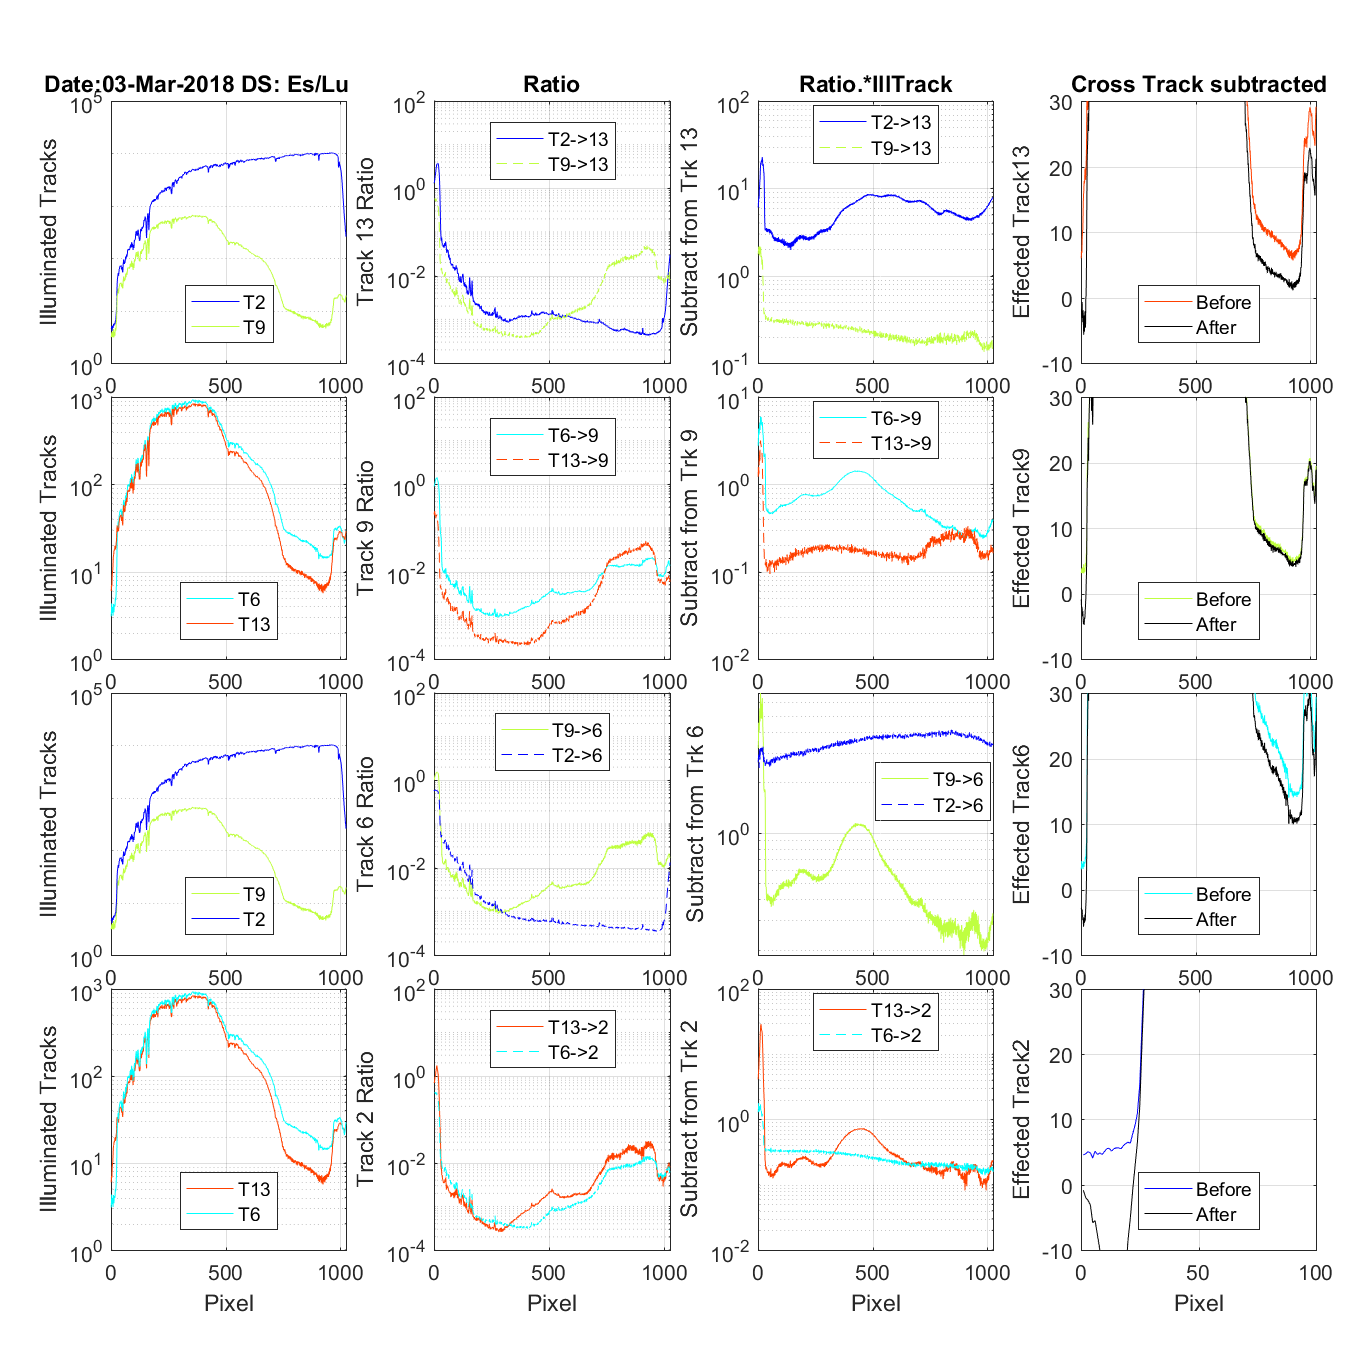
Figure 57 The title on the first row tells the date and if this is an Es/Lu data set (4 rows) or and Lu only data set (3 rows). The first column of graphs shows the tracks that are contaminating the track being corrected (Track in the last column). One of the tracks show in the first column is the mirror tracks causing UV ghosting problems the other is the closest track contamination with regular cross track light. The second column shows the UV or Cross track ratio for the contaminating tracks. The third column is the multiplication of the contaminating track and its ratio. The fourth column is the track being corrected. Before is the original data and after once the cross and UN ghosting contamination is removed. FYI: In the case of the Lu only data on column 2 you wil see the Es track shows as a ratio. But because there is no Es data it is not in any other column.
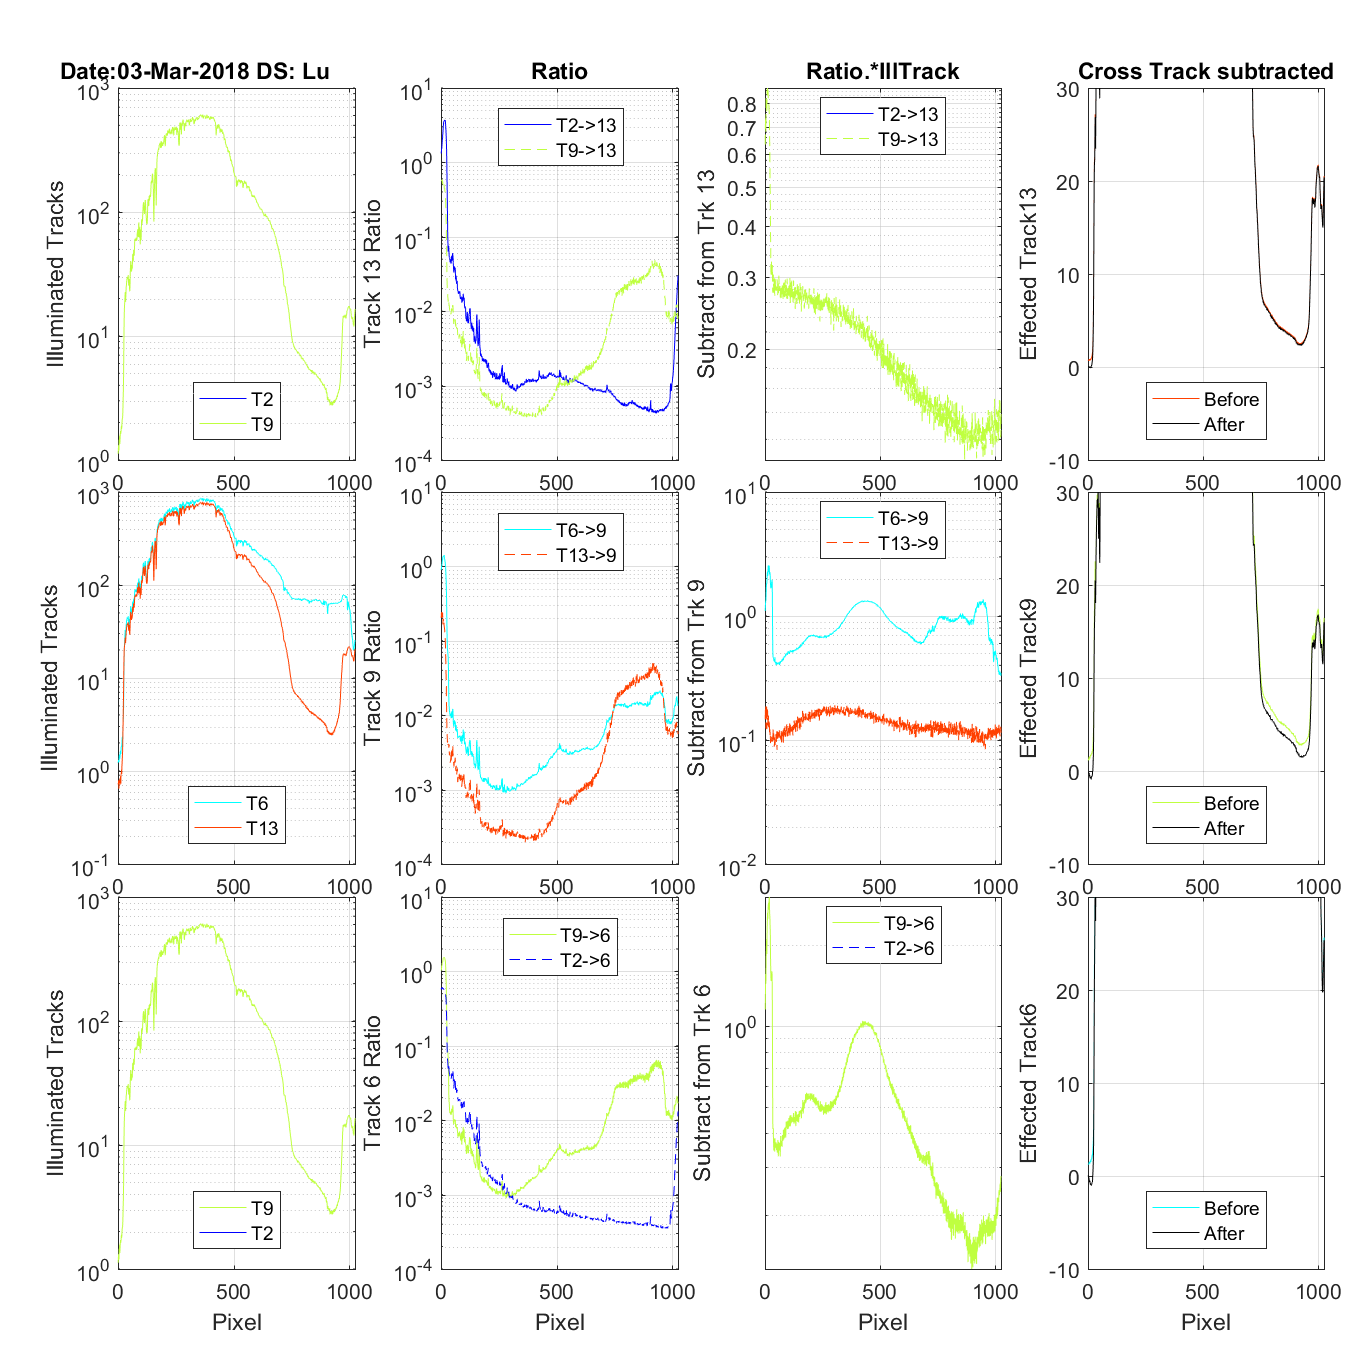
Figure 58 The title on the first row tells the date and if this is an Es/Lu data set (4 rows) or and Lu only data set (3 rows). The first column of graphs shows the tracks that are contaminating the track being corrected (Track in the last column). One of the tracks show in the first column is the mirror tracks causing UV ghosting problems the other is the closest track contamination with regular cross track light. The second column shows the UV or Cross track ratio for the contaminating tracks. The third column is the multiplication of the contaminating track and its ratio. The fourth column is the track being corrected. Before is the original data and after once the cross and UN ghosting contamination is removed. FYI: In the case of the Lu only data on column 2 you wil see the Es track shows as a ratio. But because there is no Es data it is not in any other column.
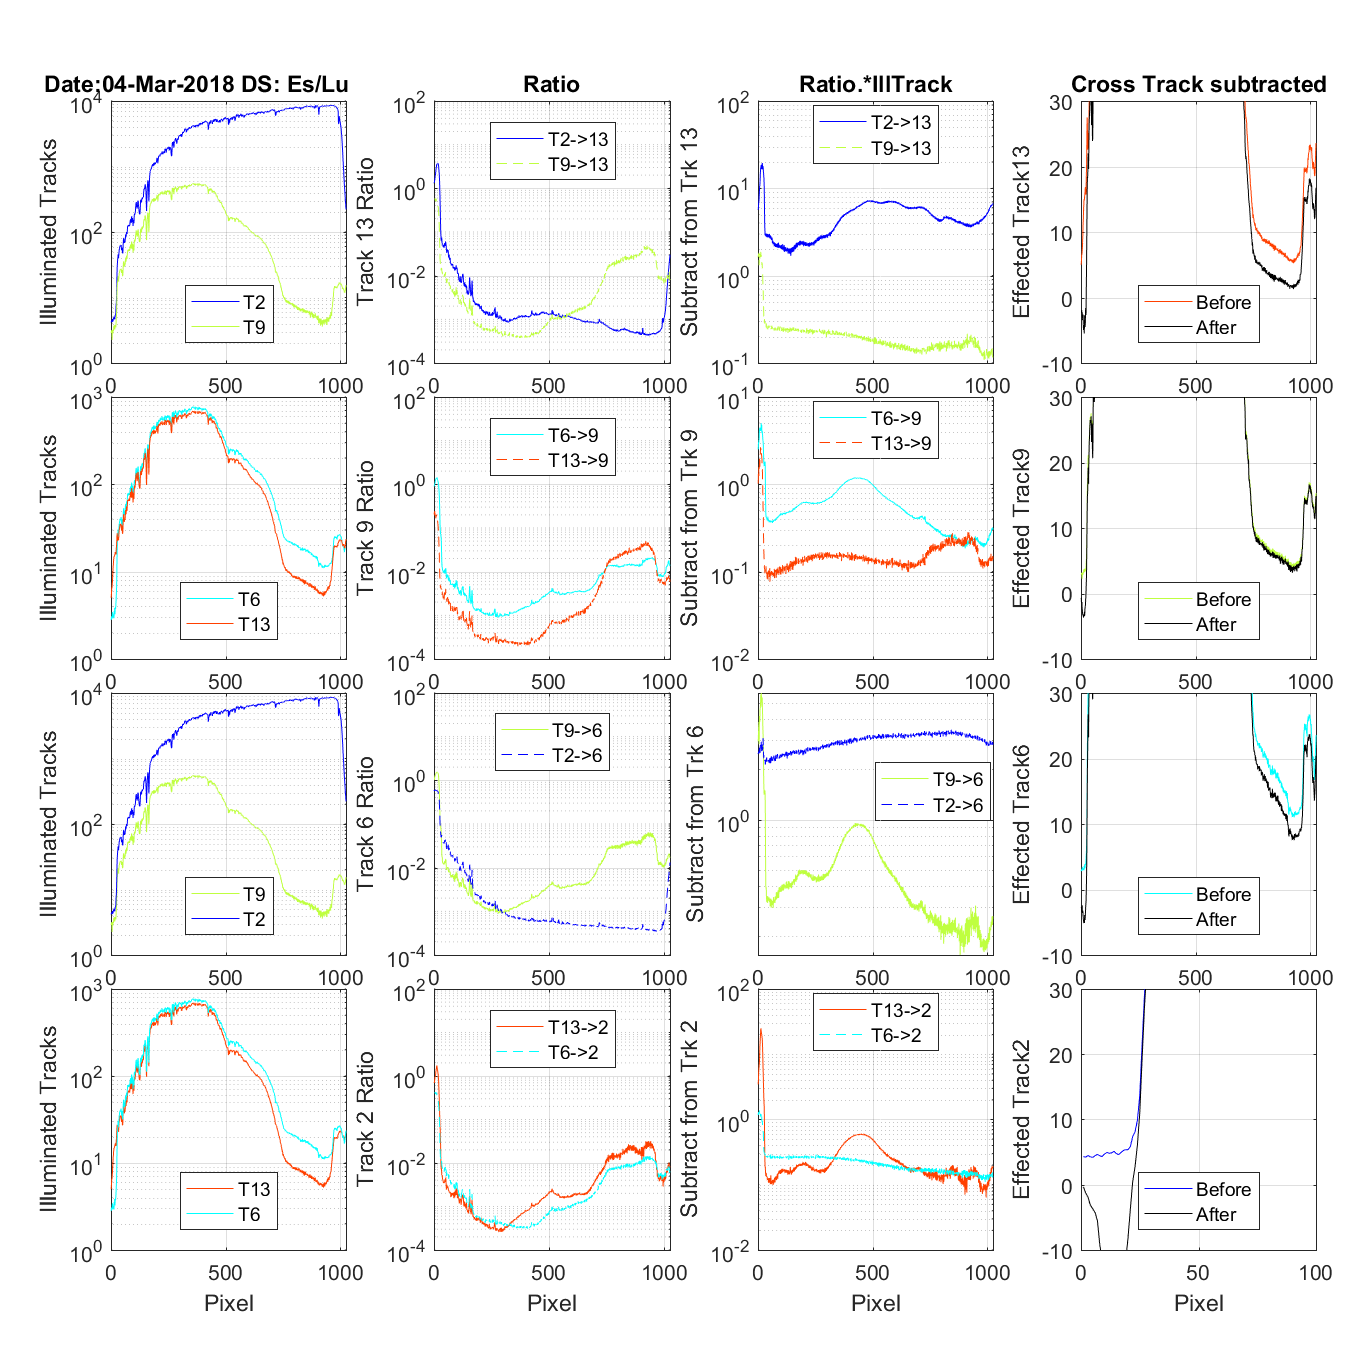
Figure 59 The title on the first row tells the date and if this is an Es/Lu data set (4 rows) or and Lu only data set (3 rows). The first column of graphs shows the tracks that are contaminating the track being corrected (Track in the last column). One of the tracks show in the first column is the mirror tracks causing UV ghosting problems the other is the closest track contamination with regular cross track light. The second column shows the UV or Cross track ratio for the contaminating tracks. The third column is the multiplication of the contaminating track and its ratio. The fourth column is the track being corrected. Before is the original data and after once the cross and UN ghosting contamination is removed. FYI: In the case of the Lu only data on column 2 you wil see the Es track shows as a ratio. But because there is no Es data it is not in any other column.
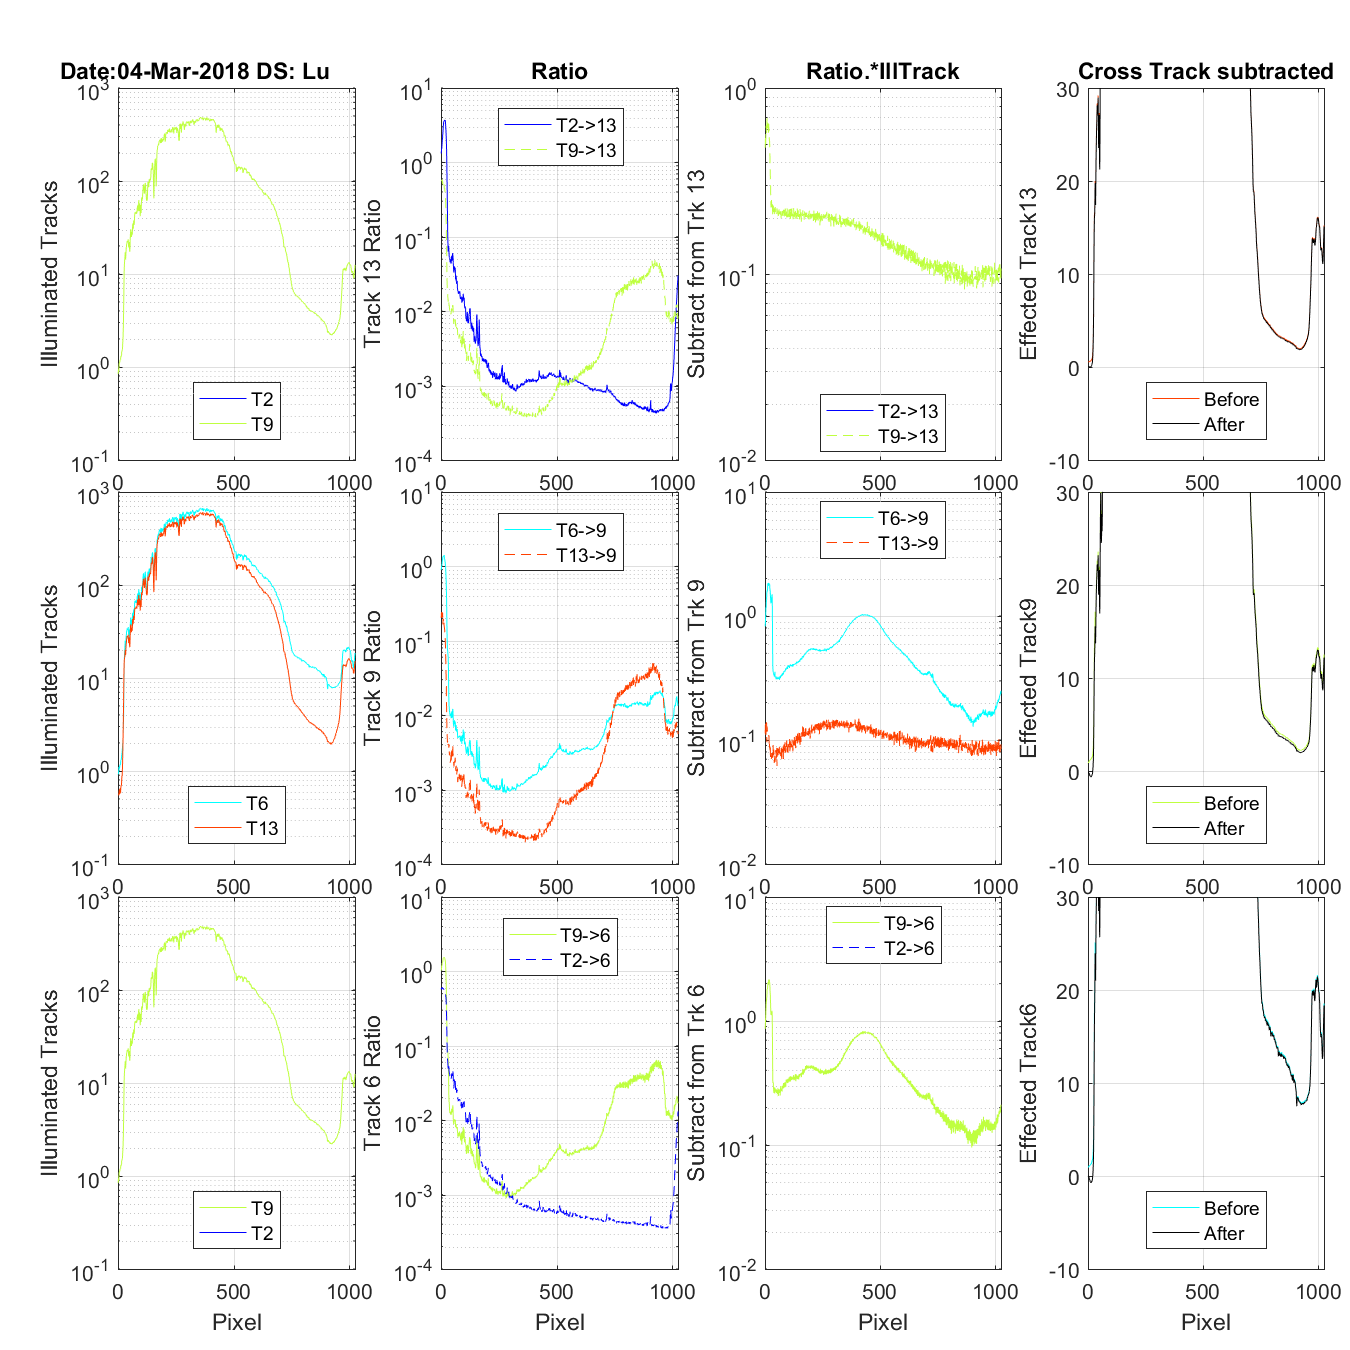
Figure 60 The title on the first row tells the date and if this is an Es/Lu data set (4 rows) or and Lu only data set (3 rows). The first column of graphs shows the tracks that are contaminating the track being corrected (Track in the last column). One of the tracks show in the first column is the mirror tracks causing UV ghosting problems the other is the closest track contamination with regular cross track light. The second column shows the UV or Cross track ratio for the contaminating tracks. The third column is the multiplication of the contaminating track and its ratio. The fourth column is the track being corrected. Before is the original data and after once the cross and UN ghosting contamination is removed. FYI: In the case of the Lu only data on column 2 you wil see the Es track shows as a ratio. But because there is no Es data it is not in any other column.
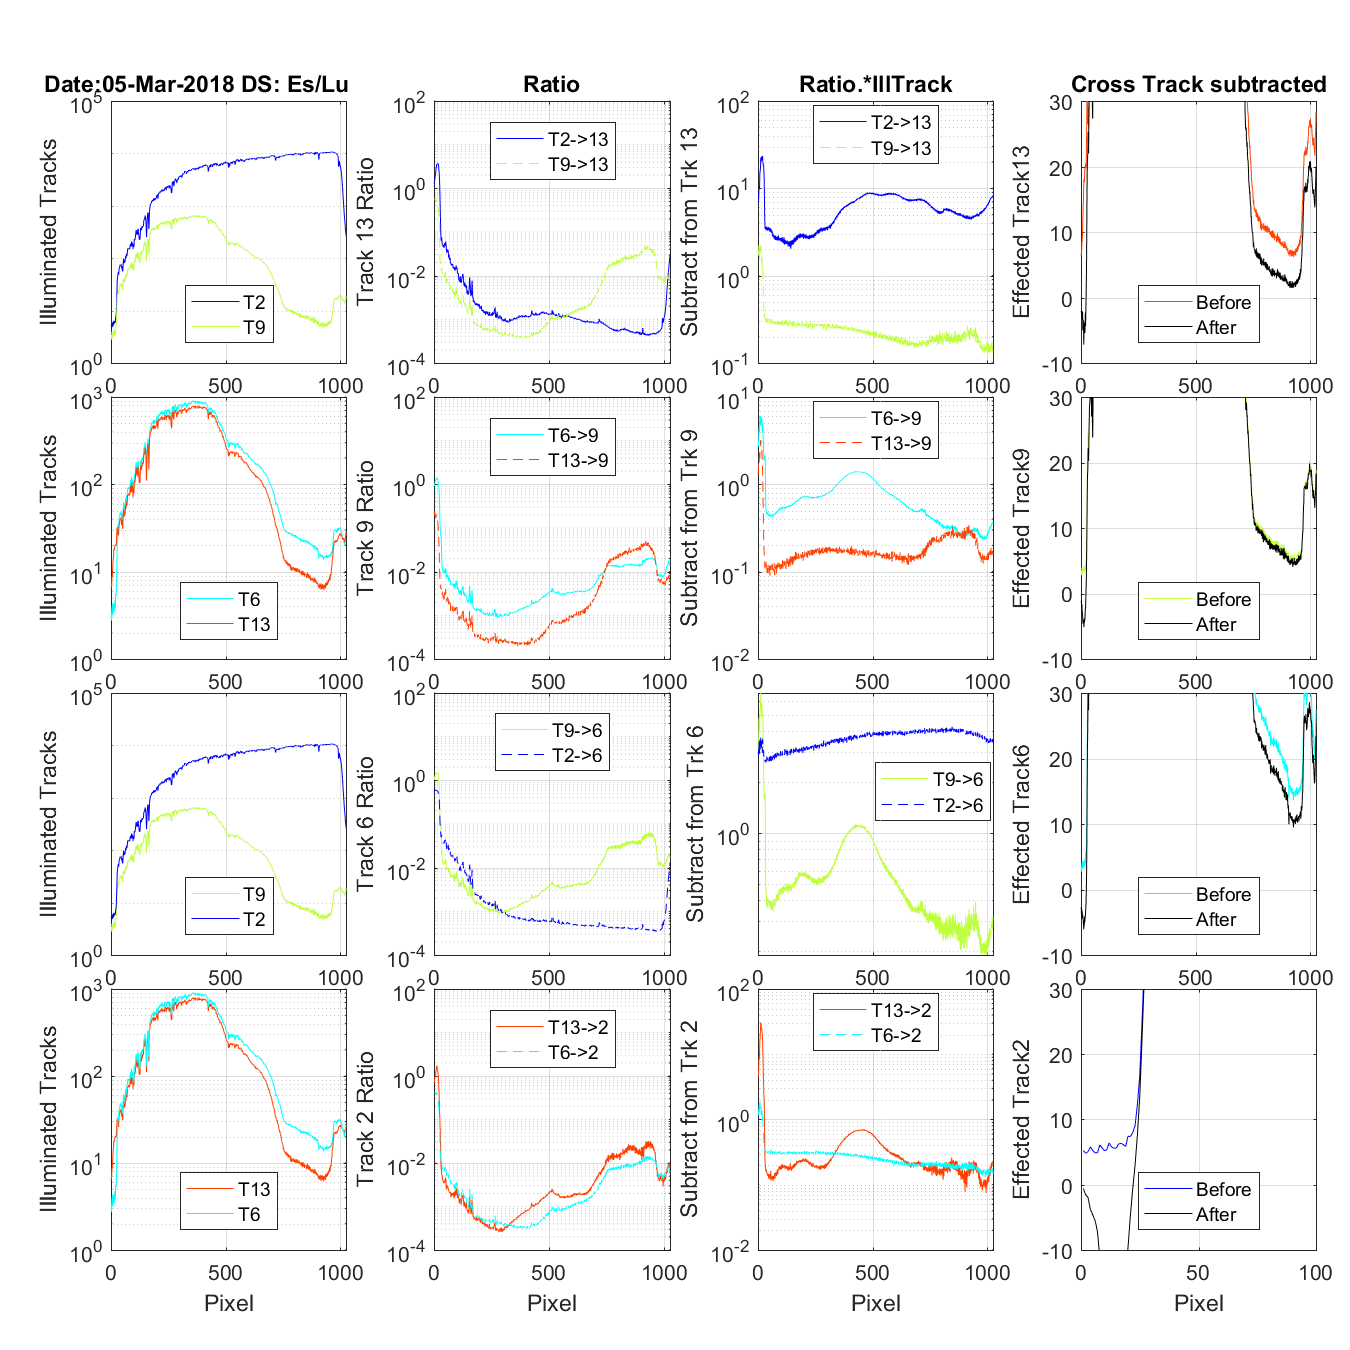
Figure 61 The title on the first row tells the date and if this is an Es/Lu data set (4 rows) or and Lu only data set (3 rows). The first column of graphs shows the tracks that are contaminating the track being corrected (Track in the last column). One of the tracks show in the first column is the mirror tracks causing UV ghosting problems the other is the closest track contamination with regular cross track light. The second column shows the UV or Cross track ratio for the contaminating tracks. The third column is the multiplication of the contaminating track and its ratio. The fourth column is the track being corrected. Before is the original data and after once the cross and UN ghosting contamination is removed. FYI: In the case of the Lu only data on column 2 you wil see the Es track shows as a ratio. But because there is no Es data it is not in any other column.
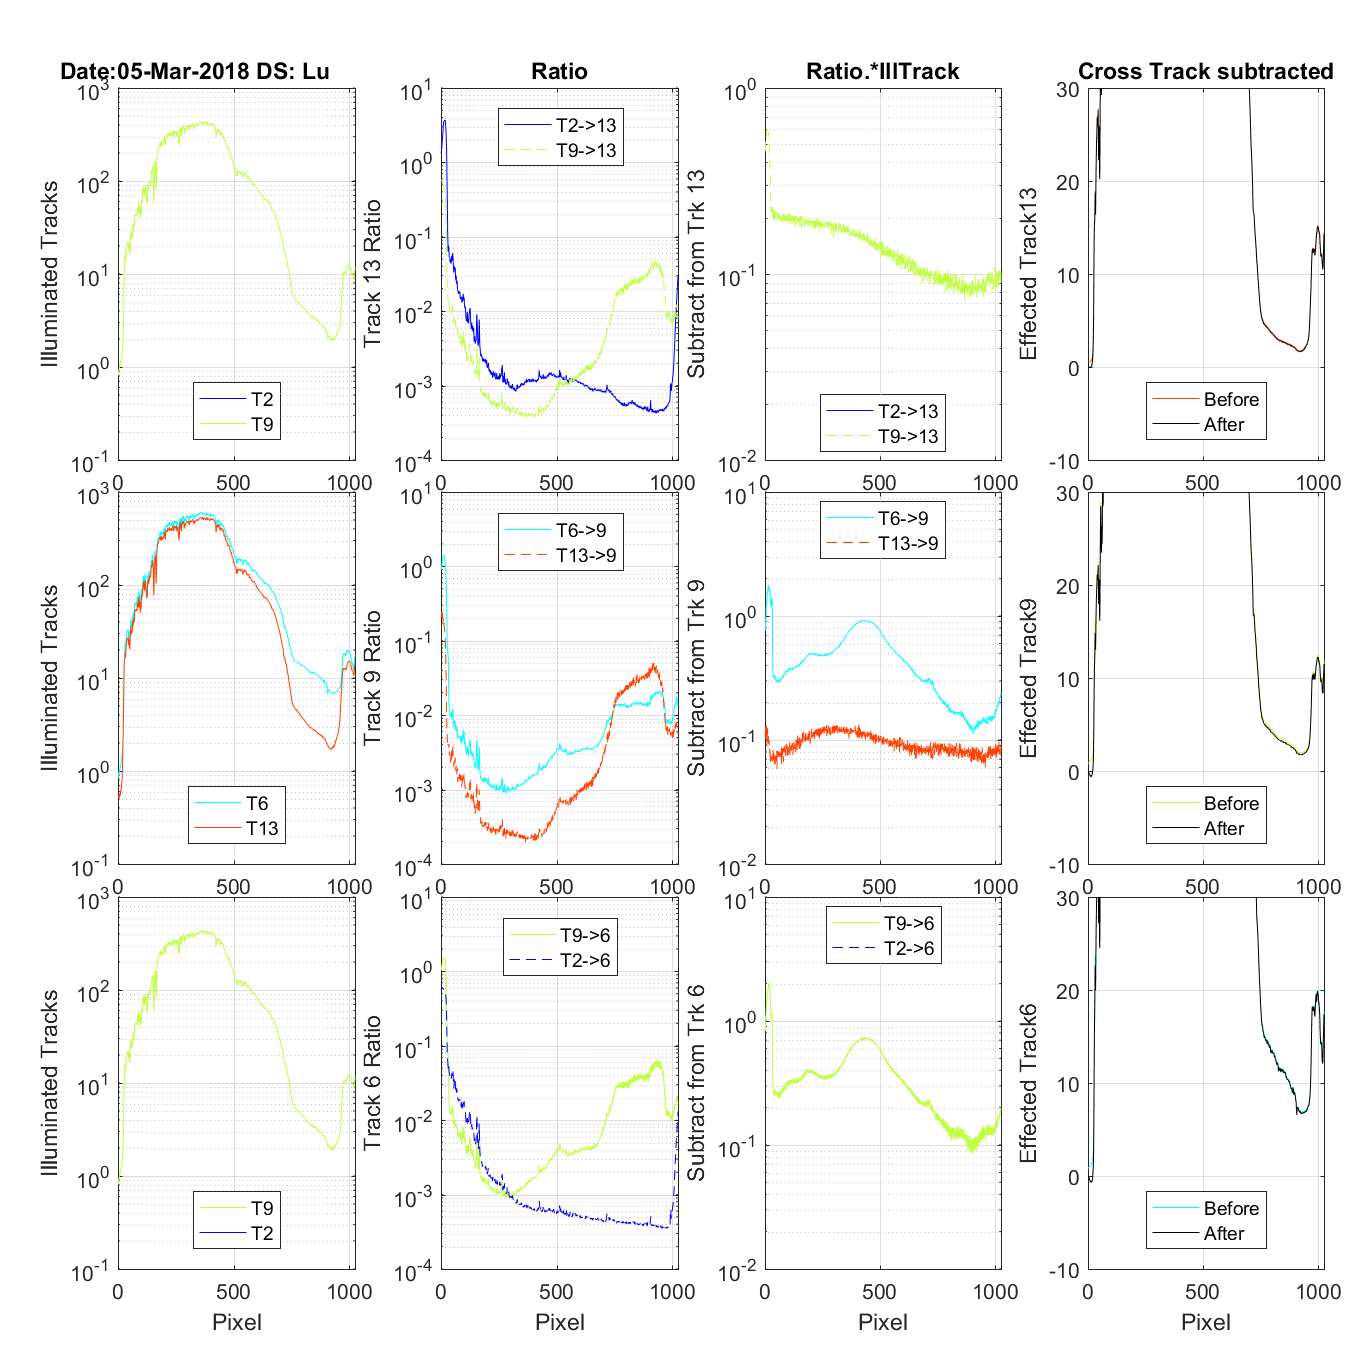
Figure 62 The title on the first row tells the date and if this is an Es/Lu data set (4 rows) or and Lu only data set (3 rows). The first column of graphs shows the tracks that are contaminating the track being corrected (Track in the last column). One of the tracks show in the first column is the mirror tracks causing UV ghosting problems the other is the closest track contamination with regular cross track light. The second column shows the UV or Cross track ratio for the contaminating tracks. The third column is the multiplication of the contaminating track and its ratio. The fourth column is the track being corrected. Before is the original data and after once the cross and UN ghosting contamination is removed. FYI: In the case of the Lu only data on column 2 you wil see the Es track shows as a ratio. But because there is no Es data it is not in any other column.
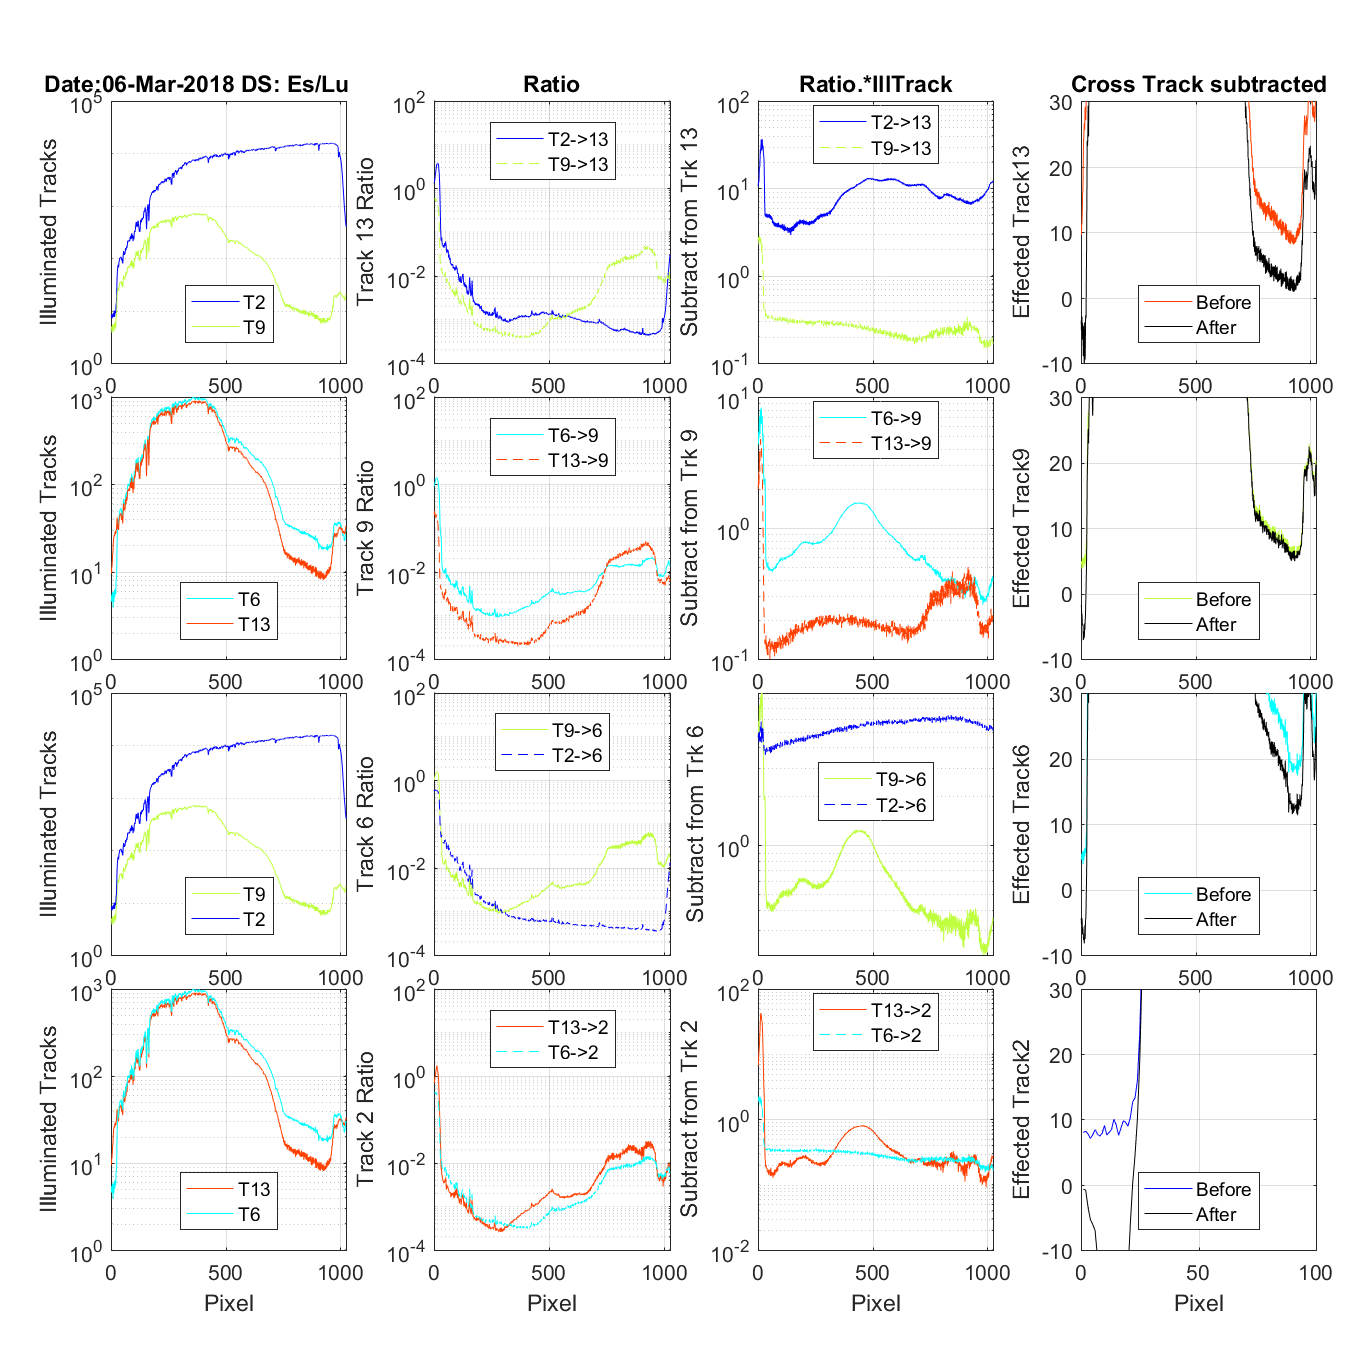
Figure 63 The title on the first row tells the date and if this is an Es/Lu data set (4 rows) or and Lu only data set (3 rows). The first column of graphs shows the tracks that are contaminating the track being corrected (Track in the last column). One of the tracks show in the first column is the mirror tracks causing UV ghosting problems the other is the closest track contamination with regular cross track light. The second column shows the UV or Cross track ratio for the contaminating tracks. The third column is the multiplication of the contaminating track and its ratio. The fourth column is the track being corrected. Before is the original data and after once the cross and UN ghosting contamination is removed. FYI: In the case of the Lu only data on column 2 you wil see the Es track shows as a ratio. But because there is no Es data it is not in any other column.
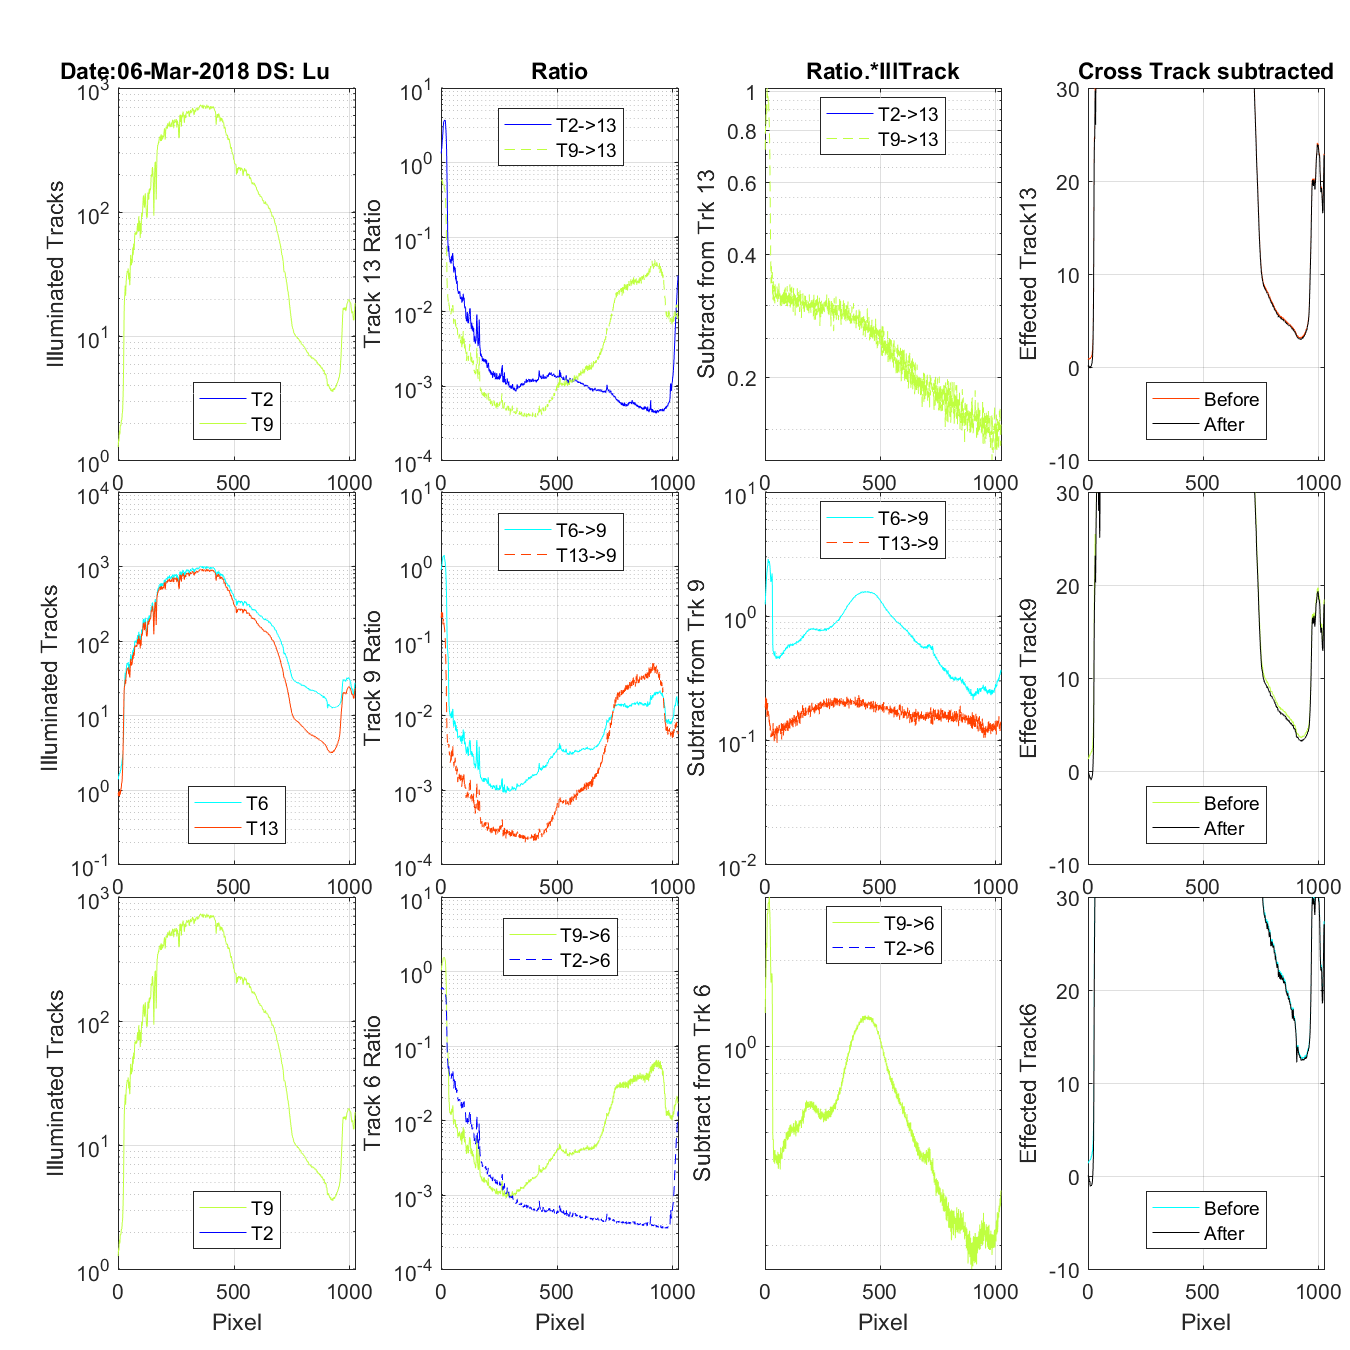
Figure 64 The title on the first row tells the date and if this is an Es/Lu data set (4 rows) or and Lu only data set (3 rows). The first column of graphs shows the tracks that are contaminating the track being corrected (Track in the last column). One of the tracks show in the first column is the mirror tracks causing UV ghosting problems the other is the closest track contamination with regular cross track light. The second column shows the UV or Cross track ratio for the contaminating tracks. The third column is the multiplication of the contaminating track and its ratio. The fourth column is the track being corrected. Before is the original data and after once the cross and UN ghosting contamination is removed. FYI: In the case of the Lu only data on column 2 you wil see the Es track shows as a ratio. But because there is no Es data it is not in any other column.
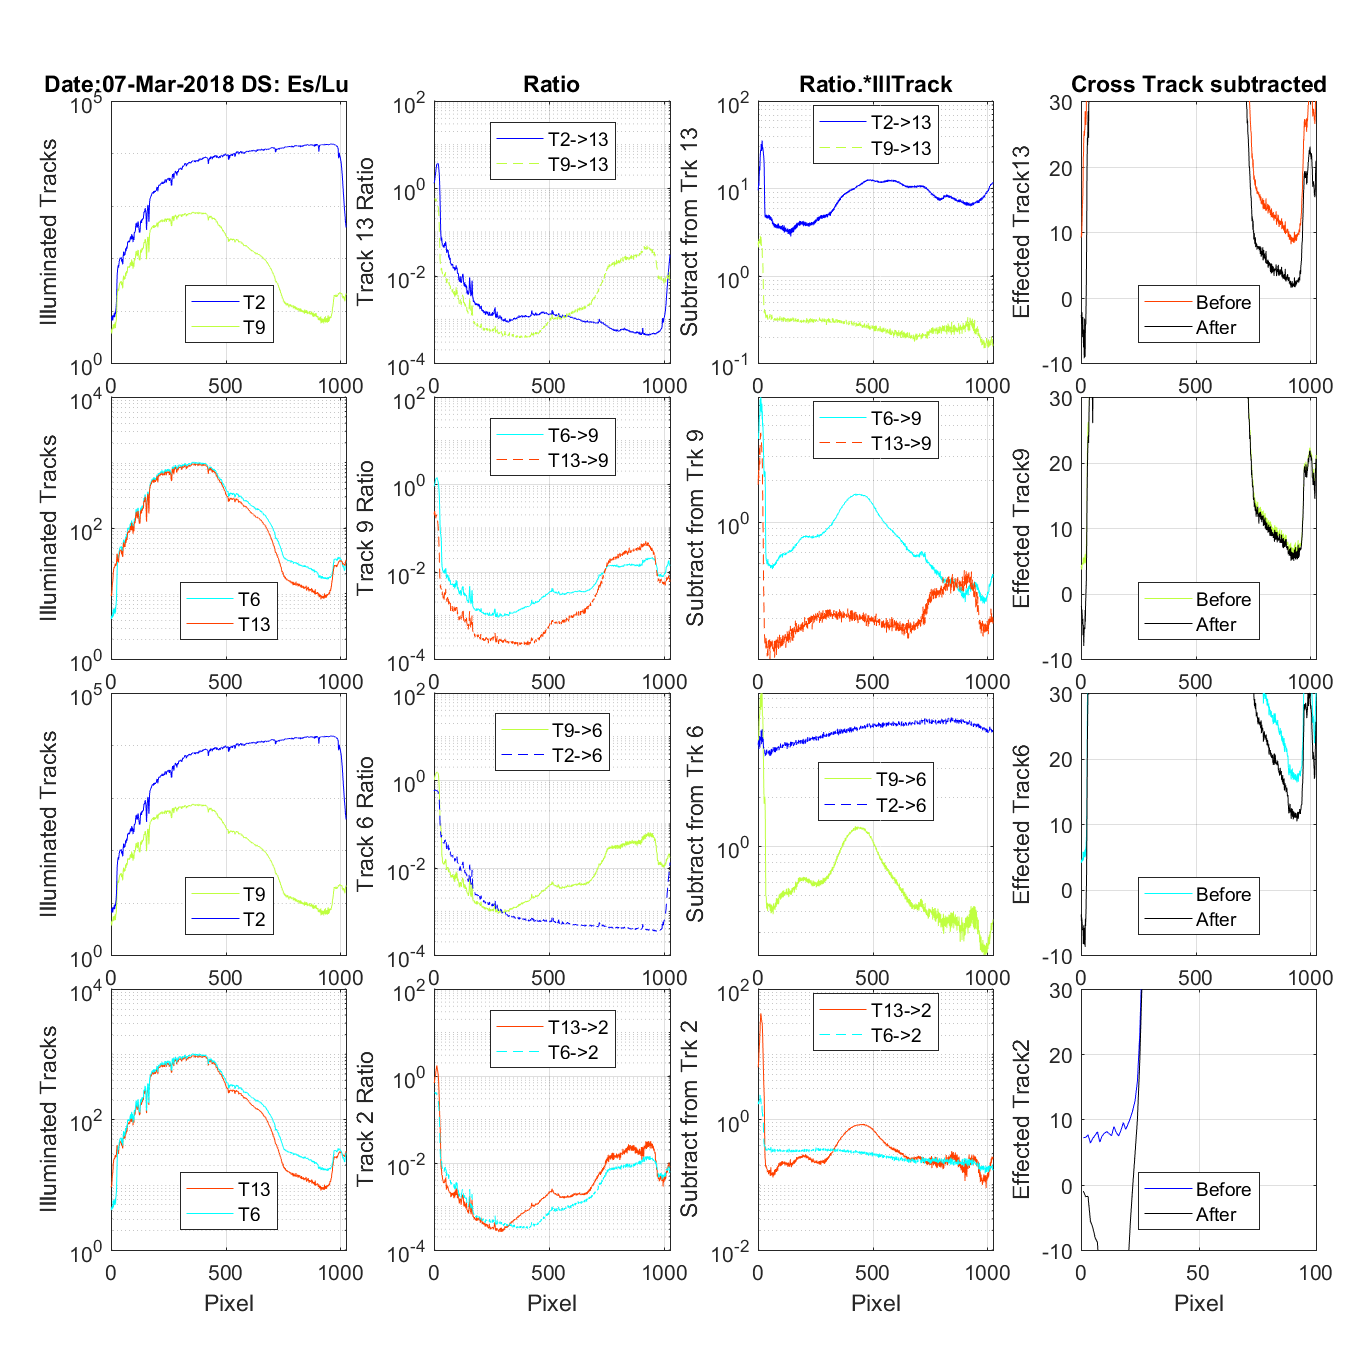
Figure 65 The title on the first row tells the date and if this is an Es/Lu data set (4 rows) or and Lu only data set (3 rows). The first column of graphs shows the tracks that are contaminating the track being corrected (Track in the last column). One of the tracks show in the first column is the mirror tracks causing UV ghosting problems the other is the closest track contamination with regular cross track light. The second column shows the UV or Cross track ratio for the contaminating tracks. The third column is the multiplication of the contaminating track and its ratio. The fourth column is the track being corrected. Before is the original data and after once the cross and UN ghosting contamination is removed. FYI: In the case of the Lu only data on column 2 you wil see the Es track shows as a ratio. But because there is no Es data it is not in any other column.
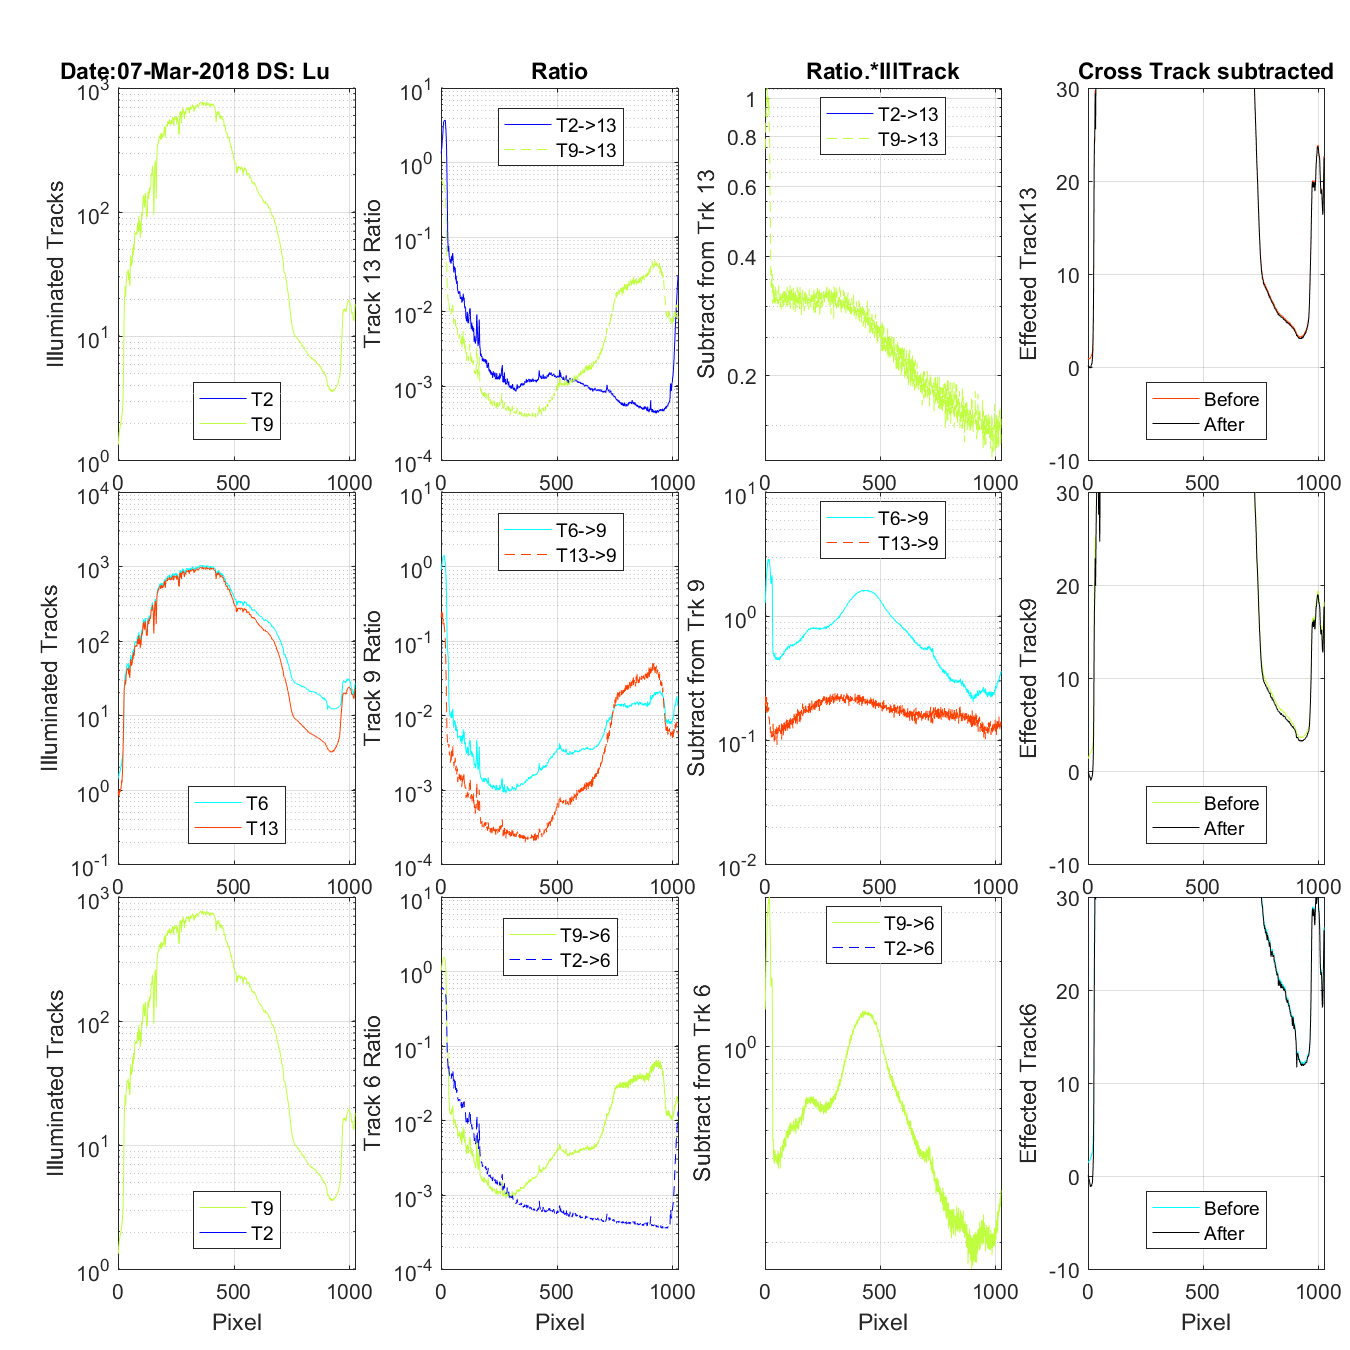
Figure 66 The title on the first row tells the date and if this is an Es/Lu data set (4 rows) or and Lu only data set (3 rows). The first column of graphs shows the tracks that are contaminating the track being corrected (Track in the last column). One of the tracks show in the first column is the mirror tracks causing UV ghosting problems the other is the closest track contamination with regular cross track light. The second column shows the UV or Cross track ratio for the contaminating tracks. The third column is the multiplication of the contaminating track and its ratio. The fourth column is the track being corrected. Before is the original data and after once the cross and UN ghosting contamination is removed. FYI: In the case of the Lu only data on column 2 you wil see the Es track shows as a ratio. But because there is no Es data it is not in any other column.

Figure 67 The title on the first row tells the date and if this is an Es/Lu data set (4 rows) or and Lu only data set (3 rows). The first column of graphs shows the tracks that are contaminating the track being corrected (Track in the last column). One of the tracks show in the first column is the mirror tracks causing UV ghosting problems the other is the closest track contamination with regular cross track light. The second column shows the UV or Cross track ratio for the contaminating tracks. The third column is the multiplication of the contaminating track and its ratio. The fourth column is the track being corrected. Before is the original data and after once the cross and UN ghosting contamination is removed. FYI: In the case of the Lu only data on column 2 you wil see the Es track shows as a ratio. But because there is no Es data it is not in any other column.

Figure 68 The title on the first row tells the date and if this is an Es/Lu data set (4 rows) or and Lu only data set (3 rows). The first column of graphs shows the tracks that are contaminating the track being corrected (Track in the last column). One of the tracks show in the first column is the mirror tracks causing UV ghosting problems the other is the closest track contamination with regular cross track light. The second column shows the UV or Cross track ratio for the contaminating tracks. The third column is the multiplication of the contaminating track and its ratio. The fourth column is the track being corrected. Before is the original data and after once the cross and UN ghosting contamination is removed. FYI: In the case of the Lu only data on column 2 you wil see the Es track shows as a ratio. But because there is no Es data it is not in any other column.