REVISION DATE: 19-Apr-2019 13:45:14
Orientation modules graphs. Negative pitch would be tilting the arms downward. Negative roll would be rotating the buoy clockwise when facing the same way as the arms. Marks MOBY X and Y tilt definitions from an 2009 email: X is the most in line with the arms. +X = arms tilting up. + Y = buoy tilt to the left when facing the arms head on. The tilt planes are also rotated relative to the plane of the arms. Looking down on the buoy from above, the arms are rotated clockwize relative to the X plane. It is the same number as the compass I think it is 15 deg. So best I can tell the pitch = MOBY x-tilt and roll = MOBY y-tilt. According to Mikes drawing the OM modules is lined up with the arms. So there is a ~15 degree difference in where the two are pointed.
The bottom of the OM modules relative to the chime is 9.8639 meters (double check that mikes measurement is to bottom of OM). I am assuming the pressure sensor is on the bottom of the OM.
ASCII log file: 20190410_001432.log
| Start Time | Length (sec) | Roll (deg) Mean / std |
Pitch (deg) Mean / std |
Tilt (deg) Mean / std |
Azimuth (deg) Mean / std |
Pressure (bar) Mean / std |
Depth (m) - Lanai Mean / std |
|---|---|---|---|---|---|---|---|
| 10-Apr-2019 00:14:32 | 312.5 | -0.81197 / 2.0493 | -1.4198 / 1.7659 | 2.7755 / 1.5117 | 268.1298 / 3.1271 | 2.0062 / 0.0234 | NaN / NaN |
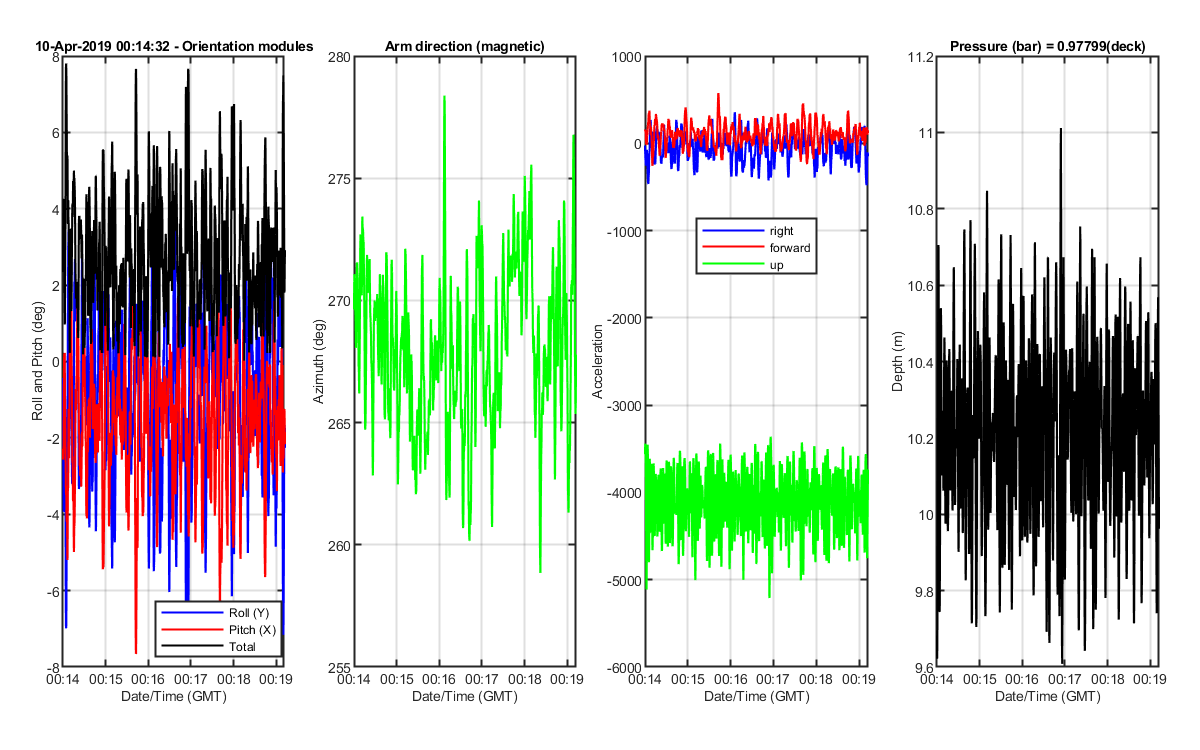
Figure 1: Each of the orientation modules data sets. Date/Time on the x-axis is my guess at getting a date/time. I think I heard someone say the file is ~5 minutes worth of data. Im assuming we are taking 8 samples a second. With 300 samples that gets us about 5 minutes of data.
The pressure in bars is converted to depth in meters using the UNESCO Tech Paper Mar Sci 44 (1983), Latitude is 21 degrees North. There is on surface or "deck" pressures used to get depth. The Matlab code to convert is Z = depth_(10.*(PRESSURE-DECKPRESSURE),21); The Dck Press (Deck Pressure) is the mean untilted pressures from the Marks data collected at home.
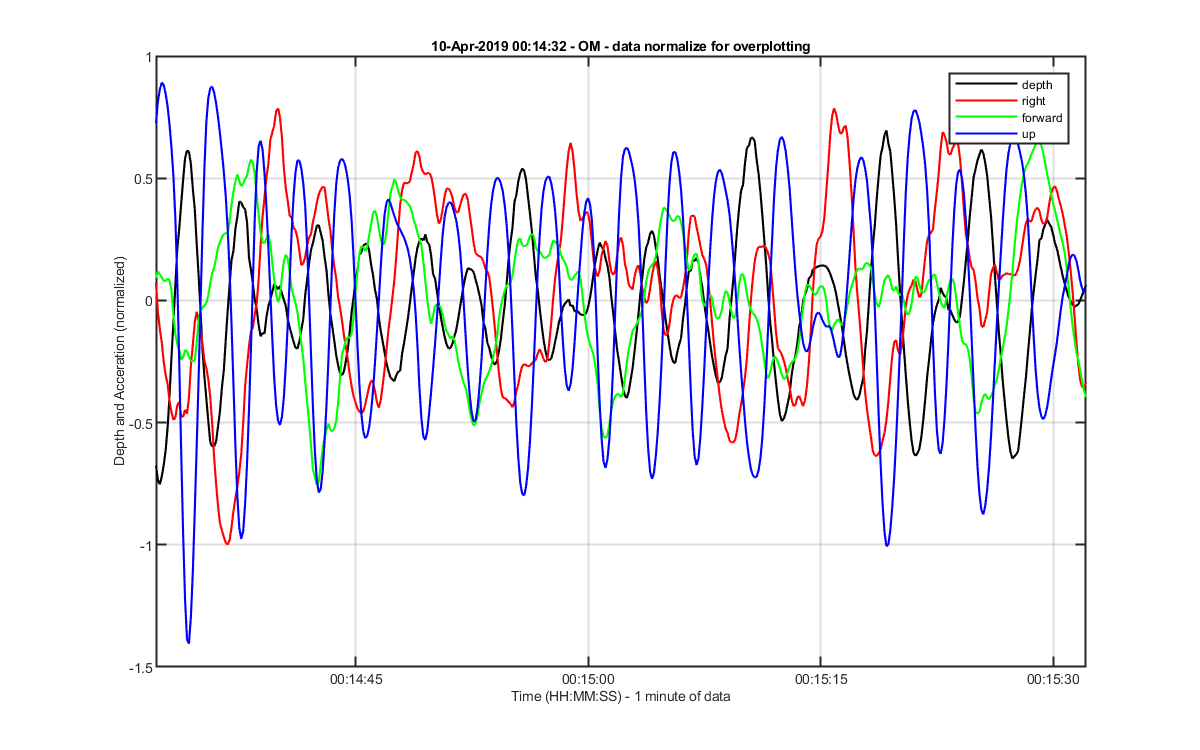
Figure 2: The three acceleration variables and depth plotted normalized so they are overplotted on a similar scale. The depth and up accelaration are 180 degrees out of phase. As the buoy accelerates up the depth descreases. It might be helpful to correct the depth for the acceleration.
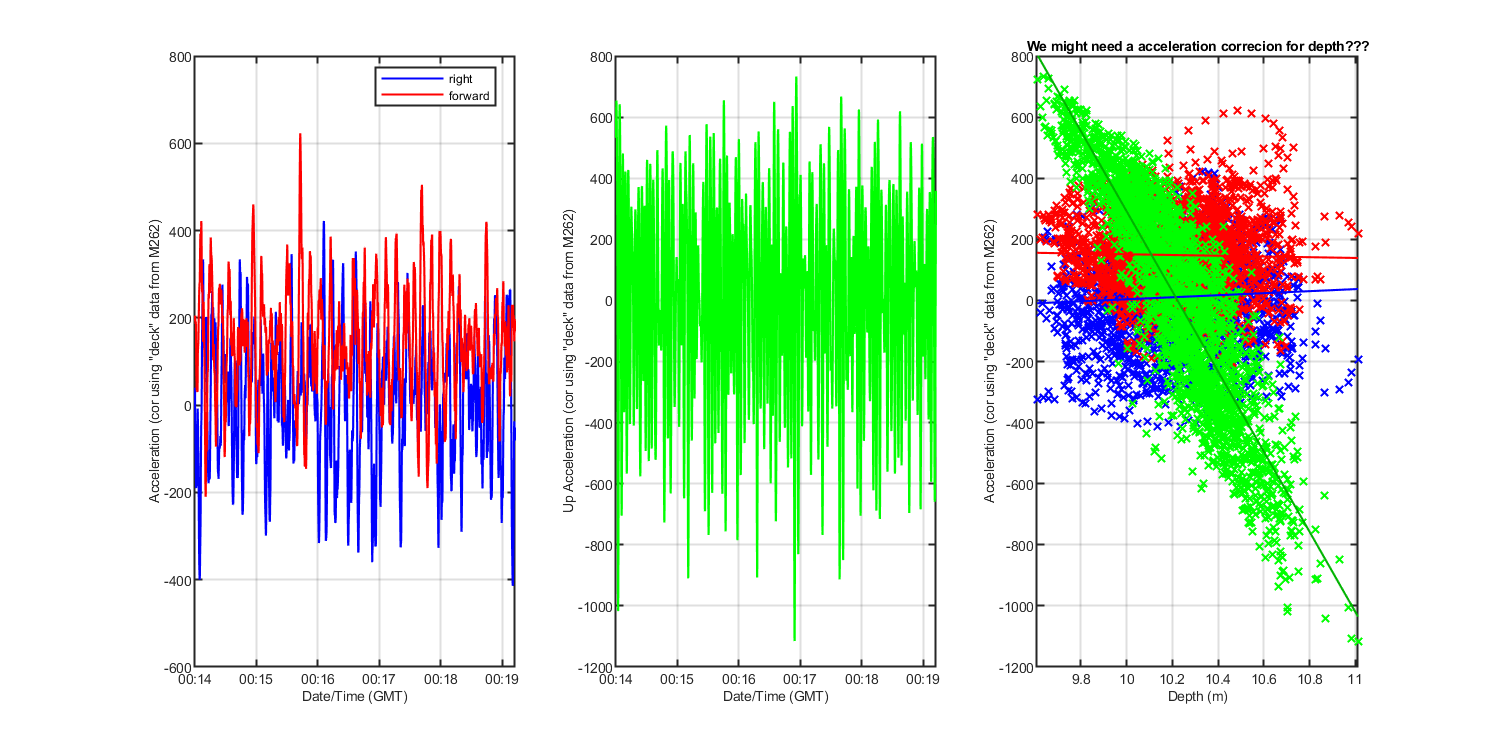
Figure 3: The left graphs shows the acceleration data with the "desk" measurement suptracted. This corrects the acceleration data for the static acceleration (earths gravity) component in each axis. Need to study this more and made sure I did this right. Also need "deak" measurements, I used the M262 desk test for this. The right graph show the relationship between the accelerations and depth. The Up acceleration has a strong negative relationship with depth.
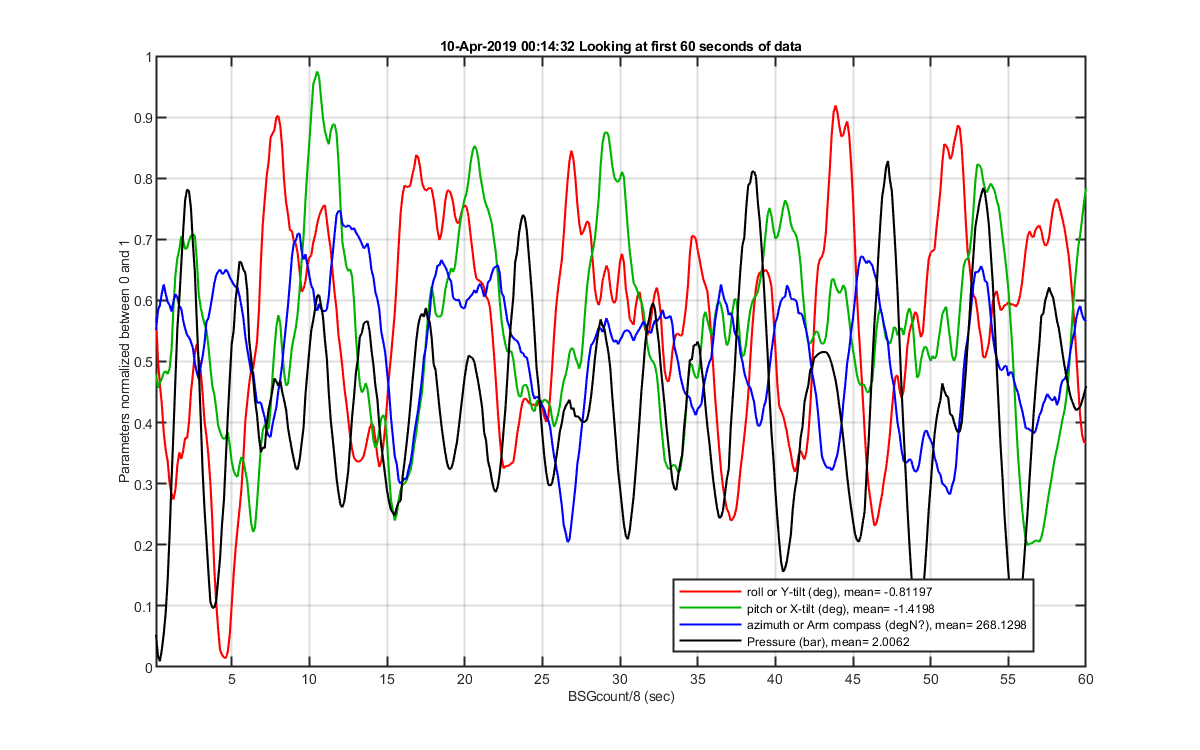
Figure 4: OM modules and the closest MOBY file. The MOBY compas data are corrected (although no cals have been done to confirm the corrections) and the OM data are not. The MOBY depth data plotted are from the MOS sensor. The even buoys data are not correct but I thought it could give an idea of the up and down movement even if the actual number is wrong.
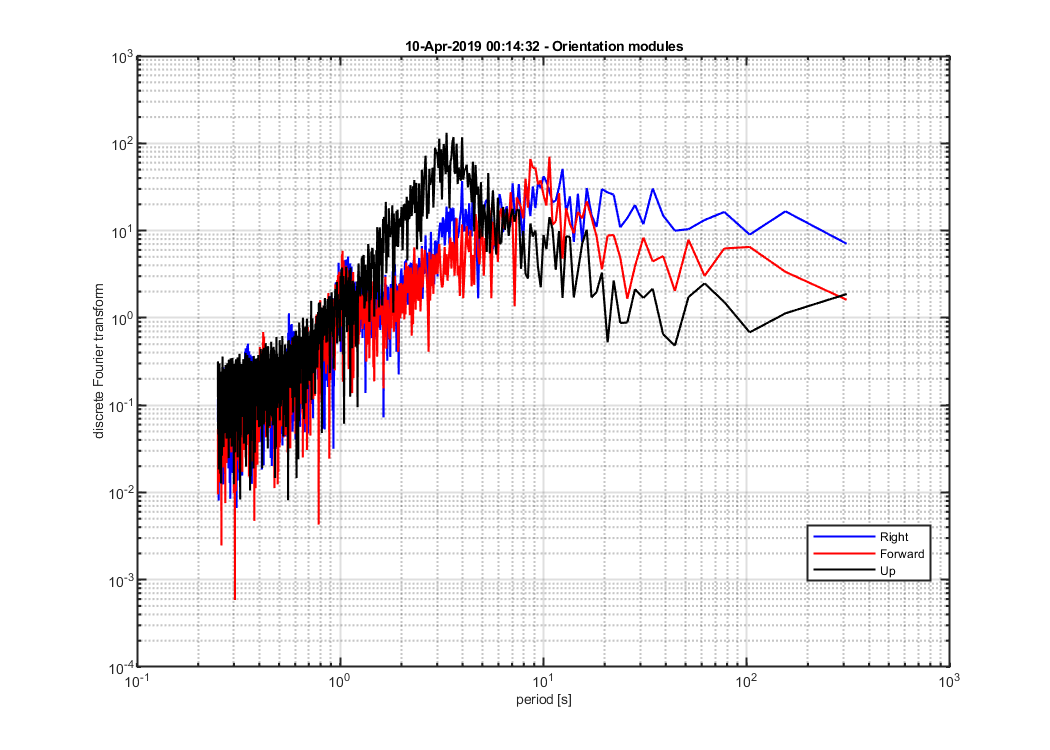
Figure 5