REVISION DATE: 09-May-2016 14:16:35
Part of an Email from Mike Kehoe on 1/28/2016 3:03 PM: Casey has checked over the blue system (BS2) following the shake/stability test. Results are materially unchanged from the report of January 12th. The updated data is on our site, per Caseys instructions below. We plan to ship this unit to Hawaii on Monday via the usual shipping channel.
MIKES EMAIL ------------------
I looked at the NIST Atomic Spectra Database for Helium lines (in-air, nm)
( http://www.nist.gov/pml/data/asd.cfm, "Lines", "He I, 500 to 1000 nm" )
Casey send five bip files (moby_blue_dark_100ms.bip moby_blue_helium_100ms.bip moby_blue_radiance.bip moby_blue_dark_500ms.bip moby_blue_helium_500ms.bip).
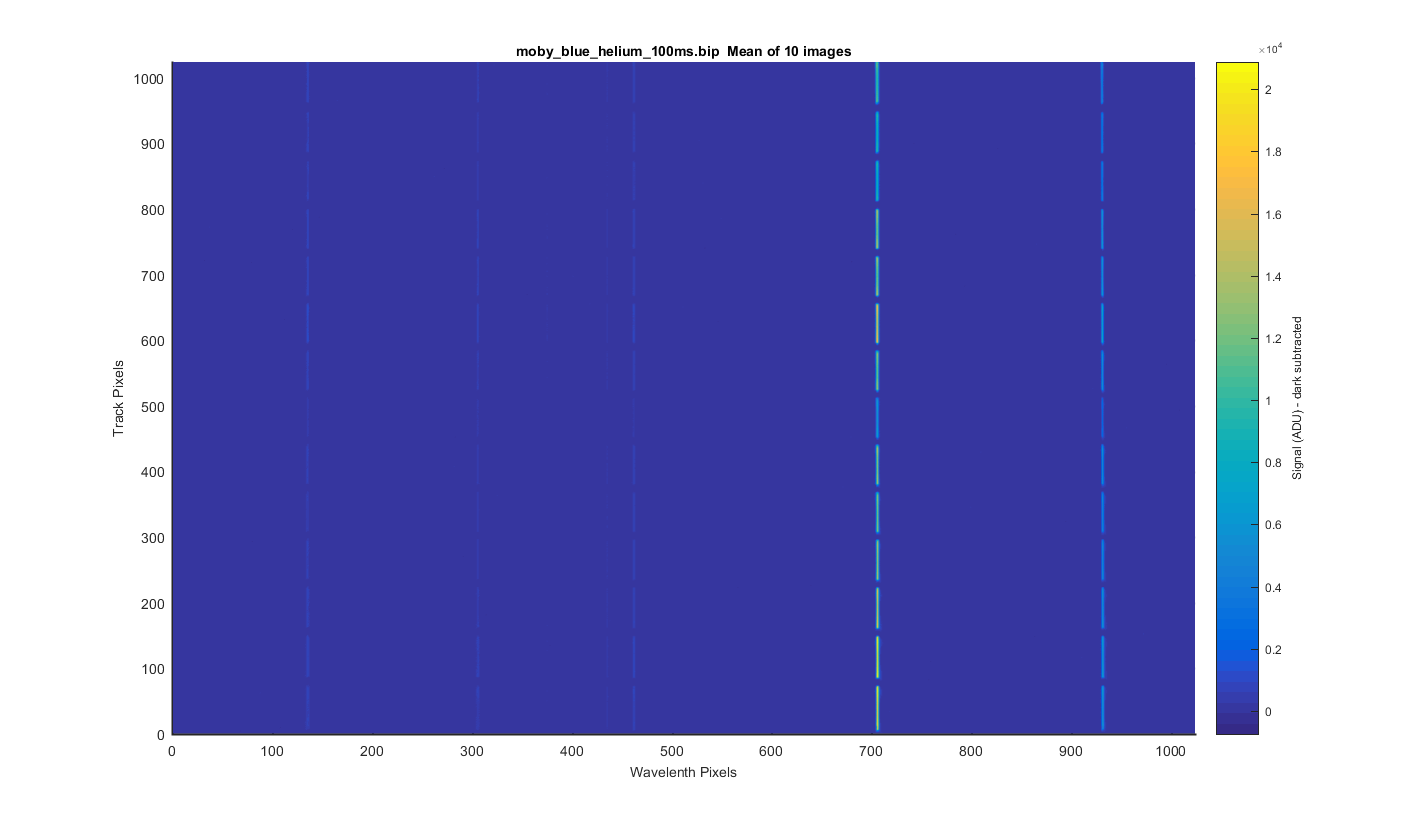
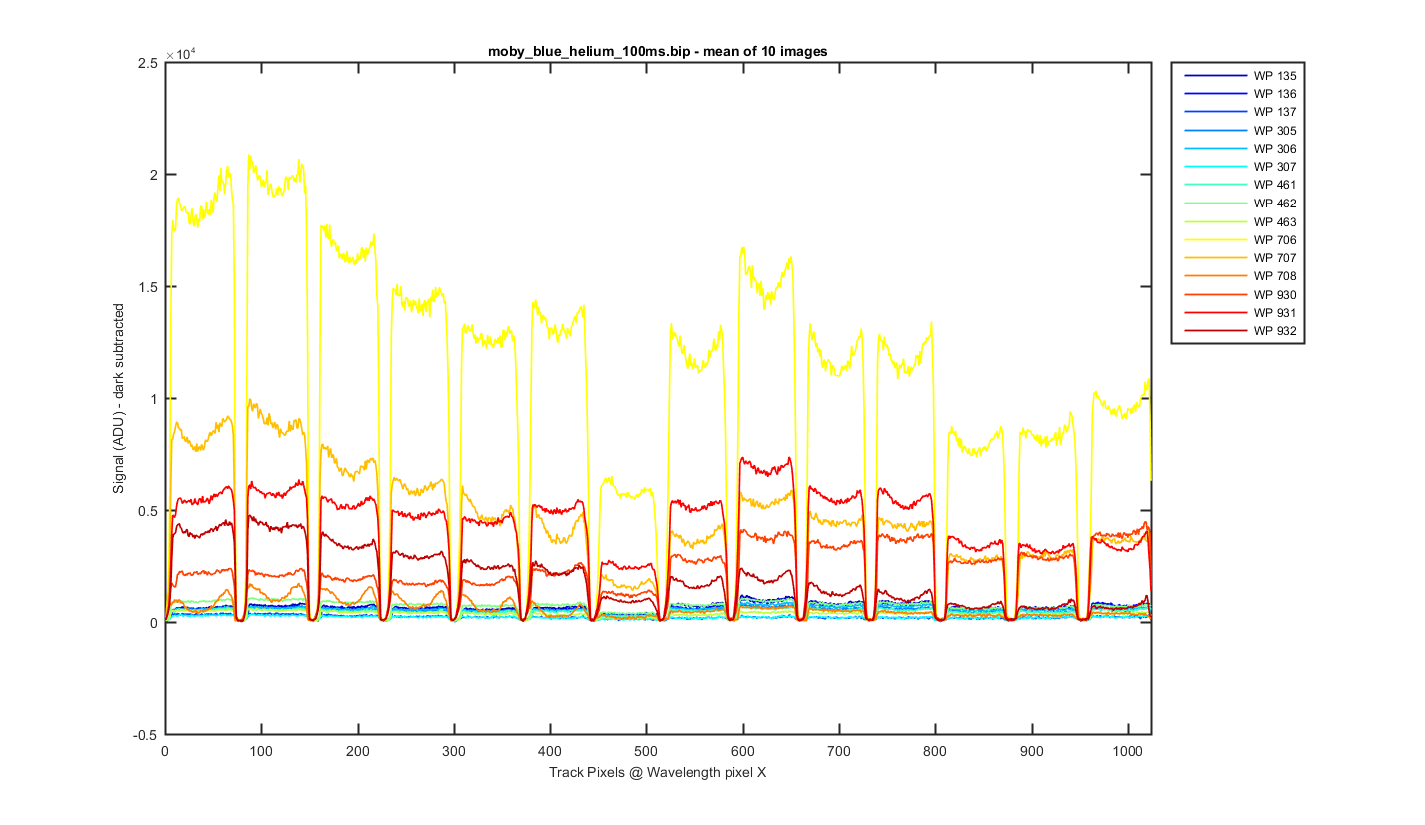
Below are my graphs of the moby_blue_helium_100ms.bip. The file contains 10 images of the helium lamp source. All the data are dark subtracted. See each graph below for more detail.
Resonon took dark scans for the two int times taken. So I meaned all the dark images for the 100ms data and subtracted it from the data before processing. I Then took the 10 images and meaned them to get the surface plot below.
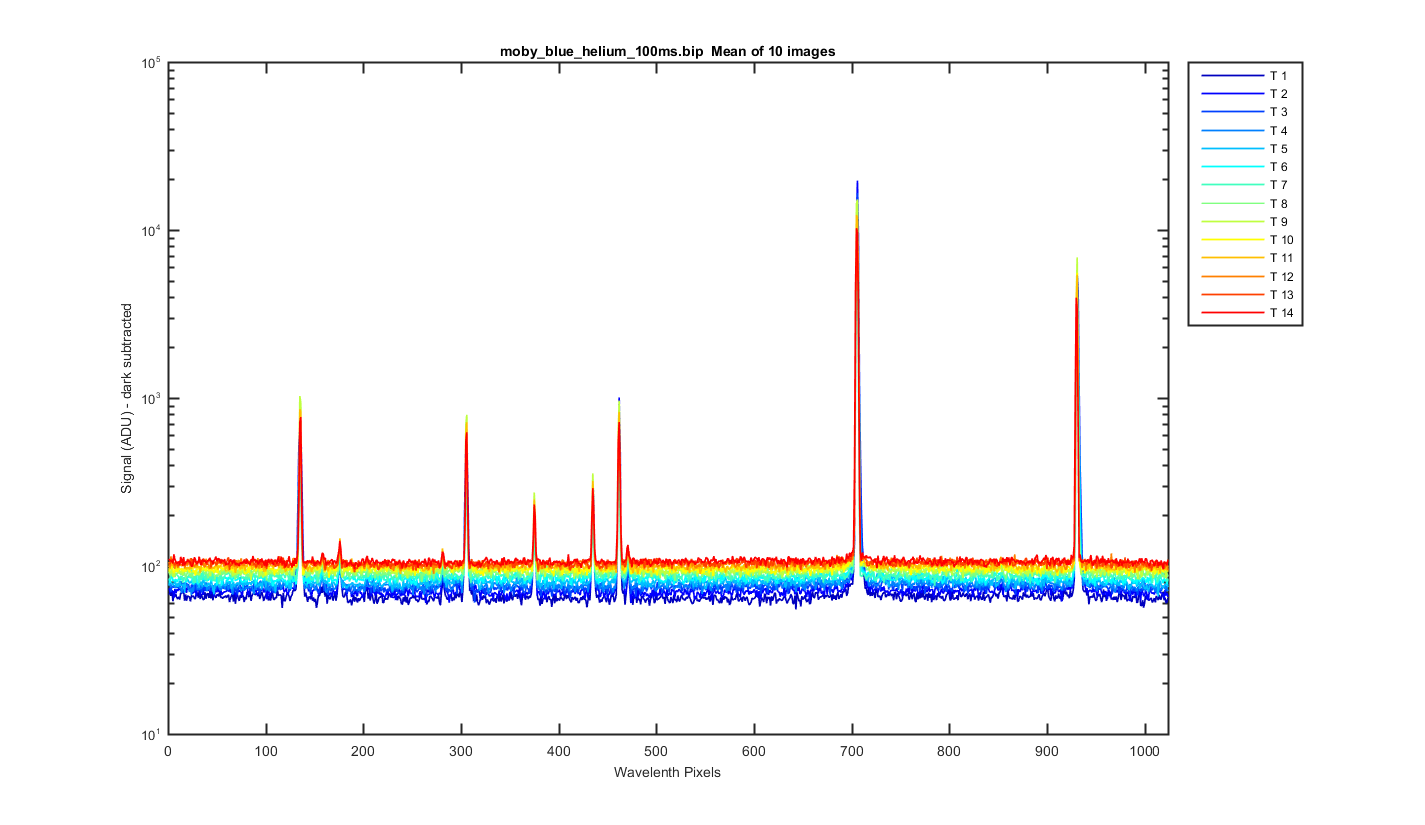
Figure 1
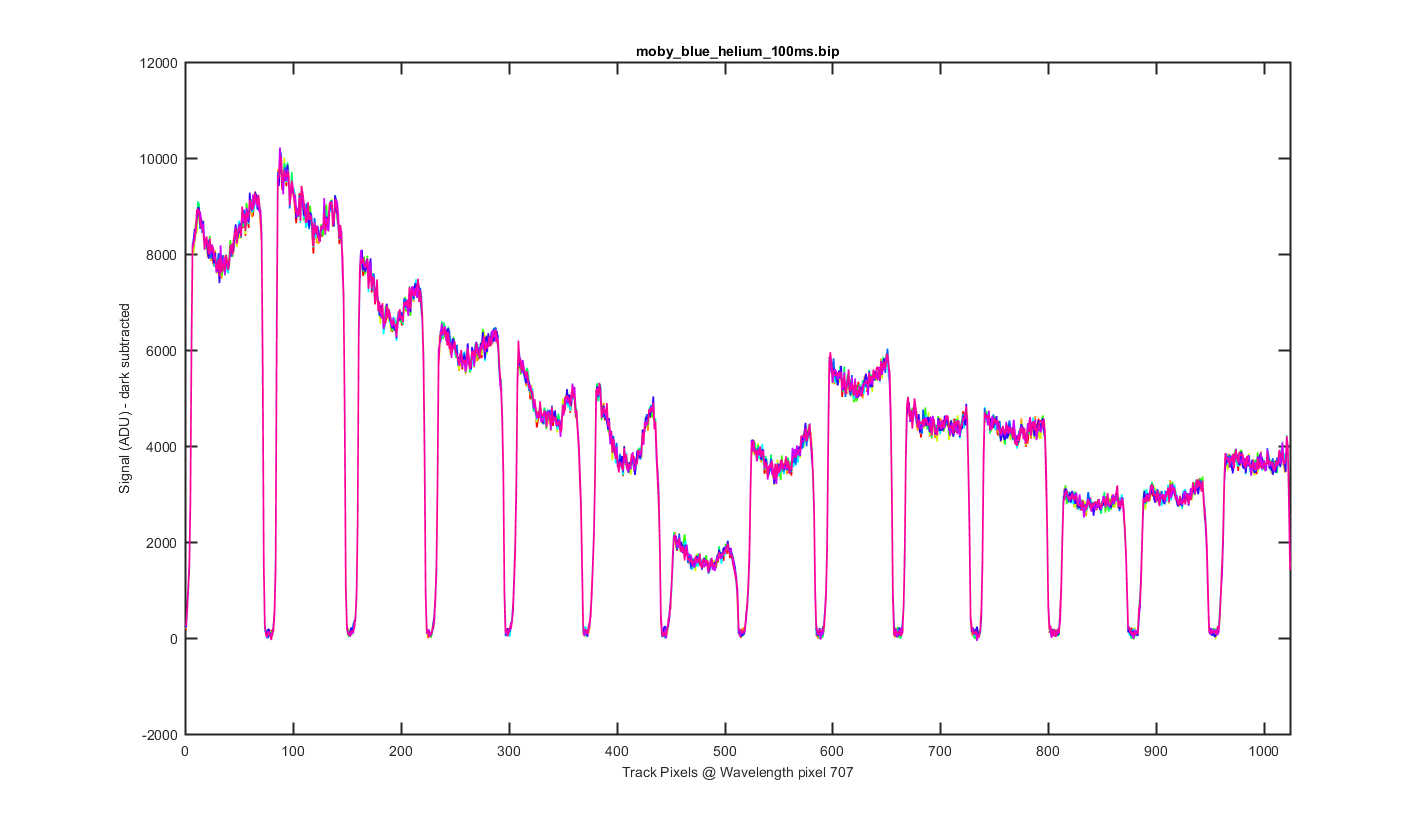
This is a cross section through the tracks at wavelength pixel 707, with one line for each of the 10 images. The tracks and their shapes look really stable.
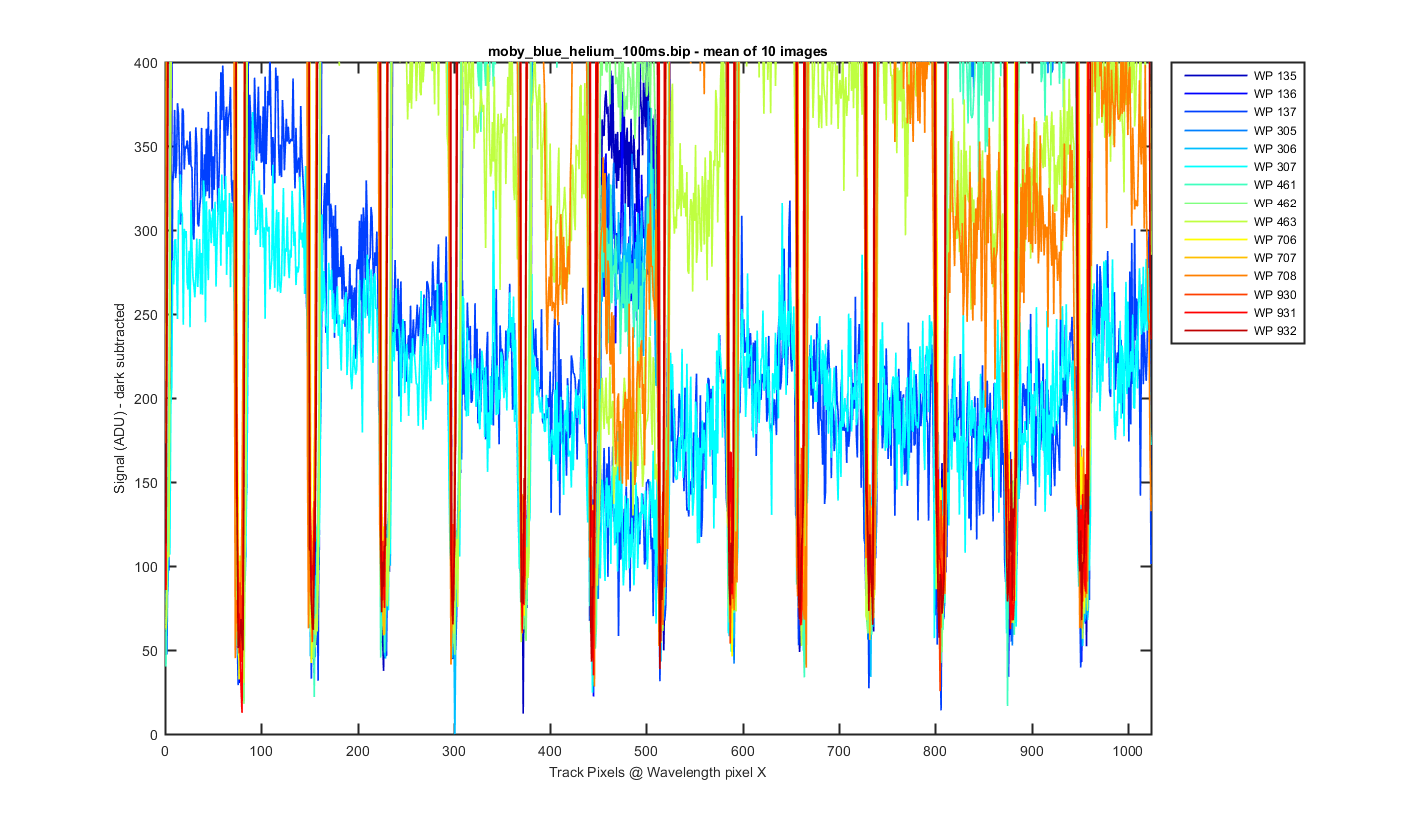
Figure 2
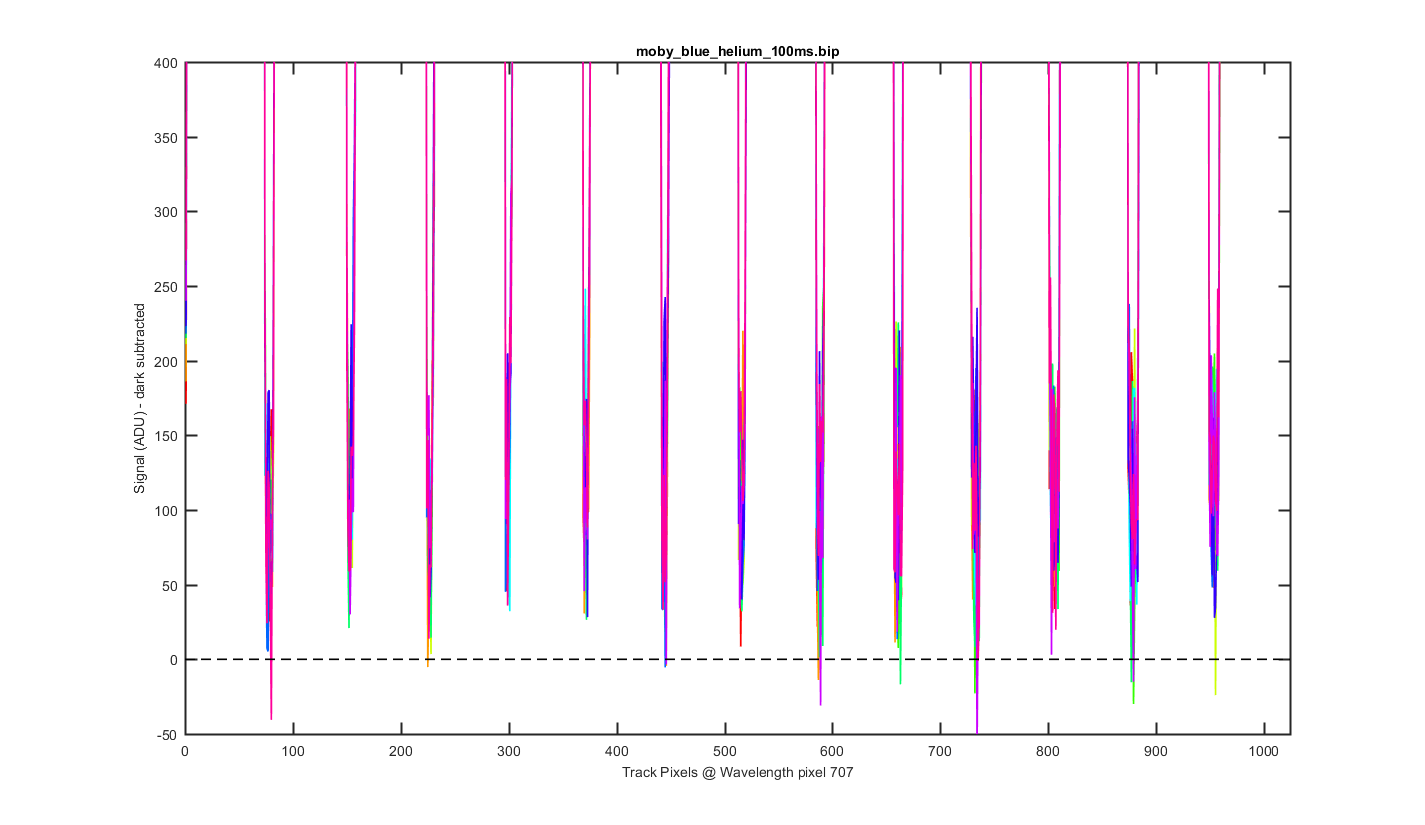
Same as the previous graph but zoomed into the bottom to see the level of the darks between the tracks.
Figure 3
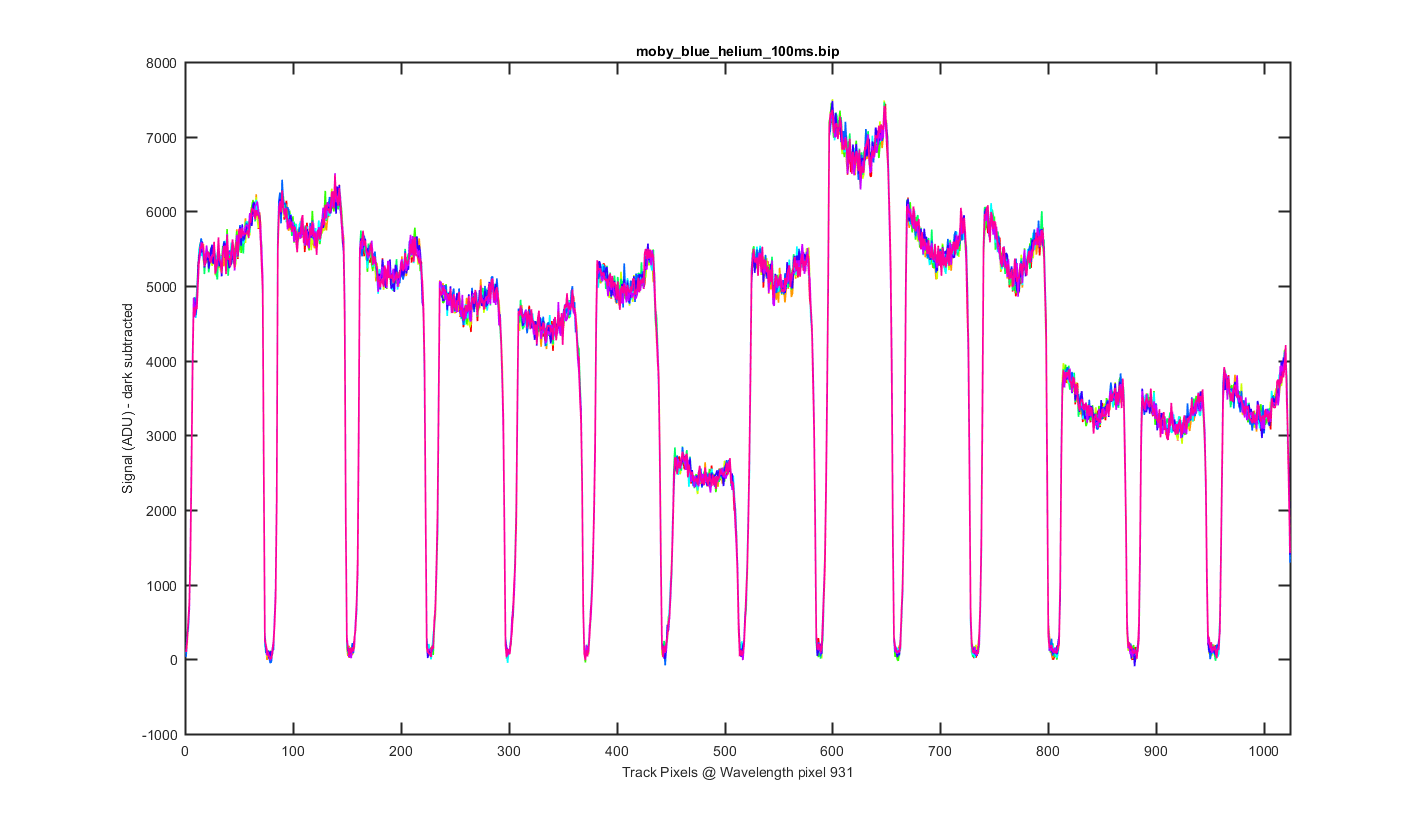
Same as figure 2 but for Wavelength pixel 931.
Figure 4
Again this is the mean image with slices thought the image at different wavelength pixels. The pixels choosen are where the helium peaks are and +- pixel pixel around them.
Figure 5
Same as figure 5 but zoomed to the bottom so you can see the darks between the tracks.
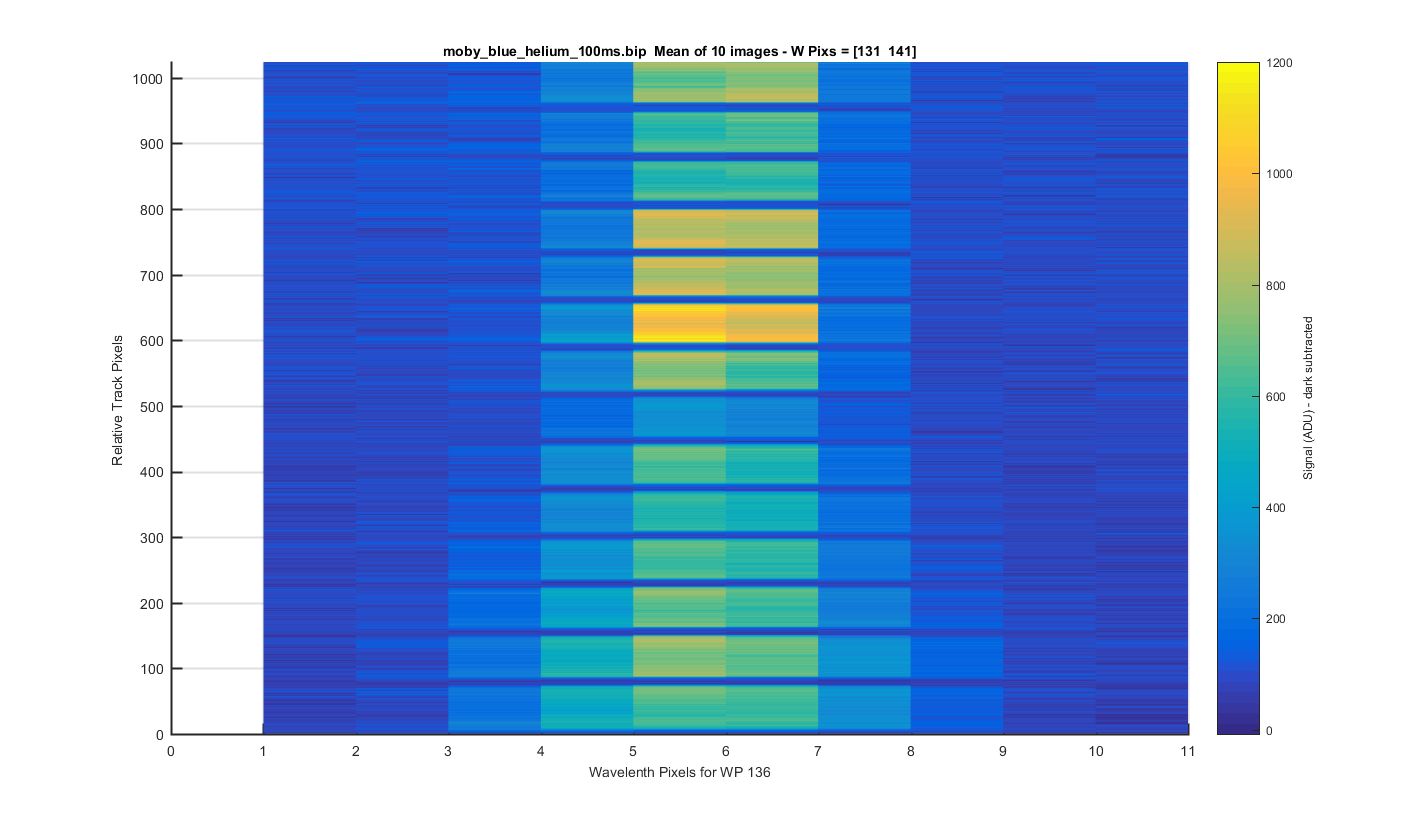
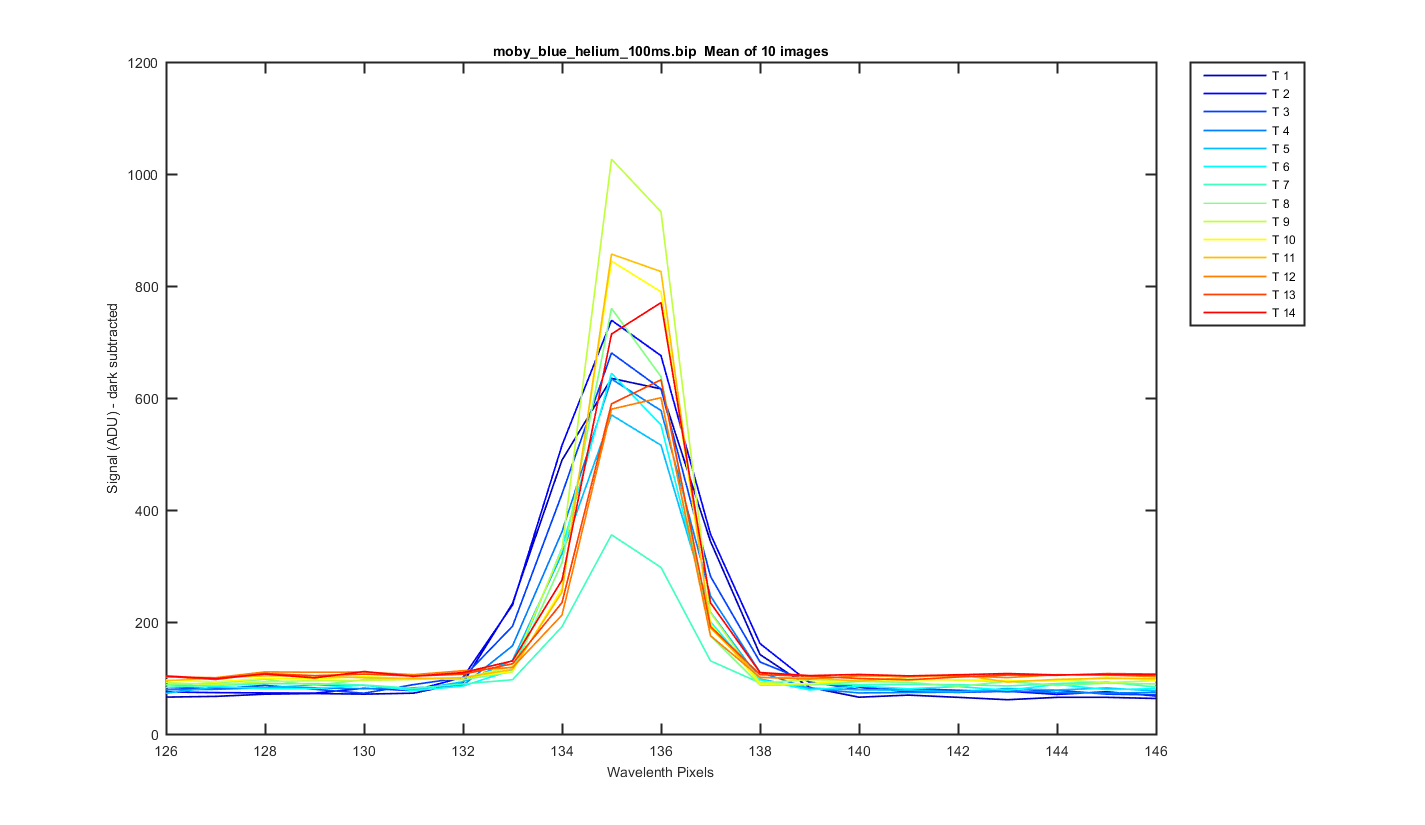
Figure 6
Helium Peak 1 (at pix 136): The same surface plot but showing how individual helium peaks line up from track to track. Looks pretty good!
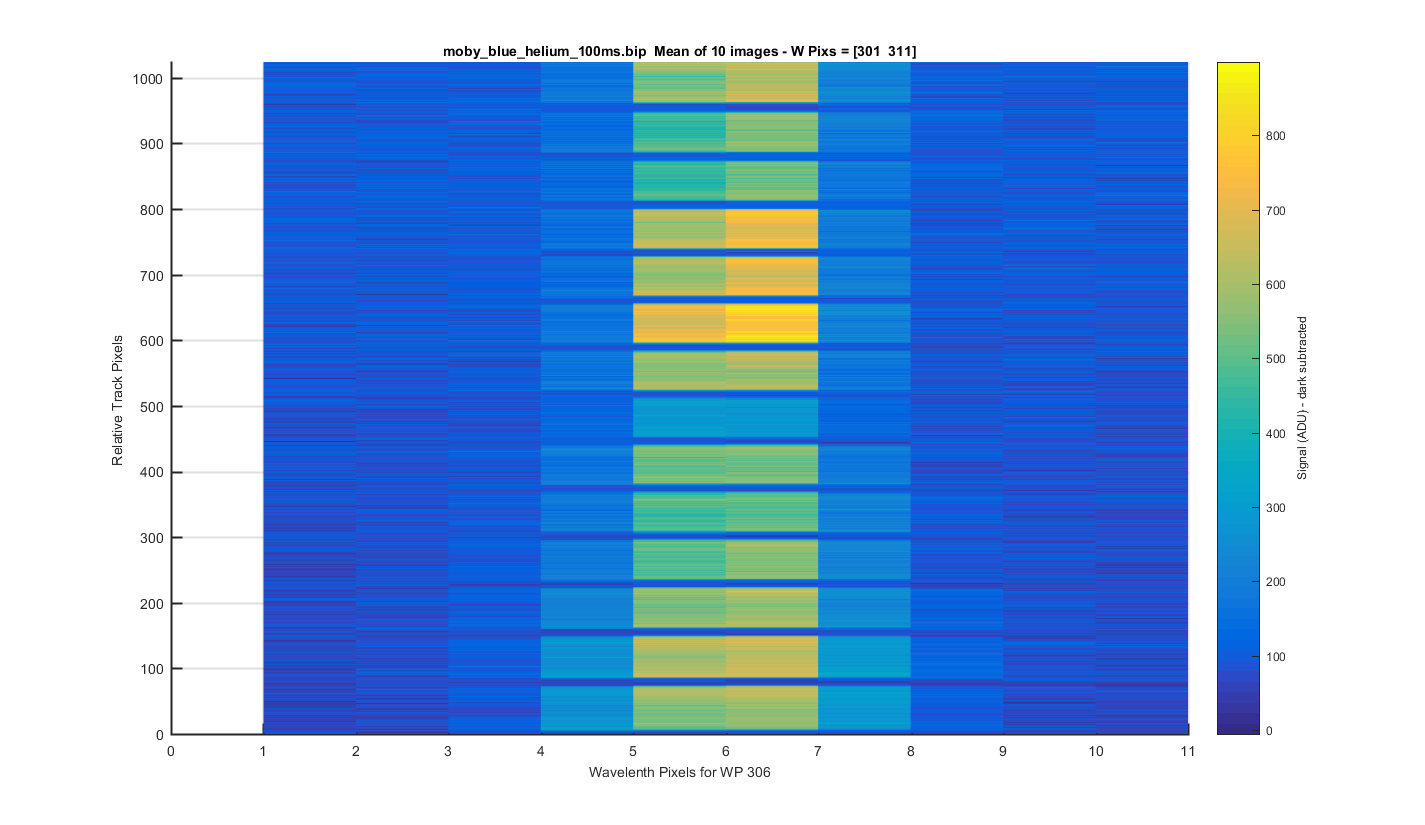
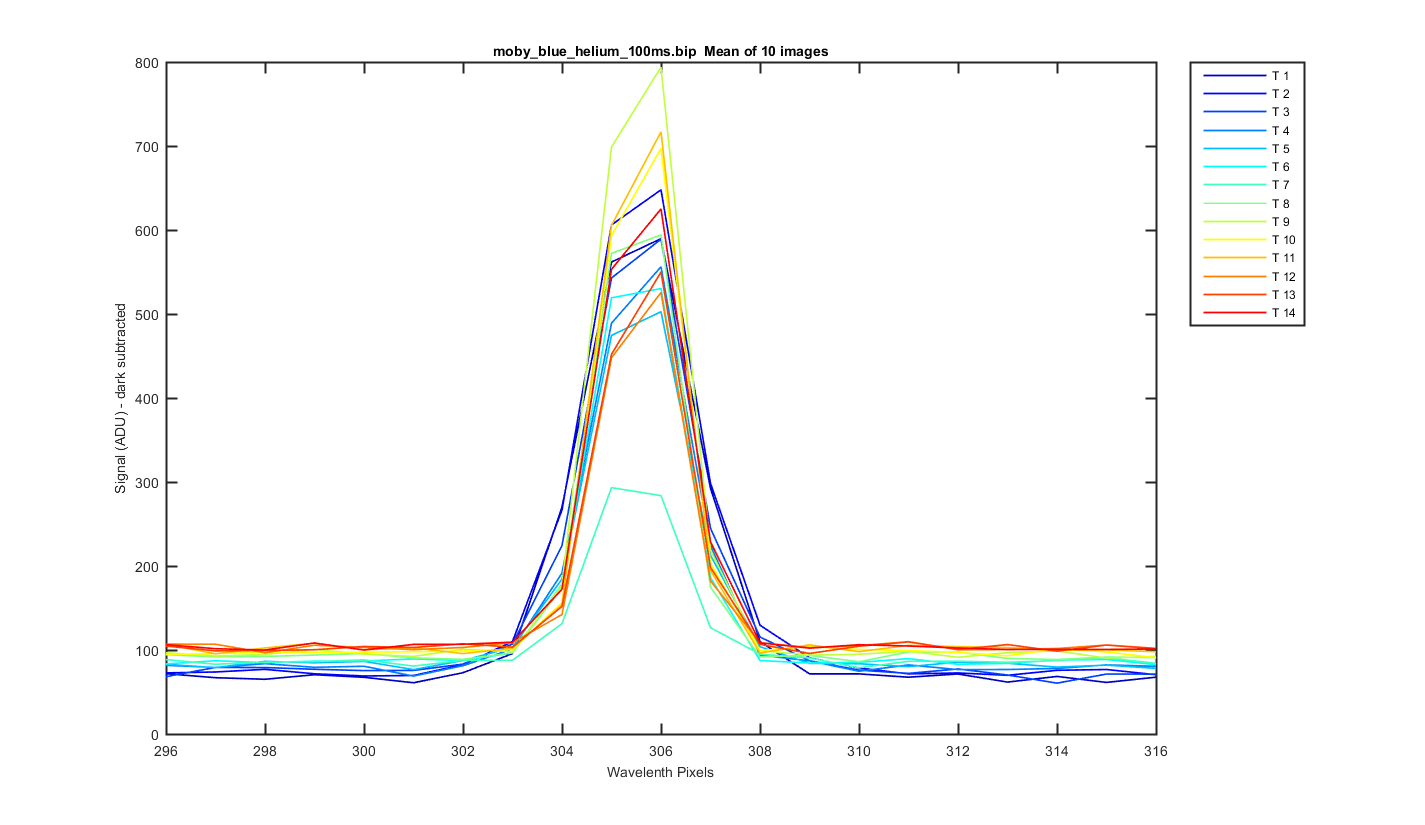
Figure 7
Helium Peak 2 (at pix 306): The same surface plot but showing how individual helium peaks line up from track to track. Looks pretty good!
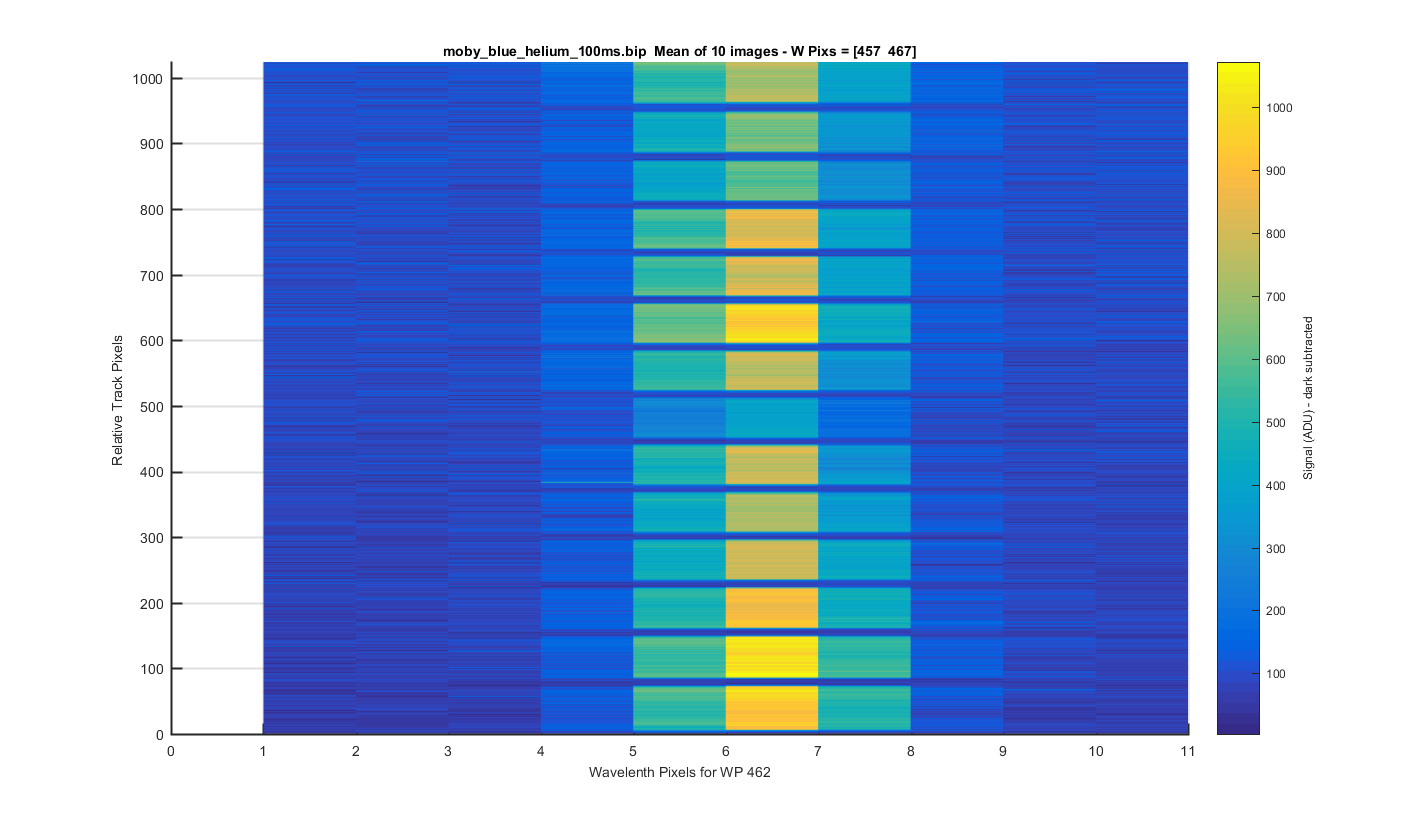
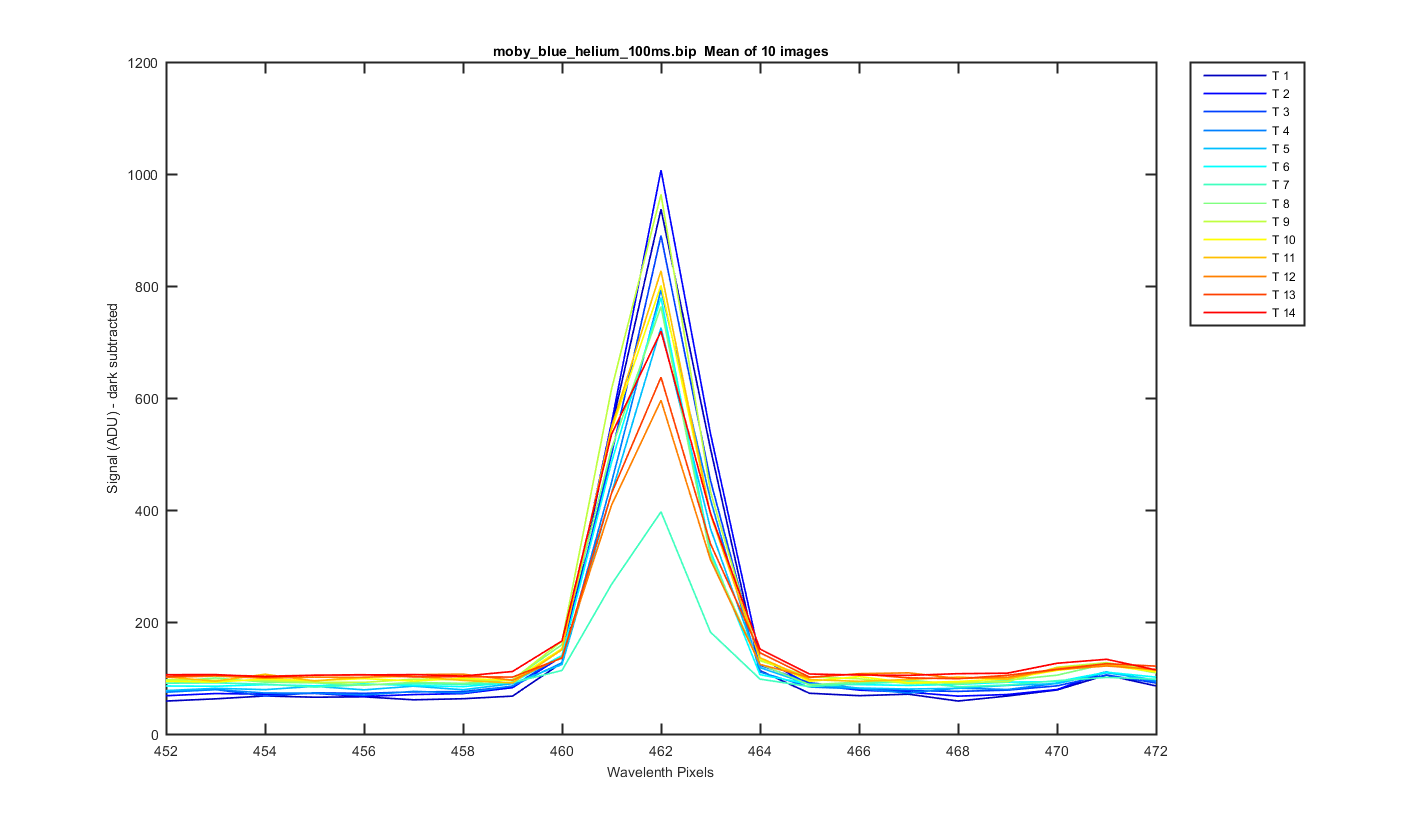
Figure 8
Helium Peak 3 (at pix 462): The same surface plot but showing how individual helium peaks line up from track to track. Looks pretty good!
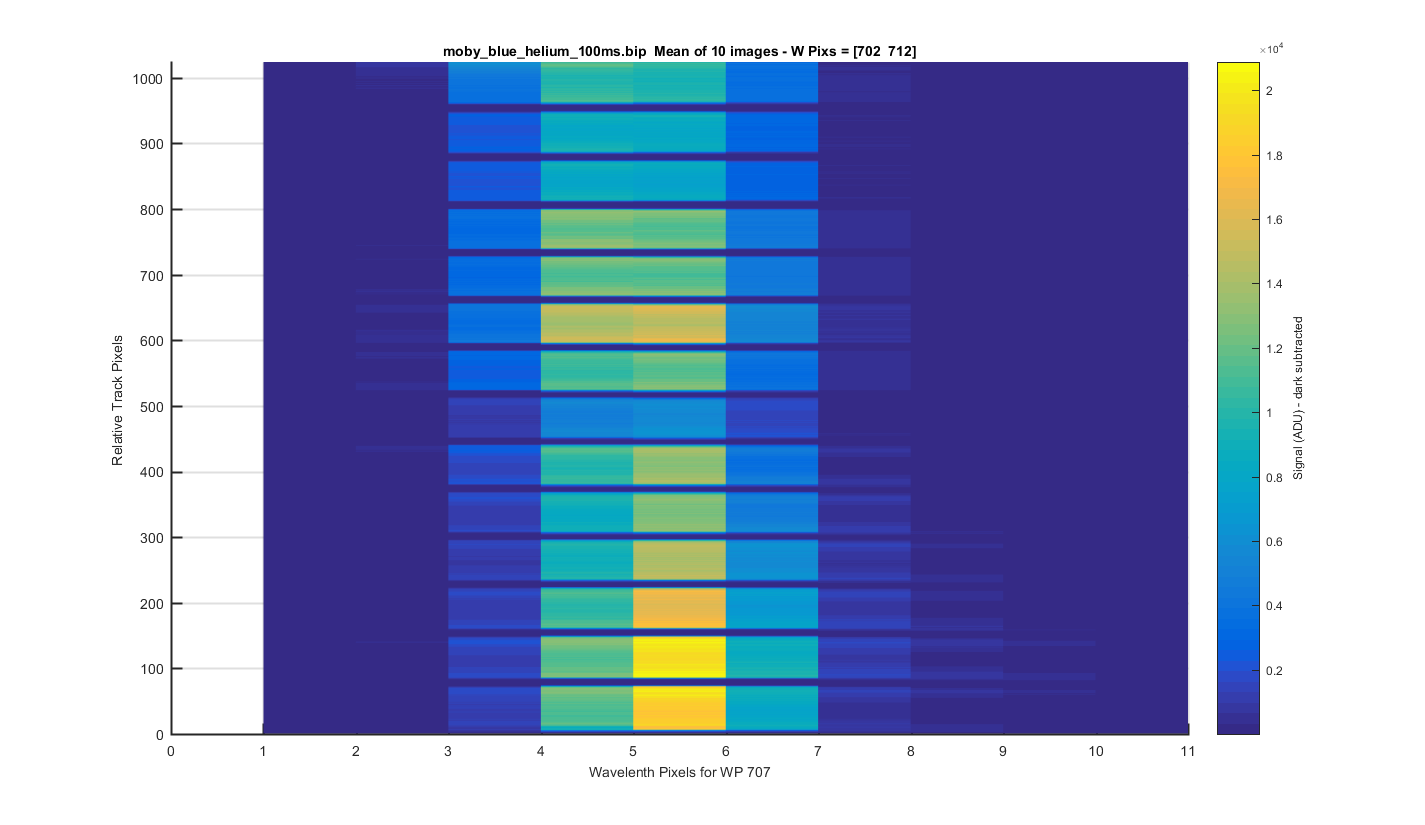
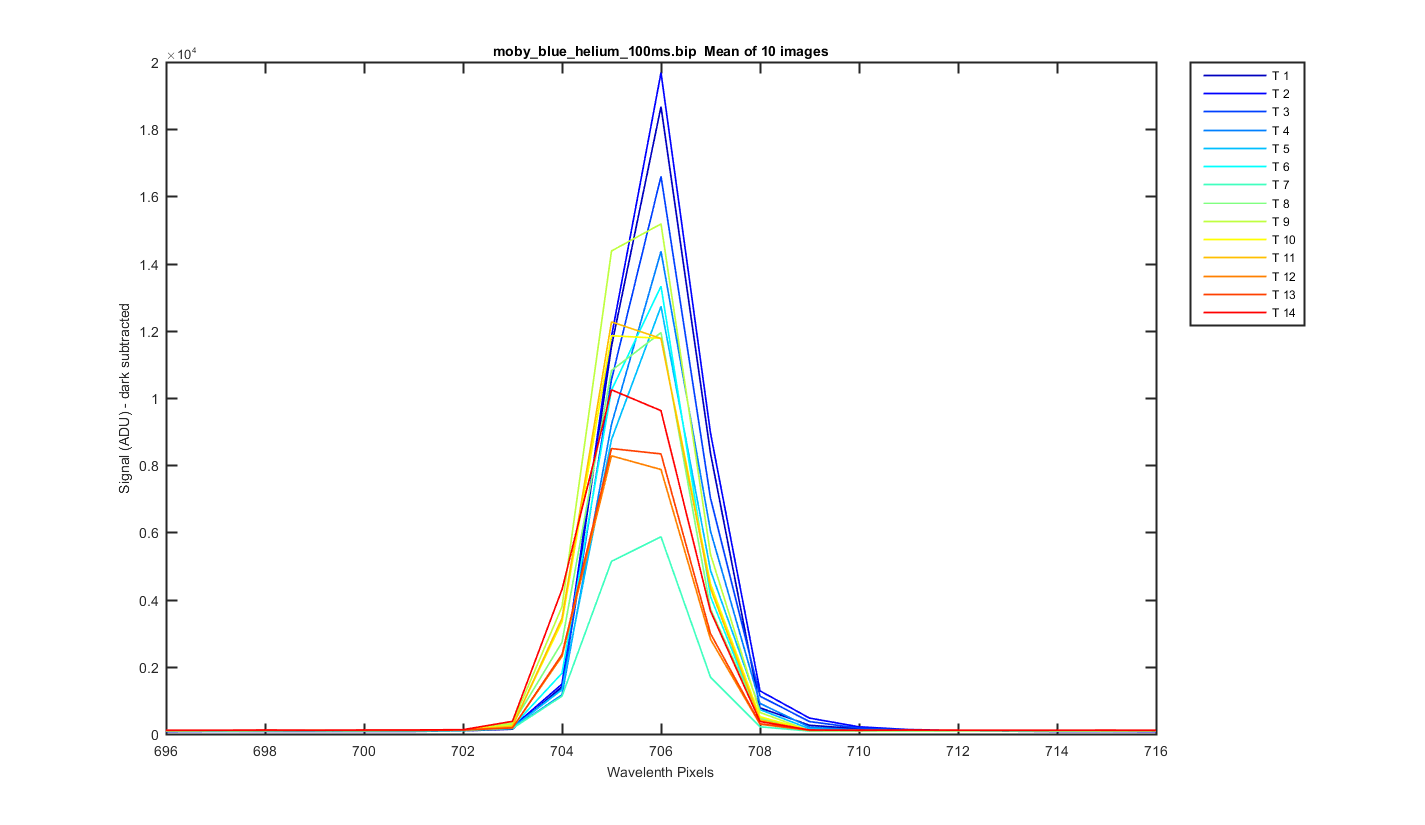
Figure 9
Helium Peak 4 (at pix 707): The same surface plot but showing how individual helium peaks line up from track to track. Looks pretty good!
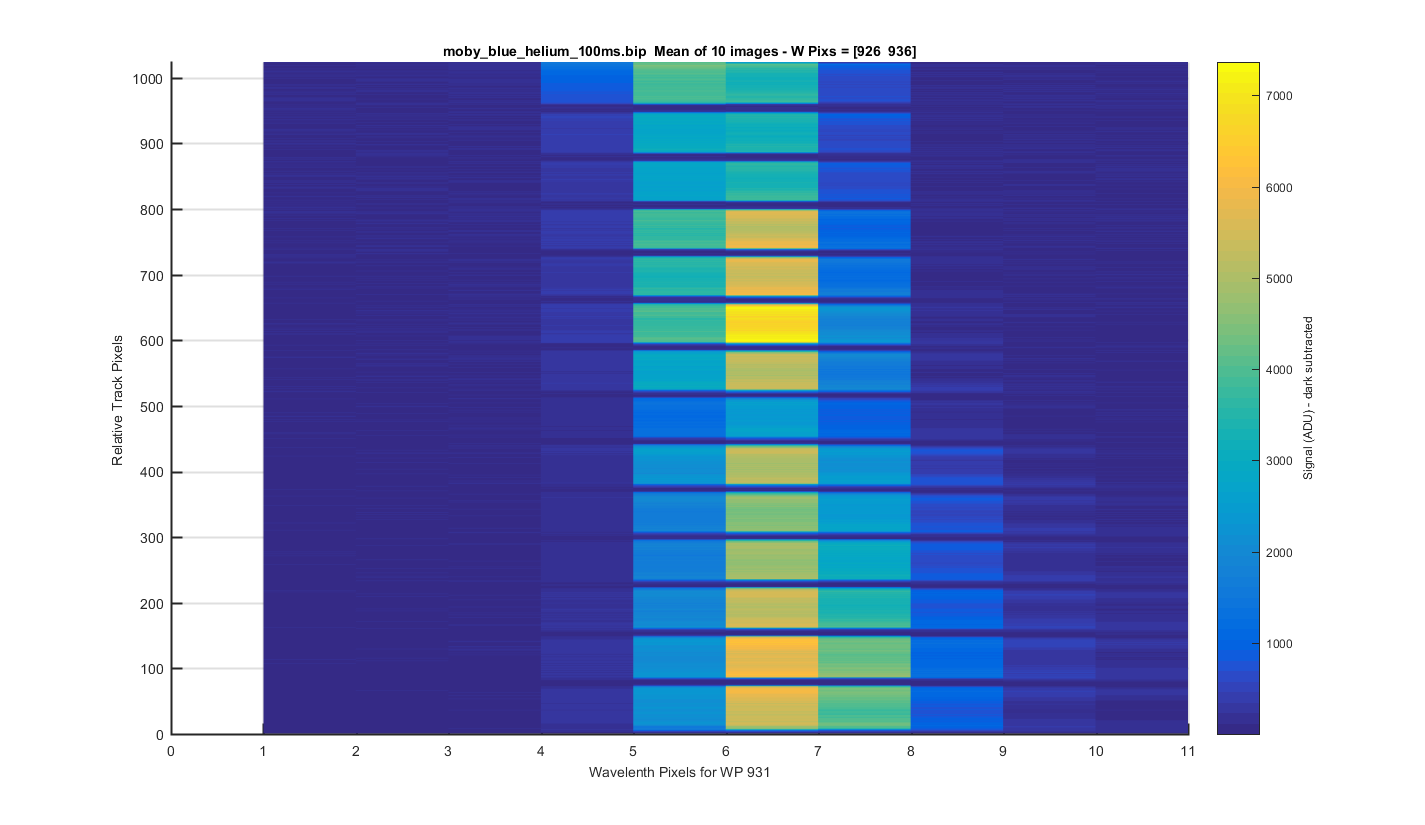
Figure 10
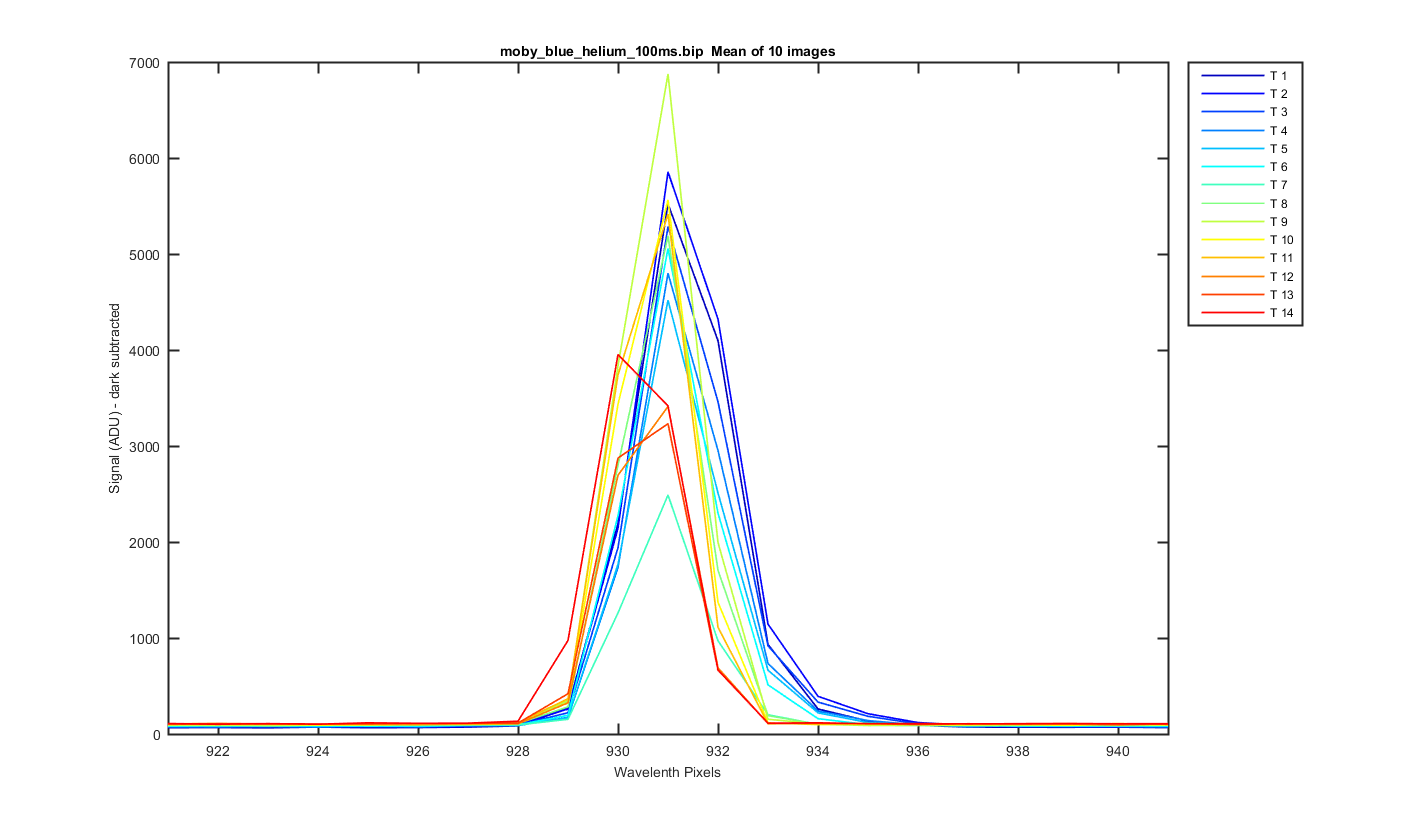
Helium Peak 5 (at pix 931): The same surface plot but showing how individual helium peaks line up from track to track. Looks pretty good!
Figure 11
Mean image binned by track, the x-axis is wavelength pixels.
Figure 12
Close up of one of the helium peaks
Figure 13
Close up of one of the helium peaks
Figure 14
Close up of one of the helium peaks
Figure 15
Close up of one of the helium peaks
Figure 16
Close up of one of the helium peaks
Figure 17
MY VERY ROUGH GUESS AT A WAVELENGTH CAL!!! THIS ASSUMES I GUESS CORRECTLY WHICH PEAKS WHERE WHICH HELIUM LINES.
Wwavelength cal coeff
P(1,:) = [1.12843e-05 0.338589 342.779];
P(2,:) = [1.12459e-05 0.338641 342.758];
P(3,:) = [1.13701e-05 0.338509 342.8];
P(4,:) = [1.13854e-05 0.338517 342.789];
P(5,:) = [1.13388e-05 0.338596 342.777];
P(6,:) = [1.12154e-05 0.338799 342.734];
P(7,:) = [1.09043e-05 0.339372 342.506];
P(8,:) = [1.113e-05 0.338969 342.701];
P(9,:) = [1.12711e-05 0.338863 342.692];
P(10,:) = [1.12947e-05 0.338878 342.679];
P(11,:) = [1.13582e-05 0.338839 342.684];
P(12,:) = [1.18494e-05 0.33848 342.645];
P(13,:) = [1.16649e-05 0.33857 342.713];
P(14,:) = [1.1683e-05 0.338635 342.697];
Track, Min,    Max,     diff
    1, 343.12, 701.33,  0.35
    2, 343.10, 701.32,  0.35
    3, 343.14, 701.36,  0.35
    4, 343.13, 701.37,  0.35
    5, 343.12, 701.39,  0.35
    6, 343.07, 701.42,  0.35
    7, 342.85, 701.46,  0.35
    8, 343.04, 701.48,  0.35
    9, 343.03, 701.51,  0.35
   10, 343.02, 701.53,  0.35
   11, 343.02, 701.56,  0.35
   12, 342.98, 701.67,  0.35
   13, 343.05, 701.64,  0.35
   14, 343.04, 701.71,  0.35
Figure 18
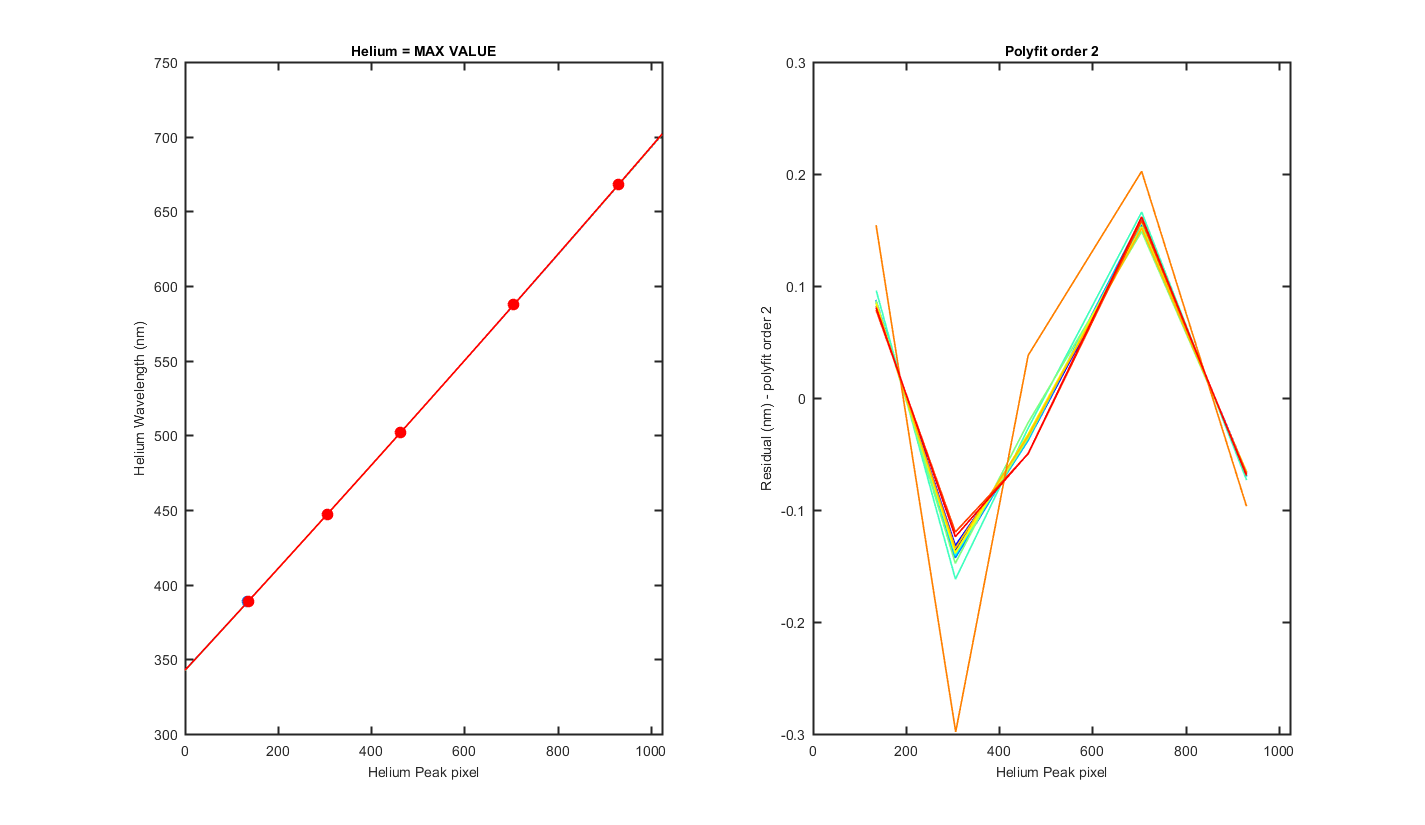
  Track = The Resonon Track number
Lwave = Laser Wavelength
Lpix1 = Laser Pixel found using the max value of the track
Lpix2 = Laser Pixel found using mygaussfit to fit the laser peak
| Track | Lwave | Lpix1 | Lpix2 |
|---|---|---|---|
| 1 | 388.8648 | 135 | 135.25 |
| 1 | 447.148 | 306 | 305.54 |
| 1 | 501.5678 | 462 | 461.97 |
| 1 | 587.56 | 706 | 705.87 |
| 1 | 667.81 | 931 | 931.26 |
| 2 | 388.8648 | 135 | 135.30 |
| 2 | 447.148 | 306 | 305.55 |
| 2 | 501.5678 | 462 | 461.99 |
| 2 | 587.56 | 706 | 705.89 |
| 2 | 667.81 | 931 | 931.27 |
| 3 | 388.8648 | 135 | 135.21 |
| 3 | 447.148 | 306 | 305.54 |
| 3 | 501.5678 | 462 | 461.96 |
| 3 | 587.56 | 706 | 705.84 |
| 3 | 667.81 | 931 | 931.20 |
| 4 | 388.8648 | 135 | 135.24 |
| 4 | 447.148 | 306 | 305.57 |
| 4 | 501.5678 | 462 | 461.97 |
| 4 | 587.56 | 706 | 705.84 |
| 4 | 667.81 | 931 | 931.18 |
| 5 | 388.8648 | 135 | 135.25 |
| 5 | 447.148 | 306 | 305.53 |
| 5 | 501.5678 | 462 | 461.93 |
| 5 | 587.56 | 706 | 705.78 |
| 5 | 667.81 | 931 | 931.11 |
| 6 | 388.8648 | 135 | 135.30 |
| 6 | 447.148 | 306 | 305.51 |
| 6 | 501.5678 | 462 | 461.85 |
| 6 | 587.56 | 706 | 705.68 |
| 6 | 667.81 | 931 | 931.00 |
| 7 | 388.8648 | 135 | 135.73 |
| 7 | 447.148 | 305 | 305.81 |
| 7 | 501.5678 | 462 | 461.92 |
| 7 | 587.56 | 706 | 705.60 |
| 7 | 667.81 | 931 | 930.92 |
| 8 | 388.8648 | 135 | 135.33 |
| 8 | 447.148 | 306 | 305.50 |
| 8 | 501.5678 | 462 | 461.74 |
| 8 | 587.56 | 706 | 705.58 |
| 8 | 667.81 | 931 | 930.86 |
| 9 | 388.8648 | 135 | 135.40 |
| 9 | 447.148 | 306 | 305.56 |
| 9 | 501.5678 | 462 | 461.86 |
| 9 | 587.56 | 706 | 705.59 |
| 9 | 667.81 | 931 | 930.82 |
| 10 | 388.8648 | 135 | 135.43 |
| 10 | 447.148 | 306 | 305.57 |
| 10 | 501.5678 | 462 | 461.85 |
| 10 | 587.56 | 705 | 705.58 |
| 10 | 667.81 | 931 | 930.76 |
| 11 | 388.8648 | 135 | 135.43 |
| 11 | 447.148 | 306 | 305.57 |
| 11 | 501.5678 | 462 | 461.86 |
| 11 | 587.56 | 705 | 705.56 |
| 11 | 667.81 | 931 | 930.69 |
| 12 | 388.8648 | 136 | 135.45 |
| 12 | 447.148 | 306 | 306.34 |
| 12 | 501.5678 | 462 | 461.94 |
| 12 | 587.56 | 705 | 705.55 |
| 12 | 667.81 | 931 | 930.63 |
| 13 | 388.8648 | 136 | 135.45 |
| 13 | 447.148 | 306 | 305.59 |
| 13 | 501.5678 | 462 | 461.99 |
| 13 | 587.56 | 705 | 705.56 |
| 13 | 667.81 | 931 | 930.57 |
| 14 | 388.8648 | 136 | 135.46 |
| 14 | 447.148 | 306 | 305.59 |
| 14 | 501.5678 | 462 | 461.93 |
| 14 | 587.56 | 705 | 705.44 |
| 14 | 667.81 | 930 | 930.41 |