REVISION DATE: 29-Jan-2016 15:12:11
Part of an Email from Mike Kehoe on 1/28/2016 3:03 PM: Casey has checked over the blue system (BS2) following the shake/stability test. Results are materially unchanged from the report of January 12th. The updated data is on our site, per Caseys instructions below. We plan to ship this unit to Hawaii on Monday via the usual shipping channel.
MIKES EMAIL ------------------
I looked at the NIST Atomic Spectra Database for Helium lines (in-air, nm)
( http://www.nist.gov/pml/data/asd.cfm, "Lines", "He I, 500 to 1000 nm" )
Casey send five bip files (moby_blue_dark_100ms.bip moby_blue_helium_100ms.bip moby_blue_radiance.bip moby_blue_dark_500ms.bip moby_blue_helium_500ms.bip).
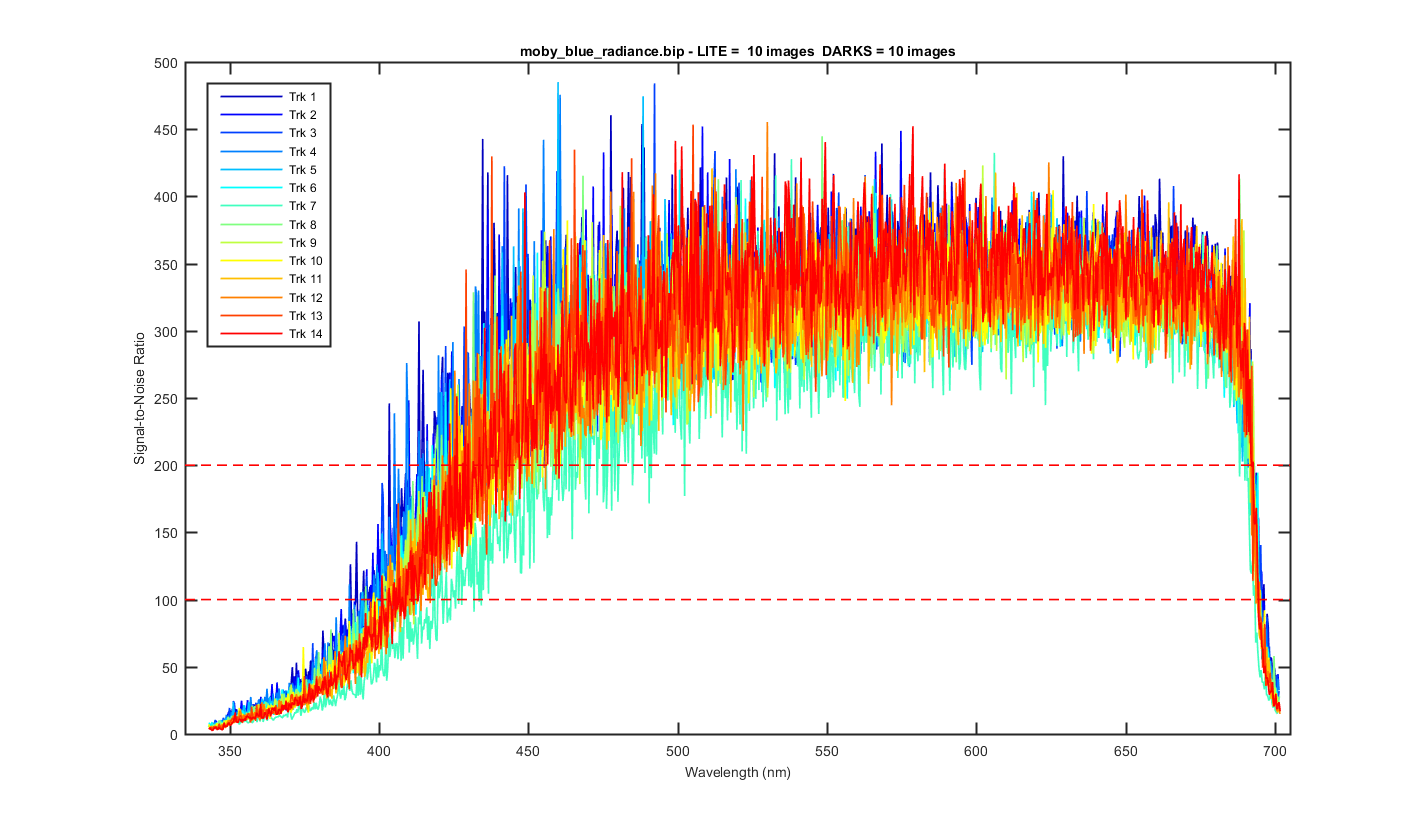
Below are my graphs of the moby_blue_radiance.bip. The file contains 10 images of the sphere source. All the data are dark subtracted. See each graph below for more detail.
At the very bottom are the track data in linear and log and the signal to noise ratio calculated for each track.
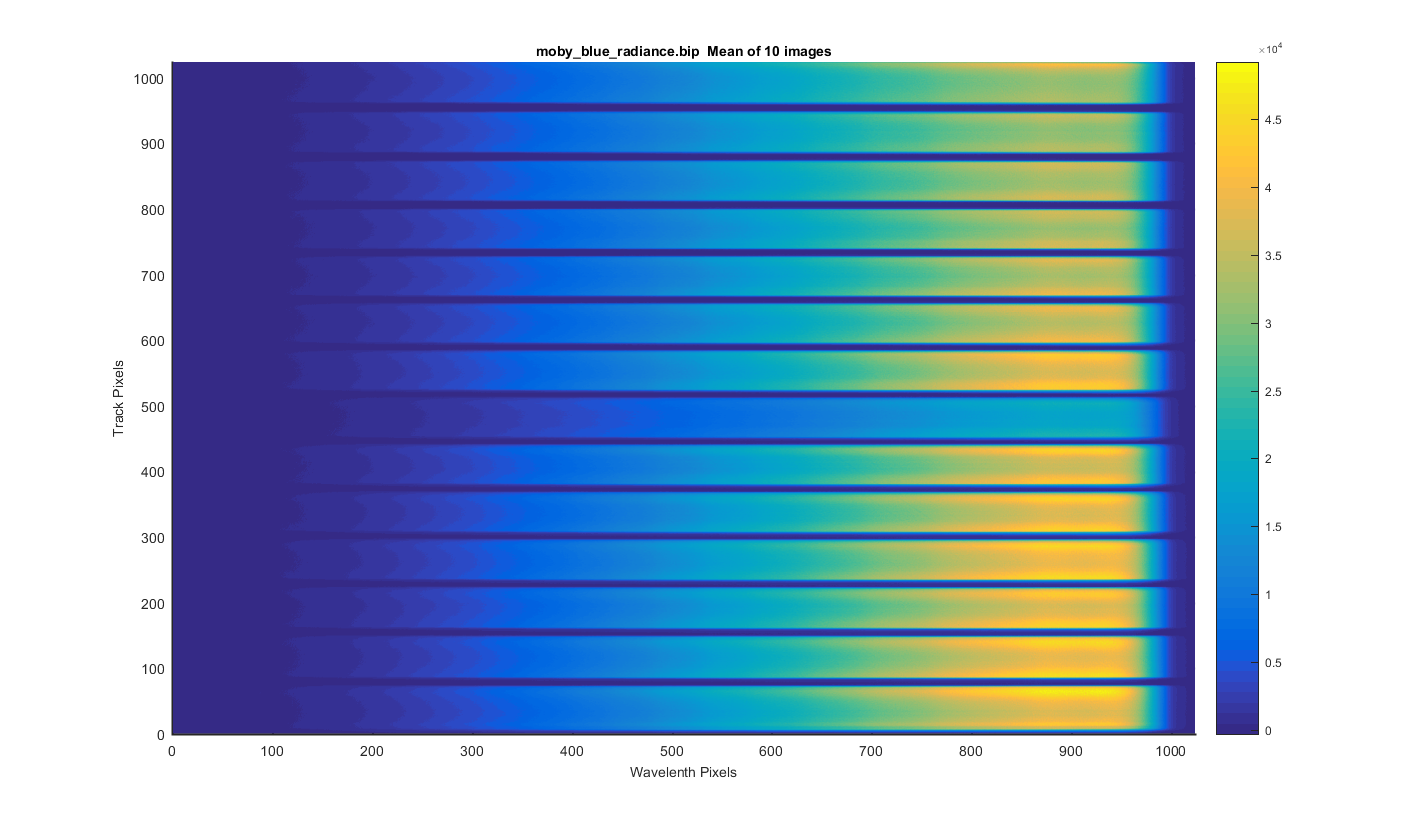
I took the 18 images and meaned them to get the surface plot below. Looks really nice!
Figure 1
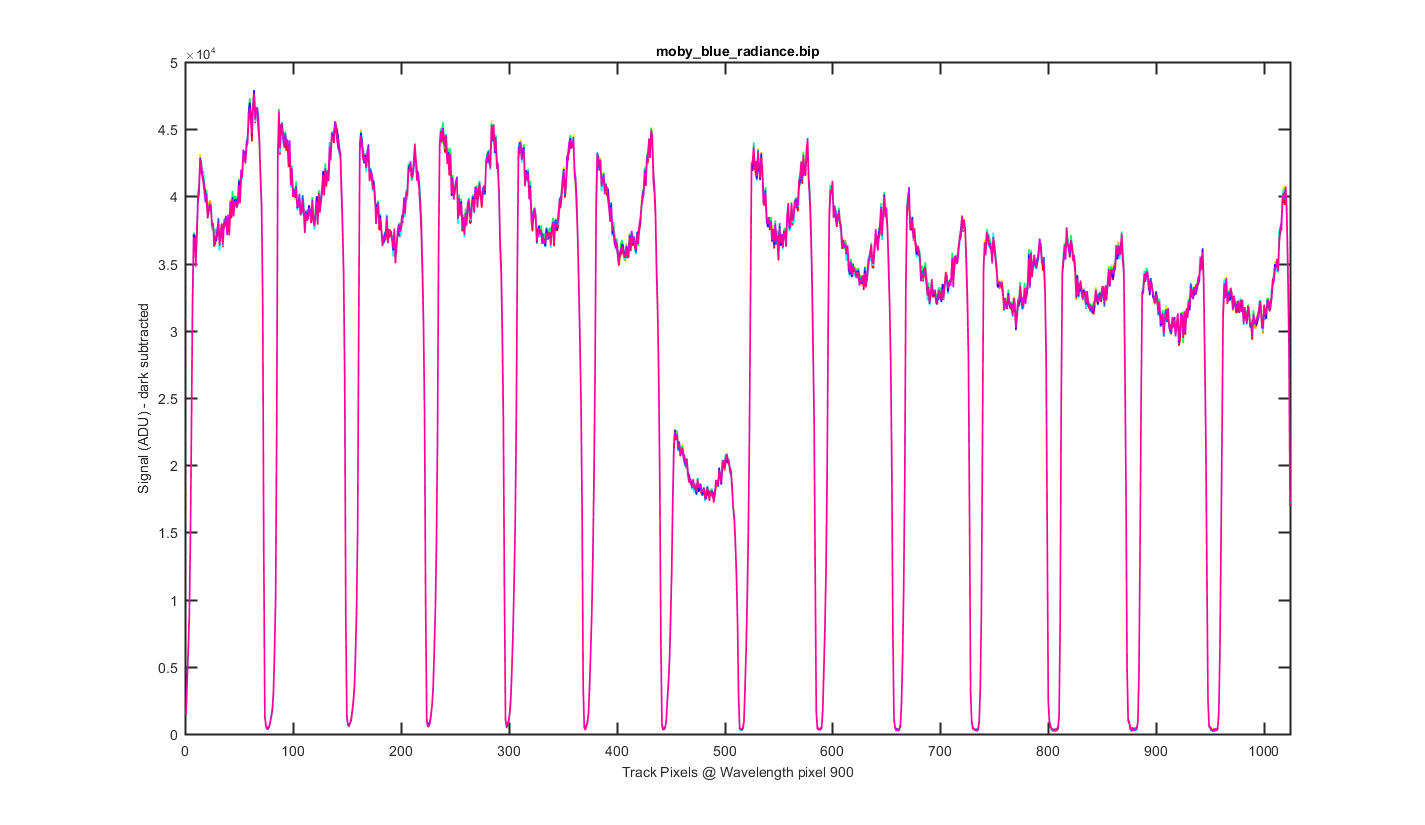
This is a cross section through the tracks at wavelength pixel 900, with one line for each of the 10 images. The tracks and their shapes look really stable.
Figure 2
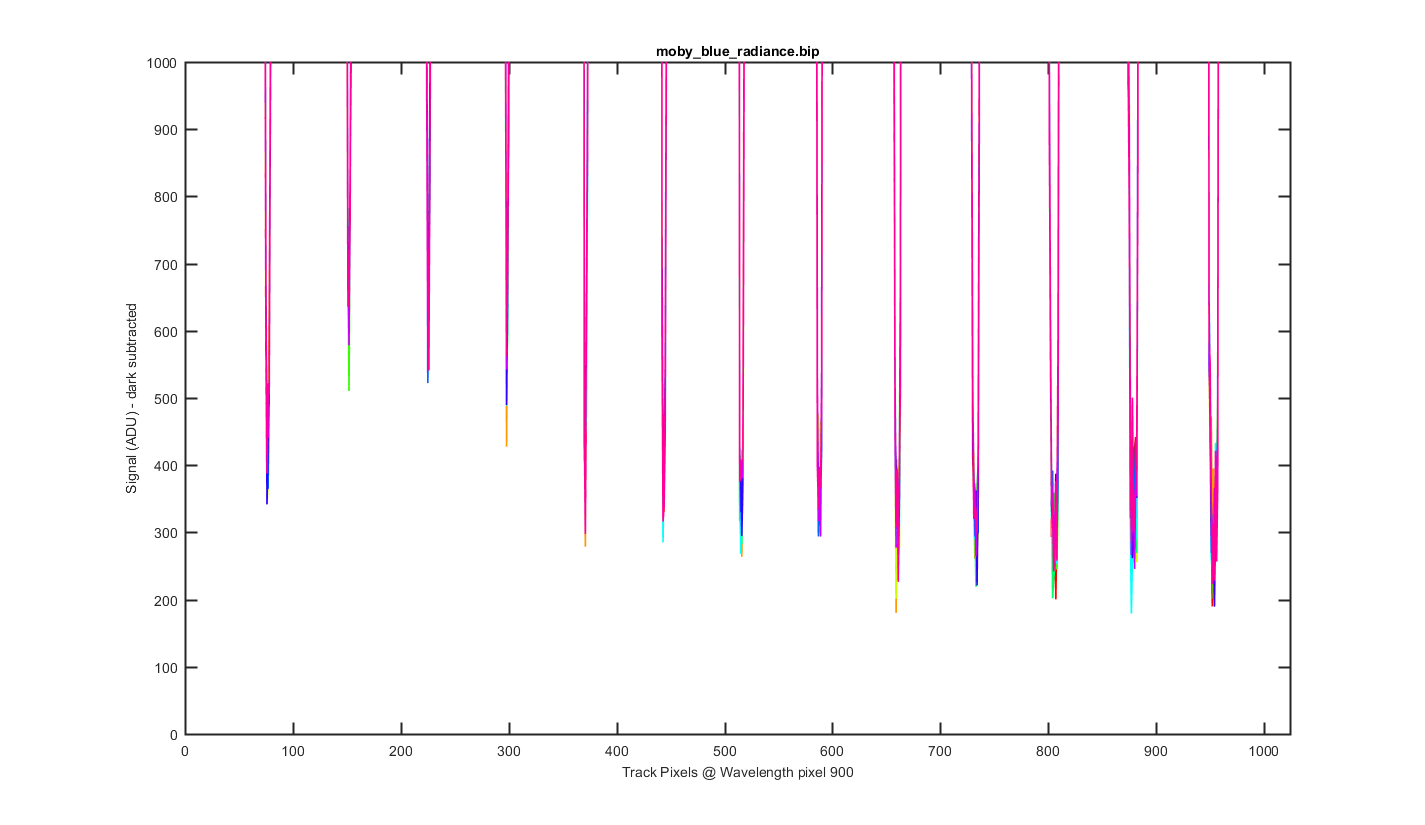
Same as the previous graph but zoomed into the bottom to see the level of the darks between the tracks.
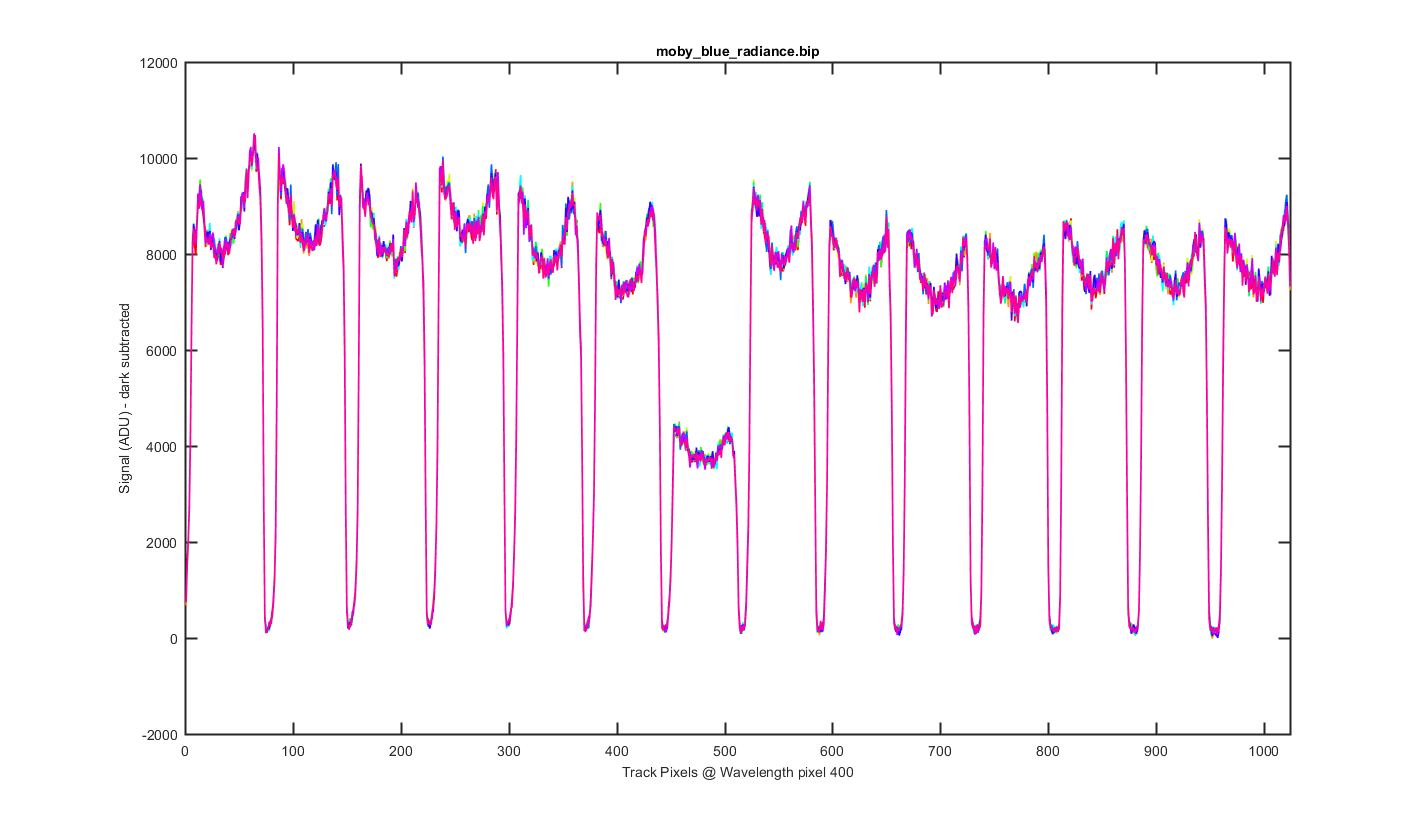
Figure 3
Same as figure 2 but for Wavelength pixel 400.
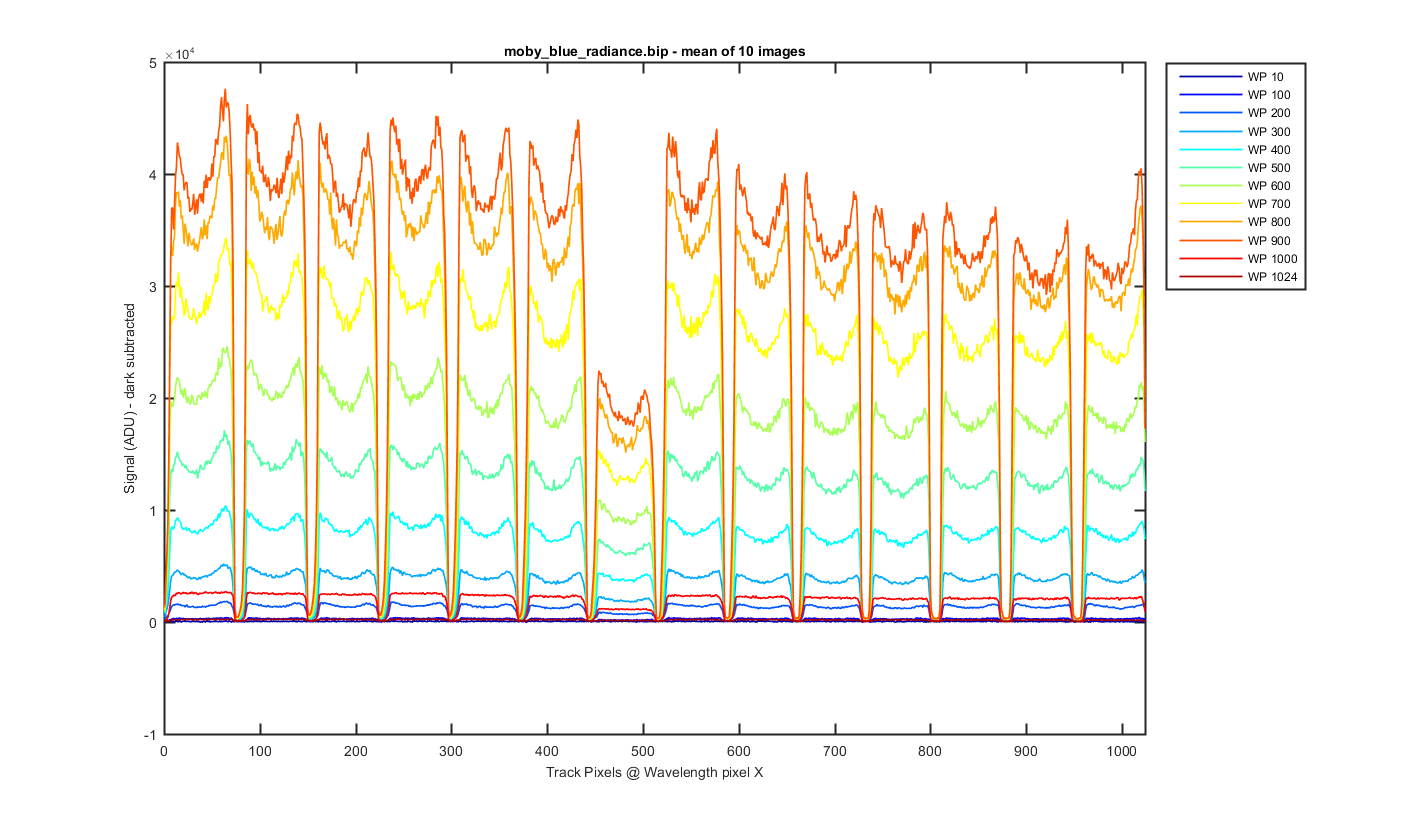
Figure 4
Again this is the mean image with slices thought the image at different wavelength pixels.
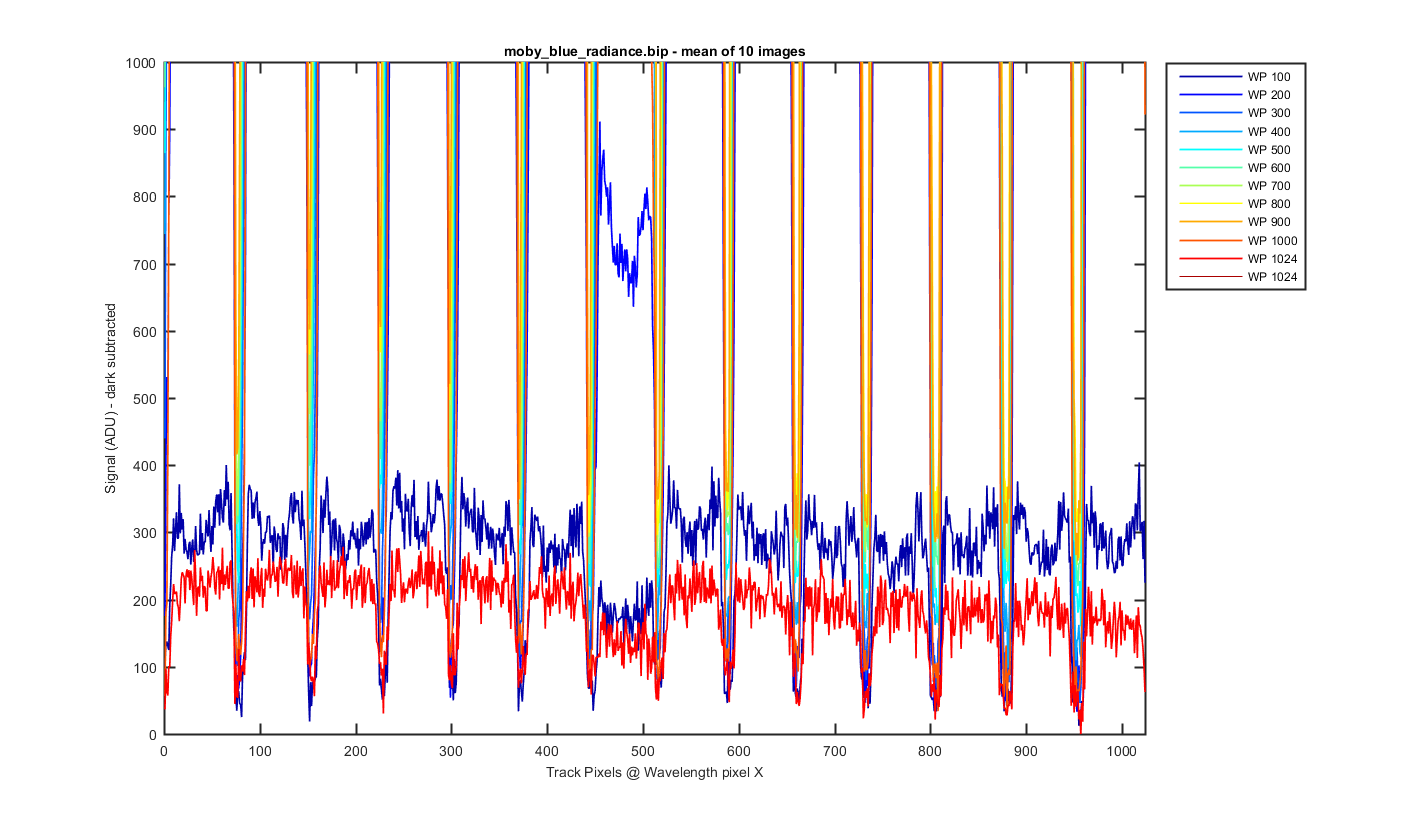
Figure 5
Same as figure 5 but zoomed to the bottom so you can see the darks between the tracks.
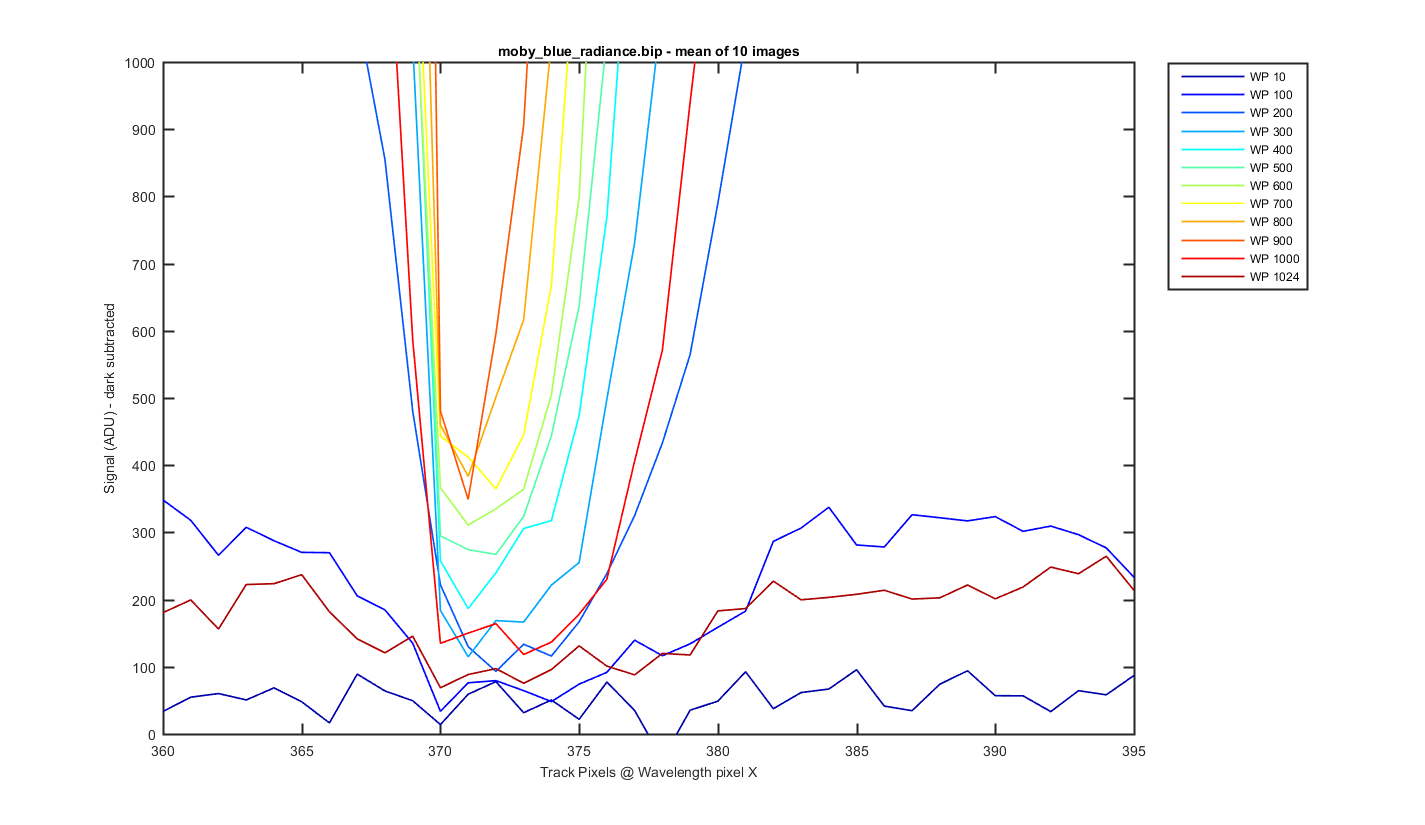
Figure 6
Same as figure 6 but zoomed to the dark space between track 5 and 6
Figure 7
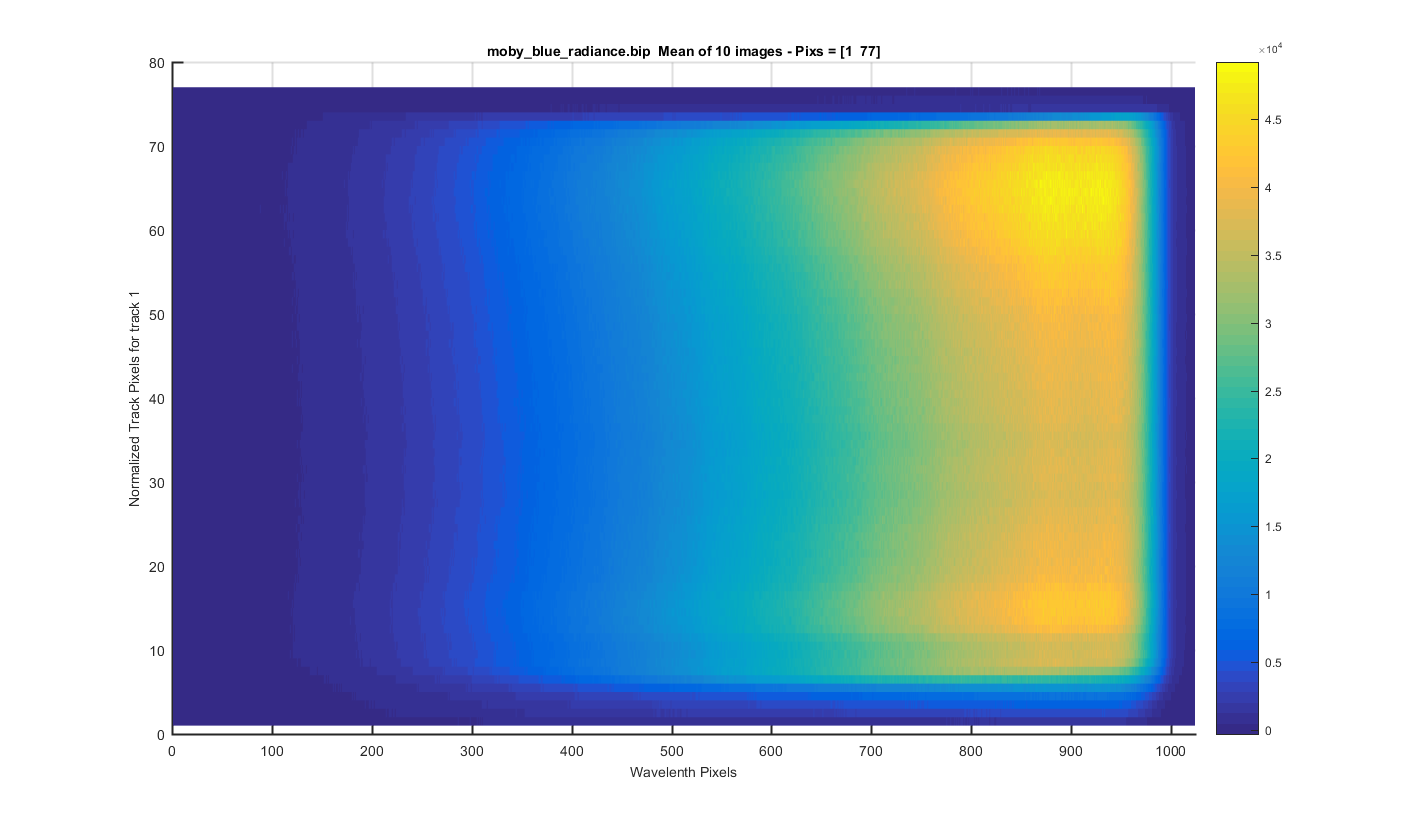
TRACK 1: The meaned image surface plot but for only one track so you can see each track zoomed in. The y-axis is the relative pixel for that track. The title contains the real pixels. I clicked to get these track positions so this will need to be refined in the future.
Figure 8
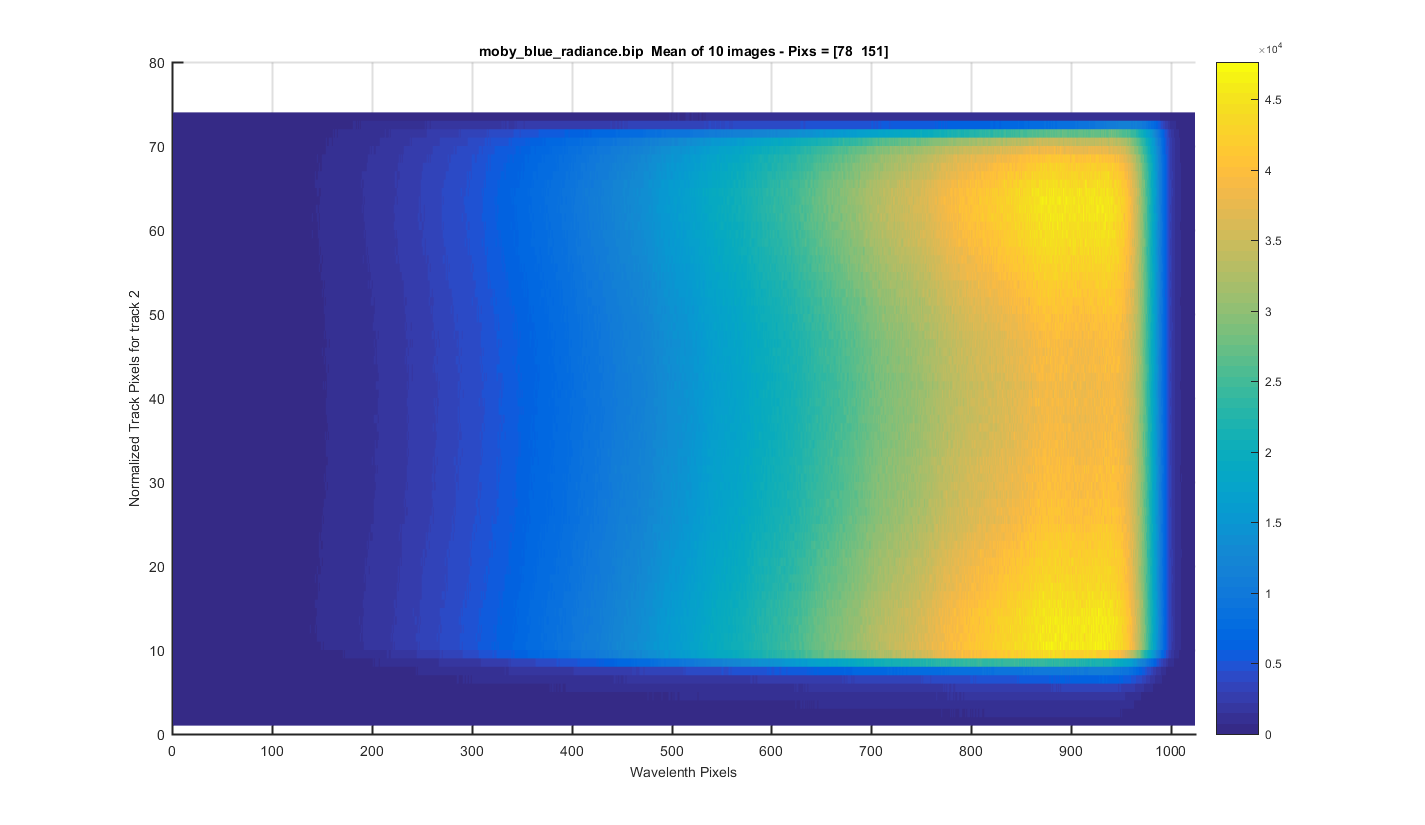
TRACK 2: The meaned image surface plot but for only one track so you can see each track zoomed in. The y-axis is the relative pixel for that track. The title contains the real pixels. I clicked to get these track positions so this will need to be refined in the future.
Figure 9
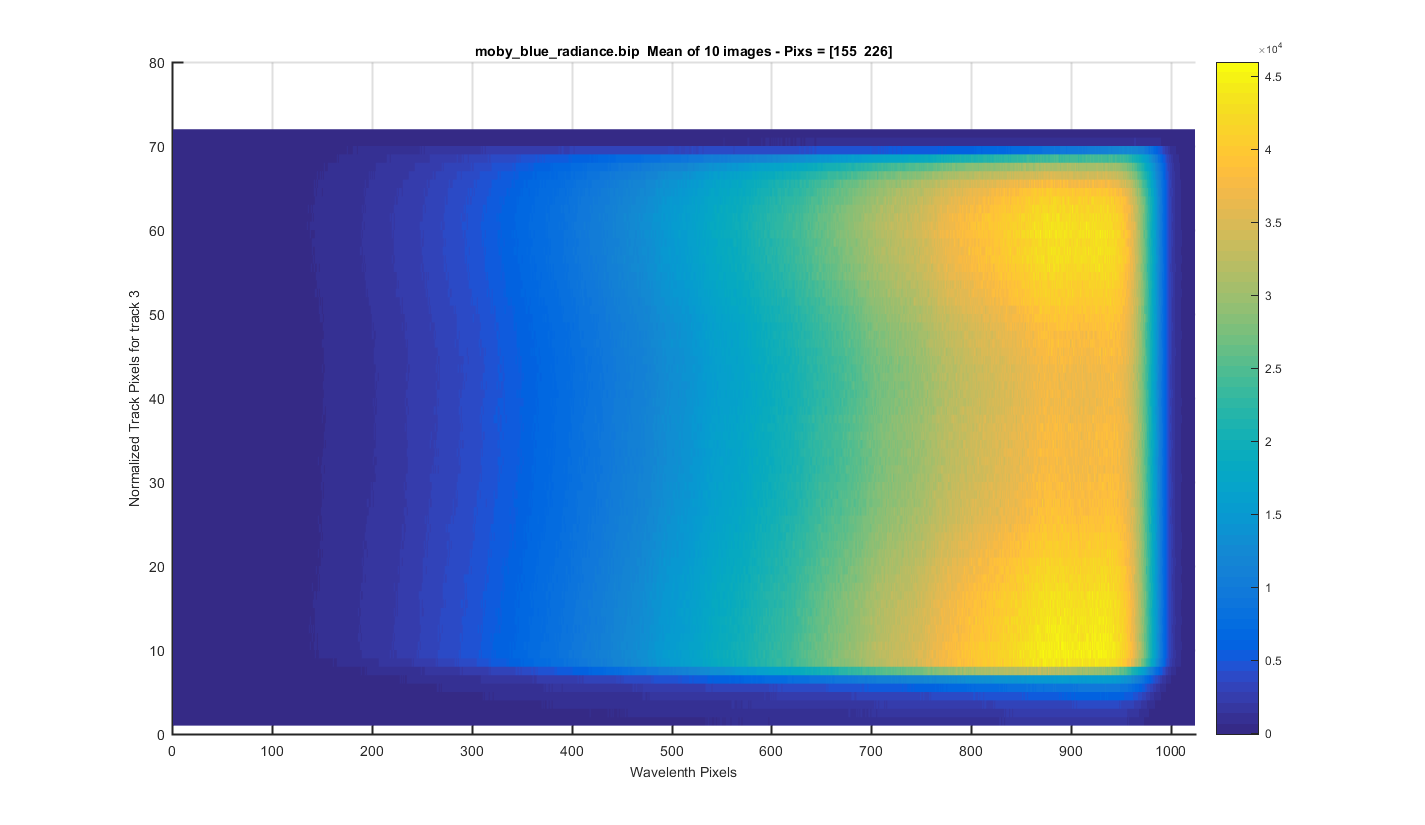
TRACK 3: The meaned image surface plot but for only one track so you can see each track zoomed in. The y-axis is the relative pixel for that track. The title contains the real pixels. I clicked to get these track positions so this will need to be refined in the future.
Figure 10
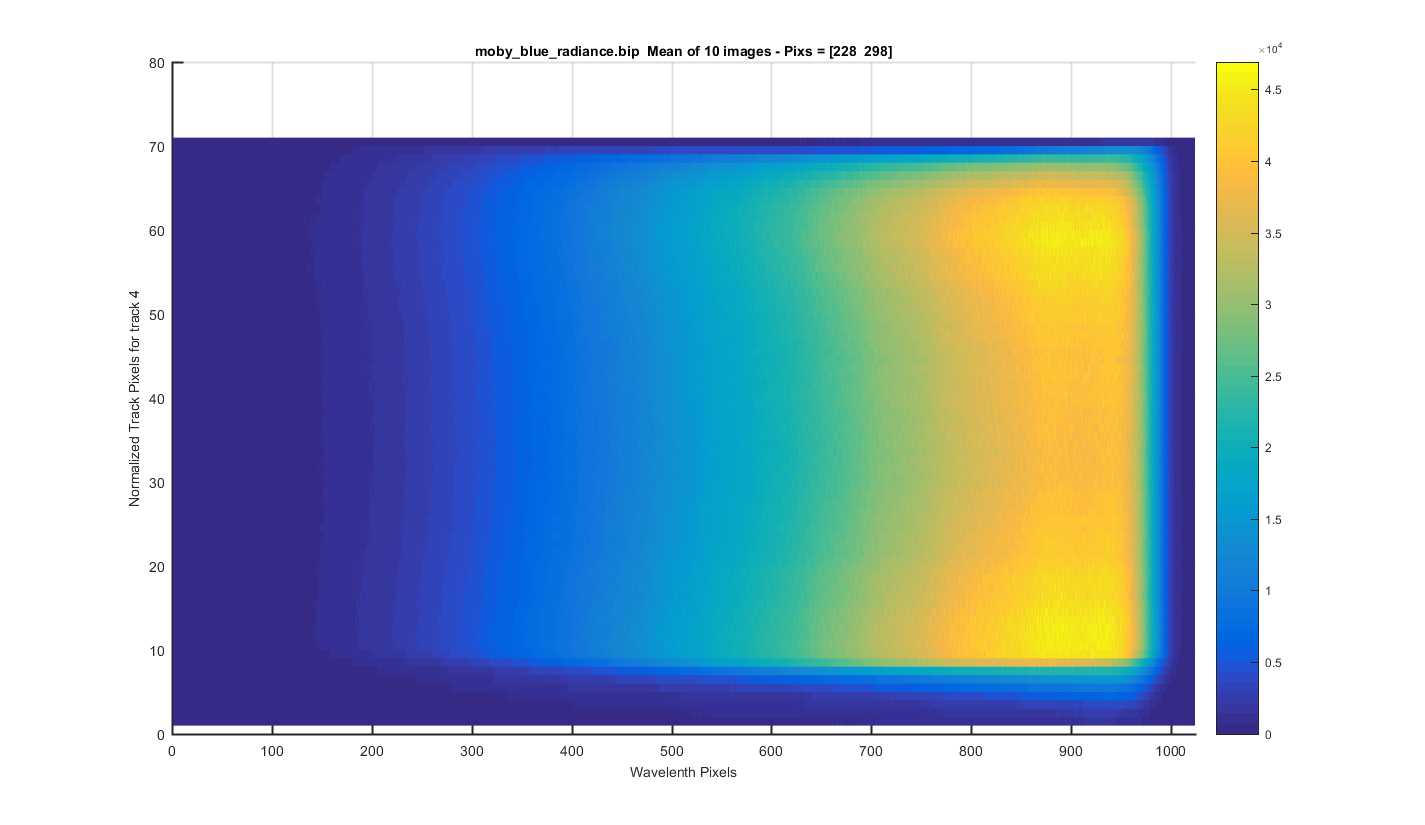
TRACK 4: The meaned image surface plot but for only one track so you can see each track zoomed in. The y-axis is the relative pixel for that track. The title contains the real pixels. I clicked to get these track positions so this will need to be refined in the future.
Note the line down the entore length of the track (around track pixel 23). Not sure what causes this?
Figure 11
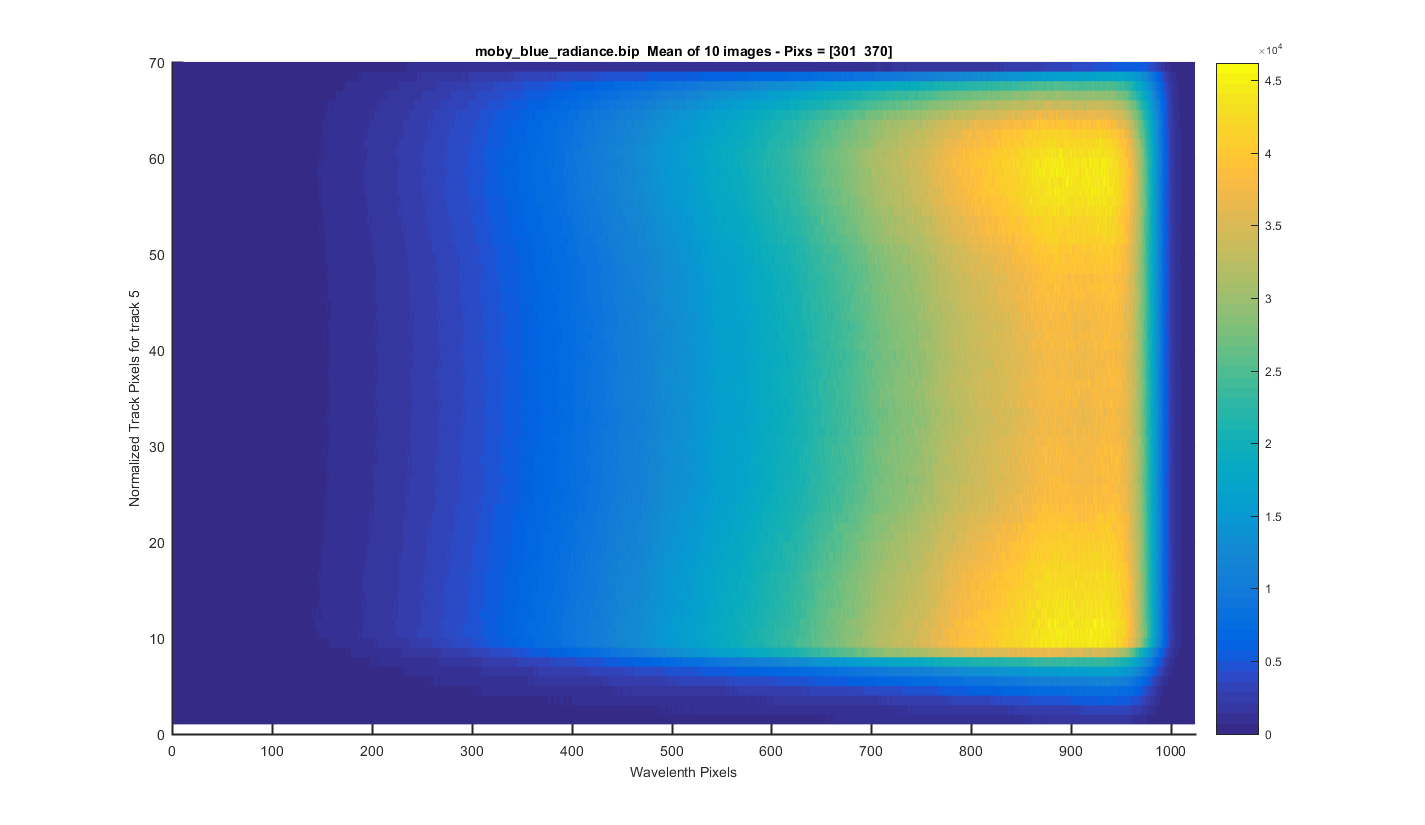
TRACK 5: The meaned image surface plot but for only one track so you can see each track zoomed in. The y-axis is the relative pixel for that track. The title contains the real pixels. I clicked to get these track positions so this will need to be refined in the future.
Figure 12
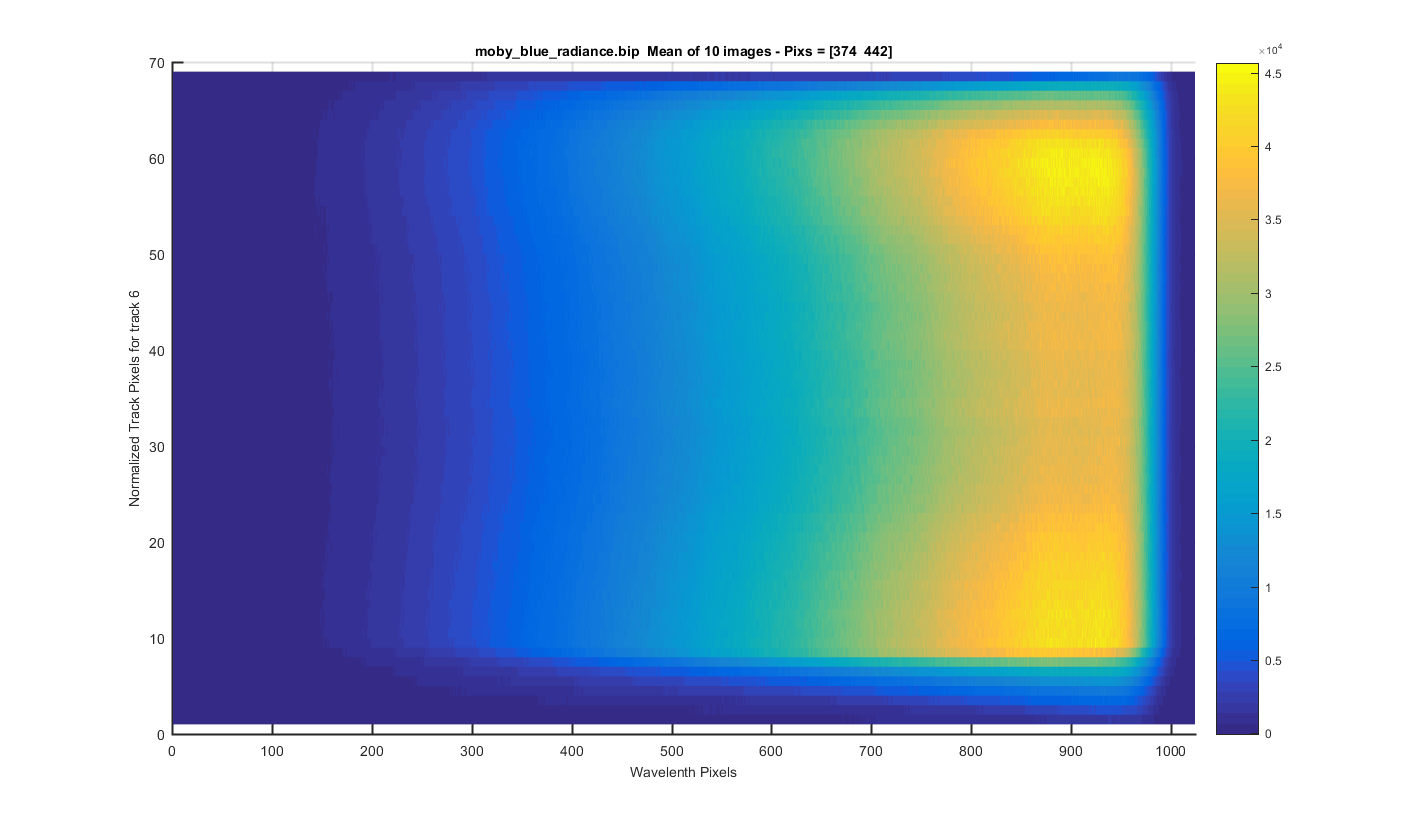
TRACK 6: The meaned image surface plot but for only one track so you can see each track zoomed in. The y-axis is the relative pixel for that track. The title contains the real pixels. I clicked to get these track positions so this will need to be refined in the future.
Figure 13
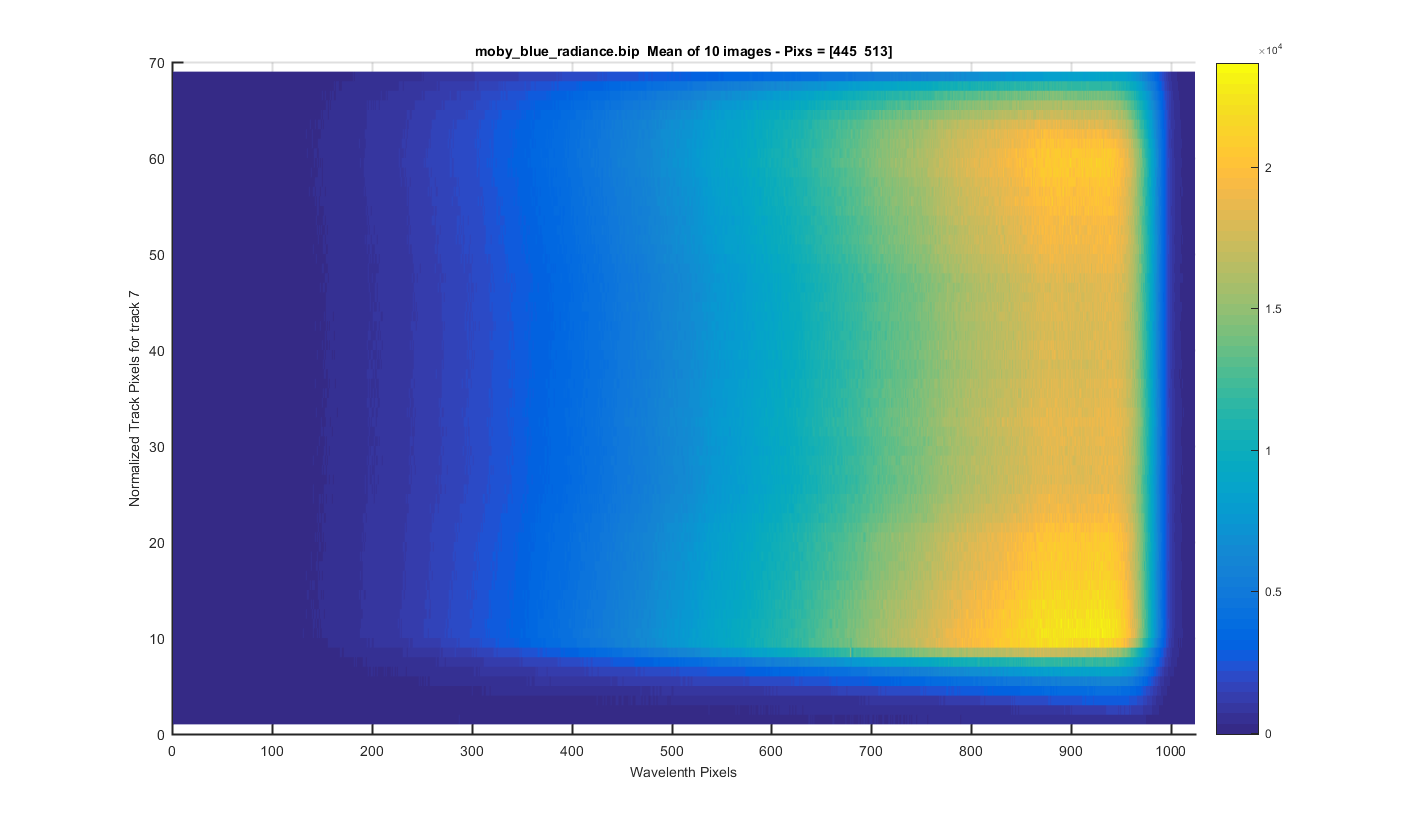
TRACK 7: The meaned image surface plot but for only one track so you can see each track zoomed in. The y-axis is the relative pixel for that track. The title contains the real pixels. I clicked to get these track positions so this will need to be refined in the future.
There may be a line here too , like the one in track 4.
Figure 14
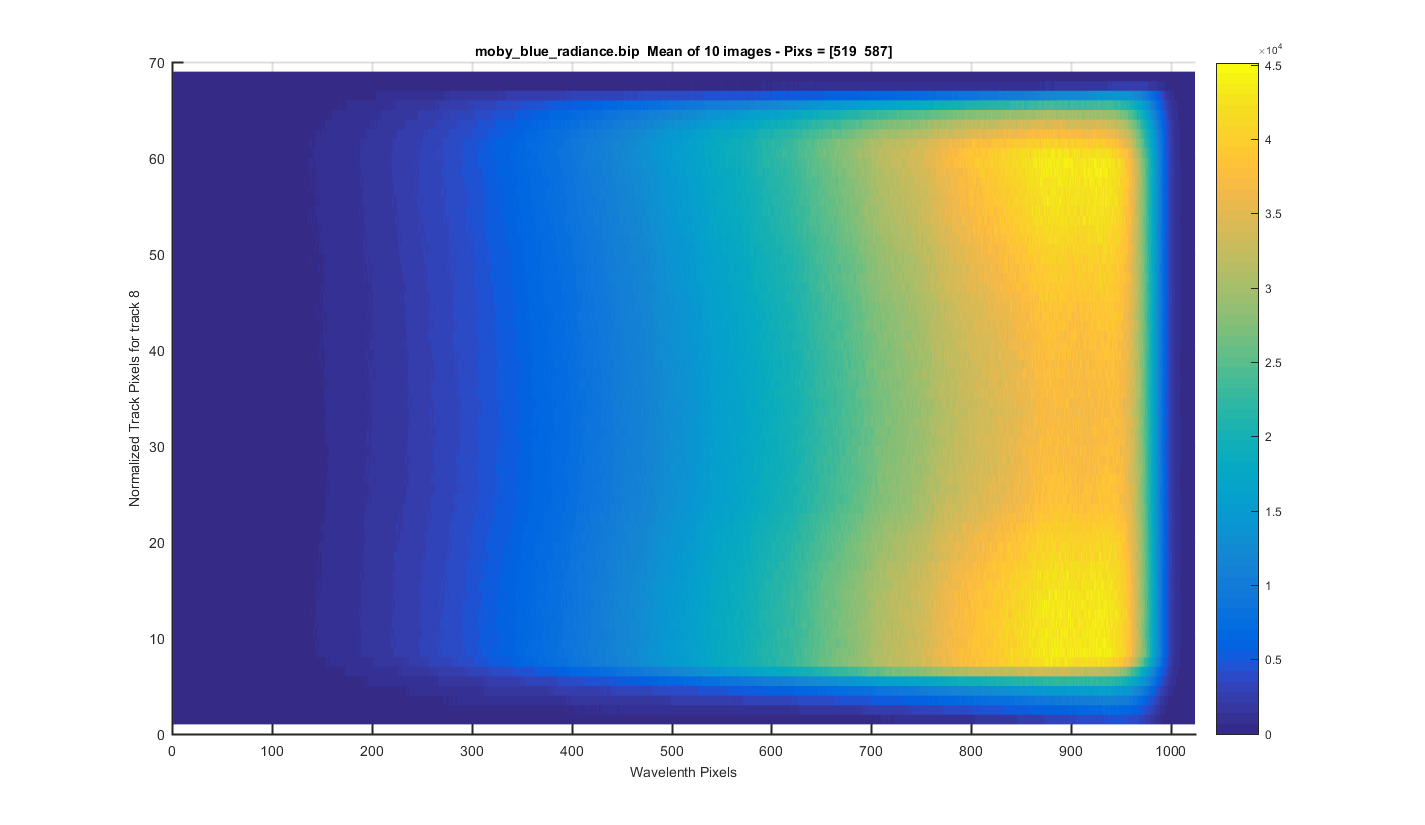
TRACK 8: The meaned image surface plot but for only one track so you can see each track zoomed in. The y-axis is the relative pixel for that track. The title contains the real pixels. I clicked to get these track positions so this will need to be refined in the future.
Figure 15
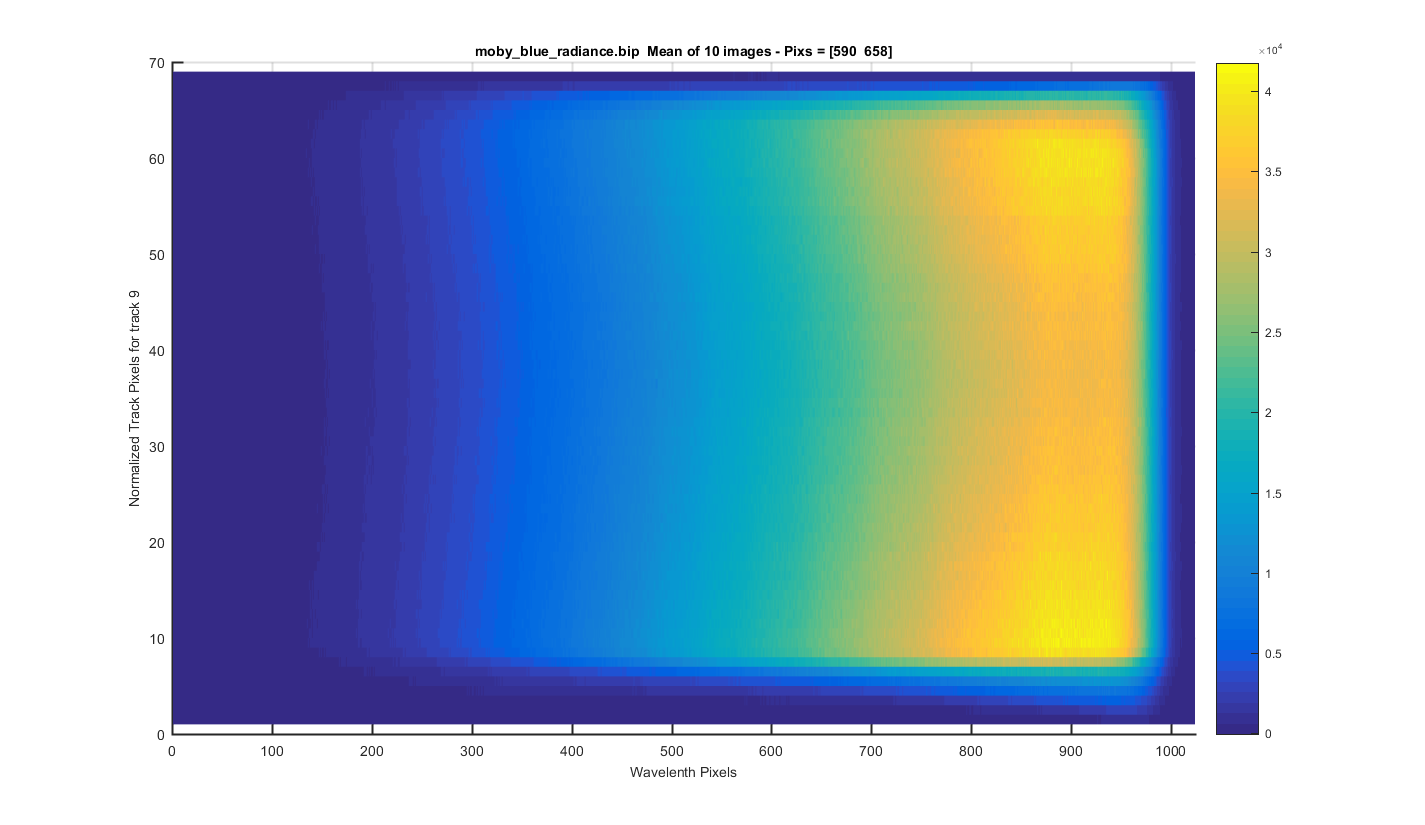
TRACK 9: The meaned image surface plot but for only one track so you can see each track zoomed in. The y-axis is the relative pixel for that track. The title contains the real pixels. I clicked to get these track positions so this will need to be refined in the future.
Figure 16
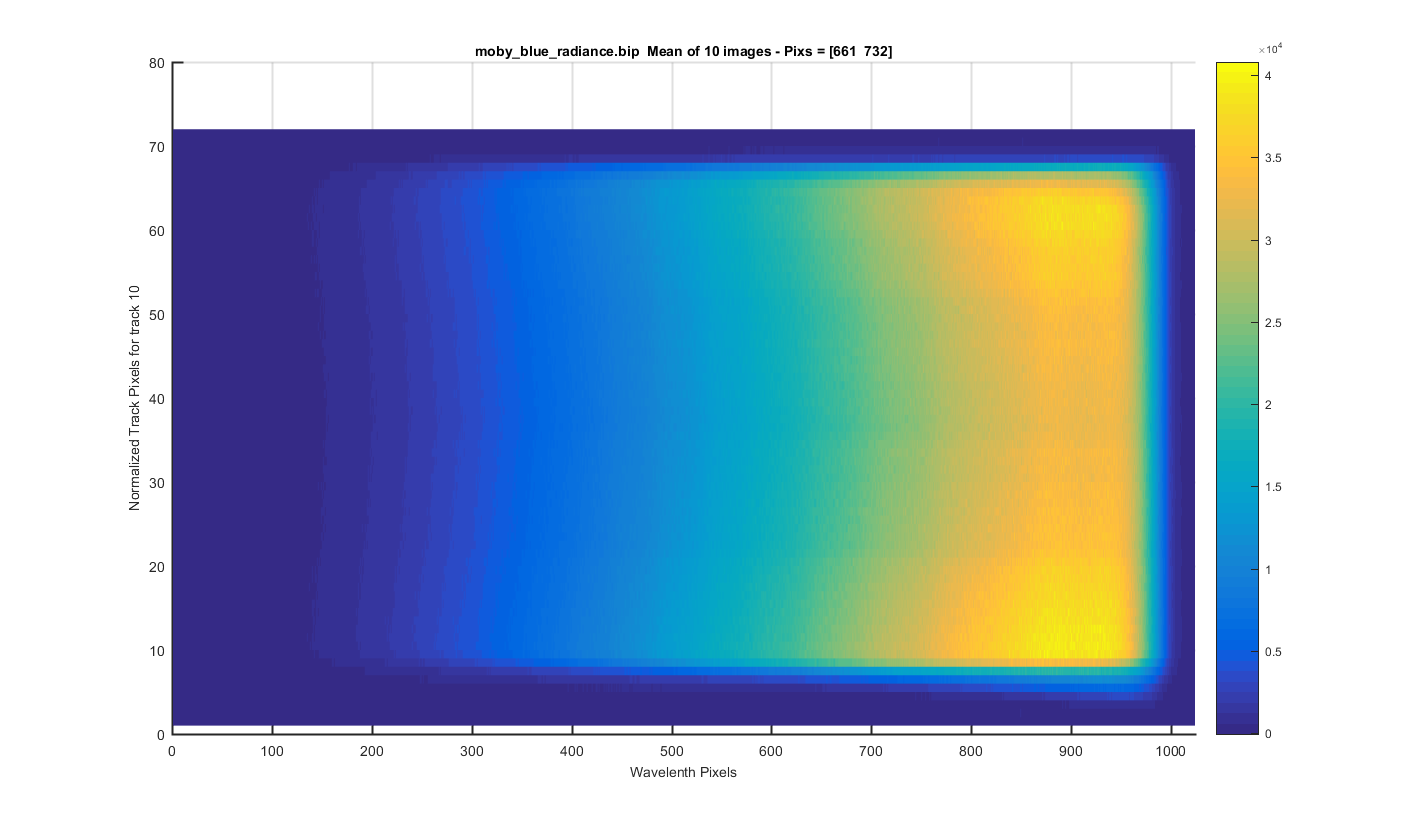
TRACK 10: The meaned image surface plot but for only one track so you can see each track zoomed in. The y-axis is the relative pixel for that track. The title contains the real pixels. I clicked to get these track positions so this will need to be refined in the future.
Figure 17
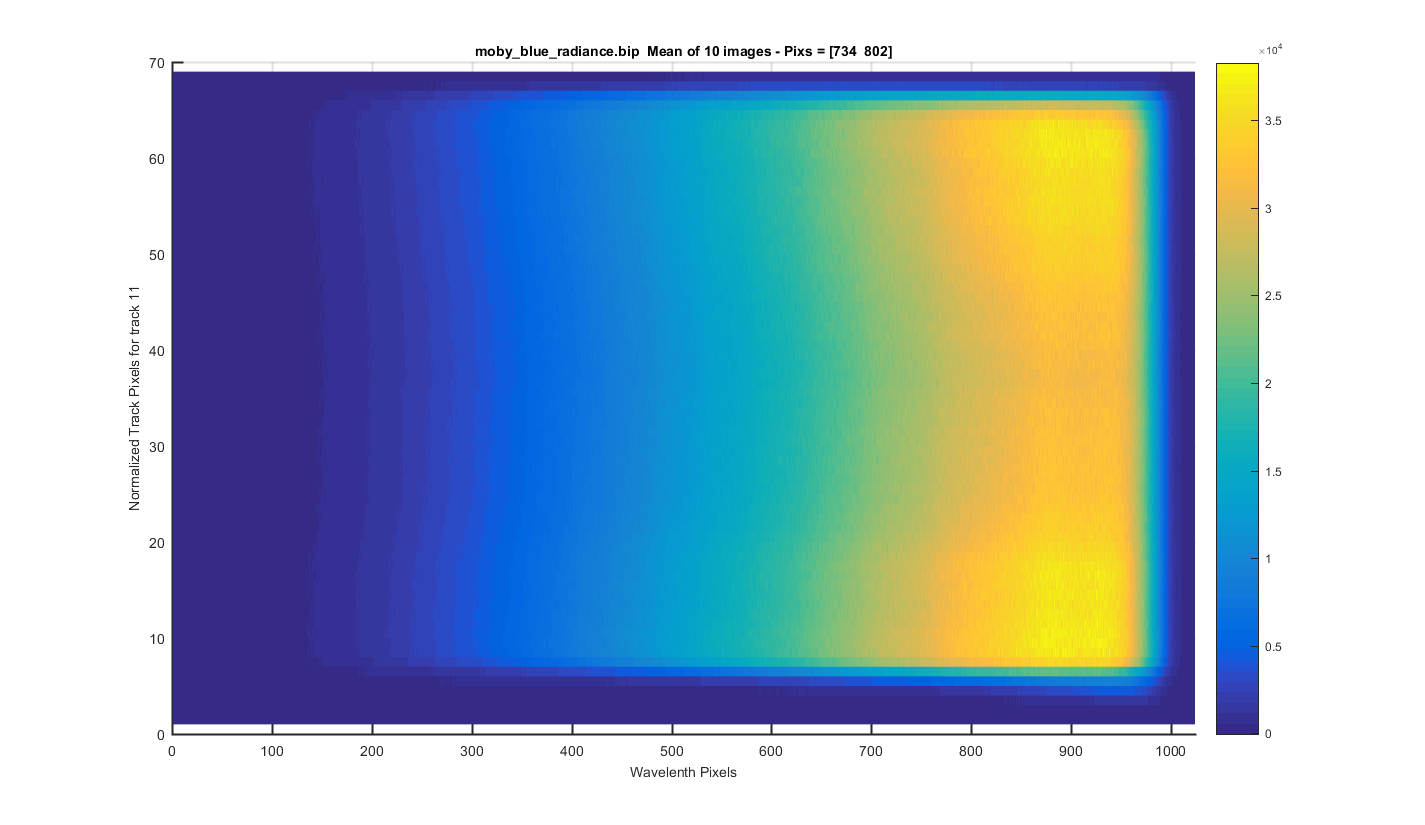
TRACK 11: The meaned image surface plot but for only one track so you can see each track zoomed in. The y-axis is the relative pixel for that track. The title contains the real pixels. I clicked to get these track positions so this will need to be refined in the future.
Figure 18
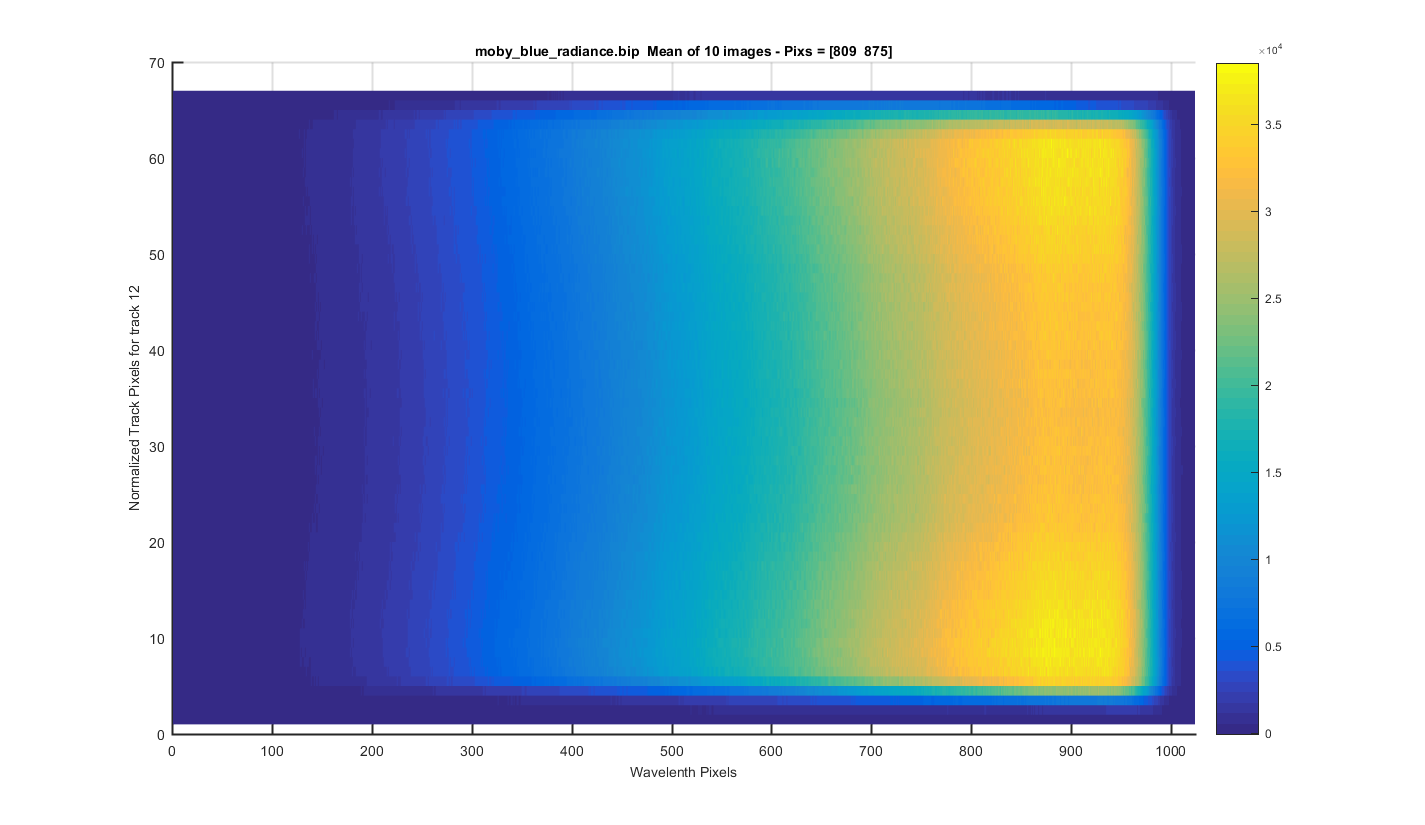
TRACK 12: The meaned image surface plot but for only one track so you can see each track zoomed in. The y-axis is the relative pixel for that track. The title contains the real pixels. I clicked to get these track positions so this will need to be refined in the future.
Figure 19
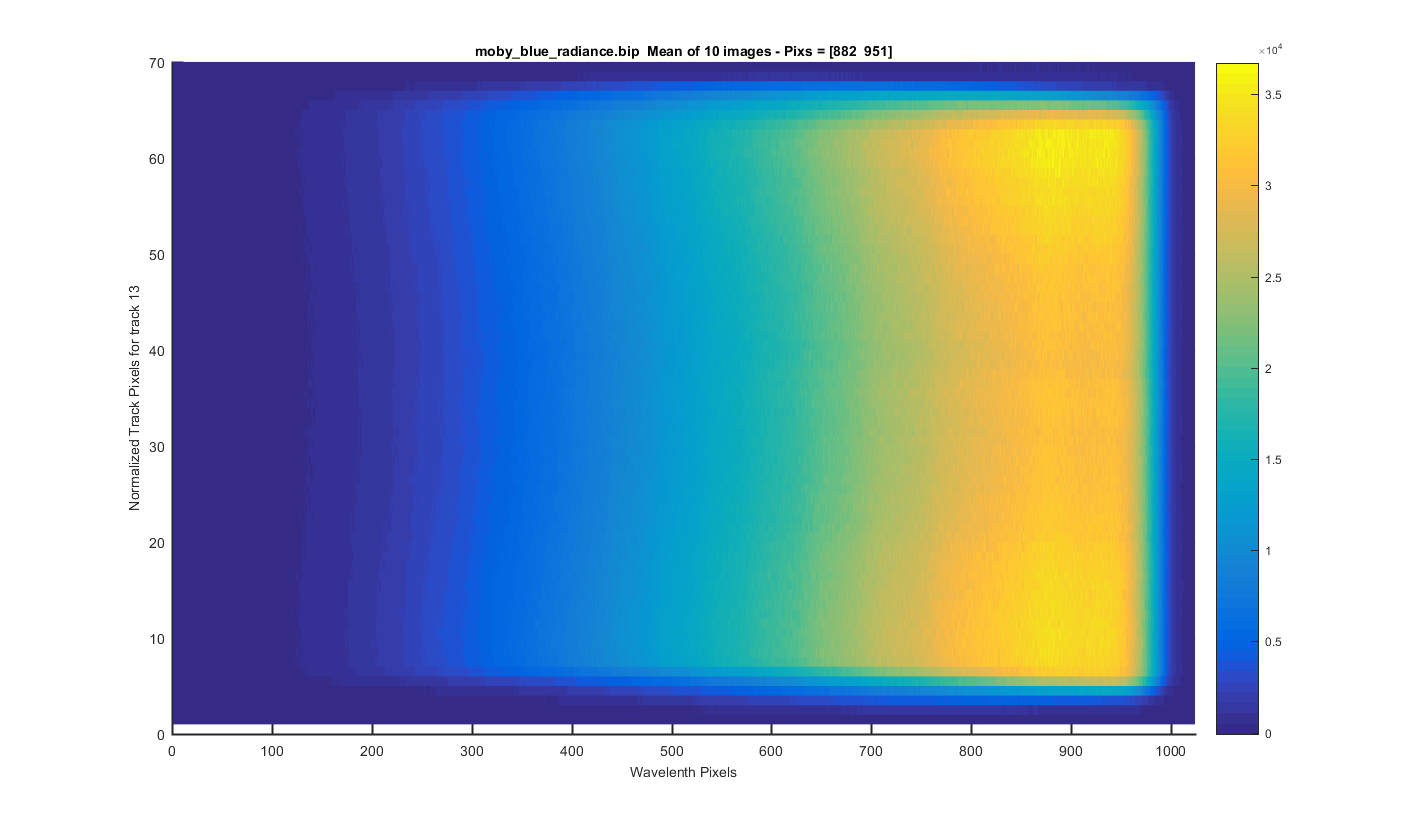
TRACK 13: The meaned image surface plot but for only one track so you can see each track zoomed in. The y-axis is the relative pixel for that track. The title contains the real pixels. I clicked to get these track positions so this will need to be refined in the future.
Figure 20
TRACK 14: The meaned image surface plot but for only one track so you can see each track zoomed in. The y-axis is the relative pixel for that track. The title contains the real pixels. I clicked to get these track positions so this will need to be refined in the future.
Figure 21
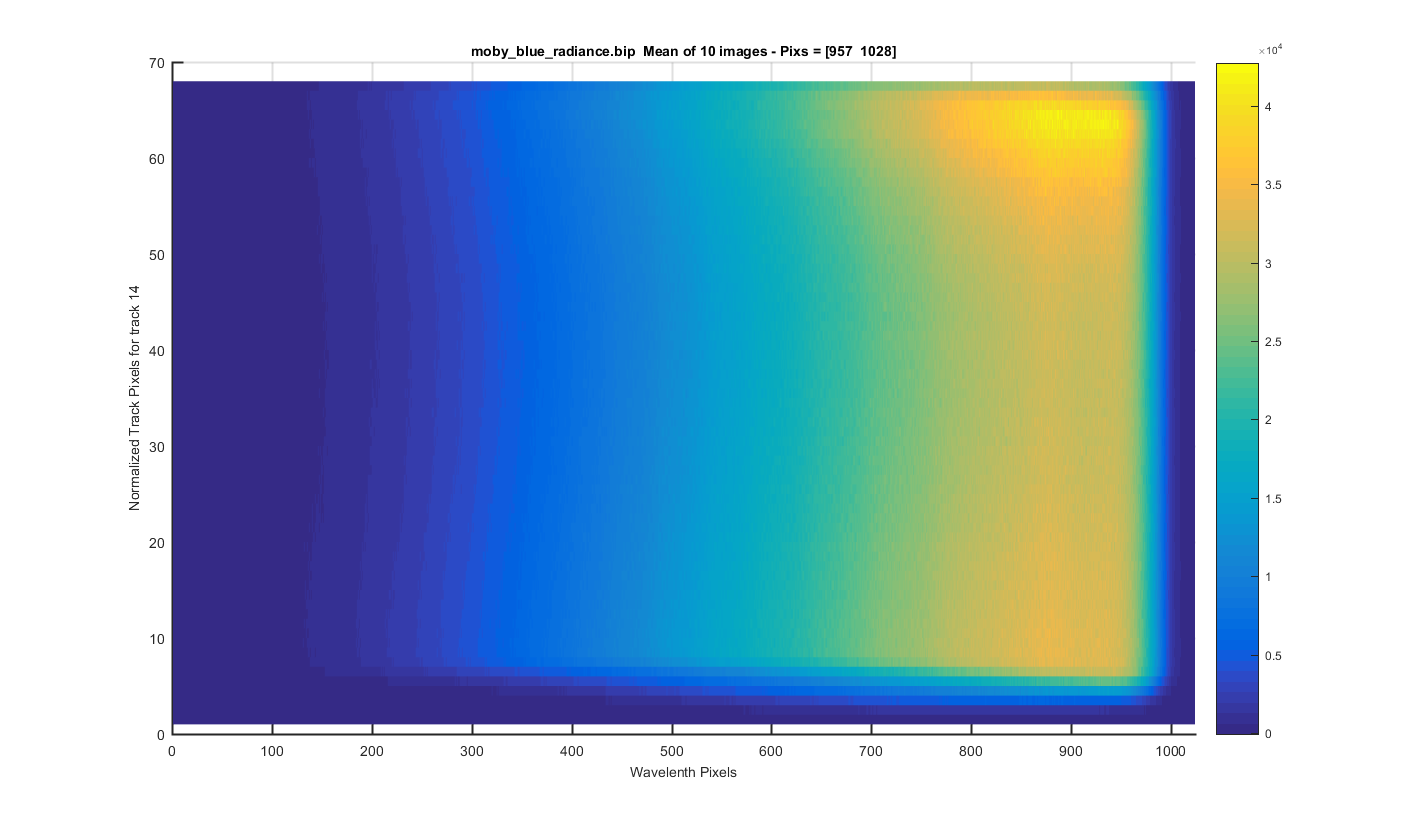
Figure 22
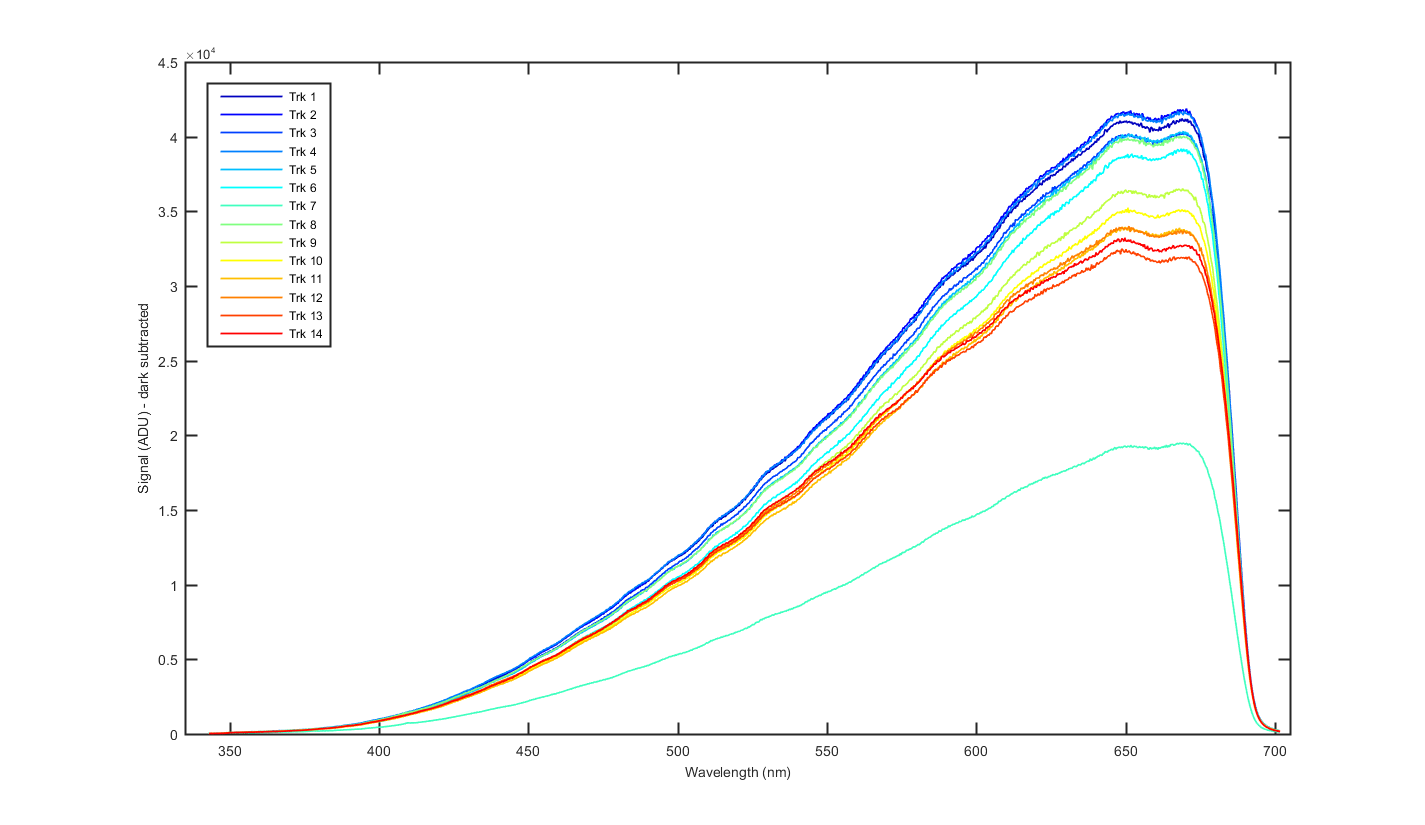
Figure 23
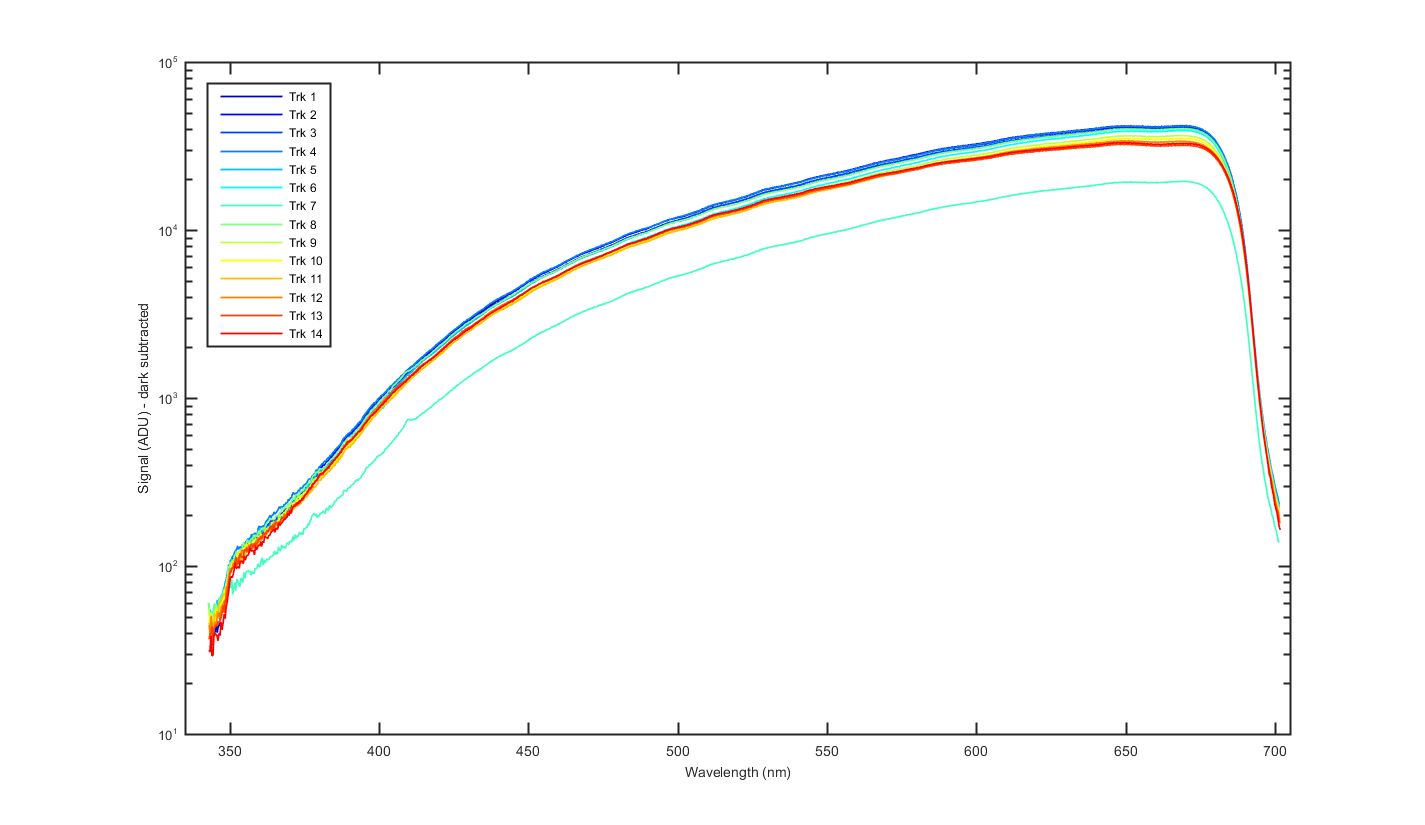
Figure 24