REVISION DATE: 08-Feb-2017 12:56:08
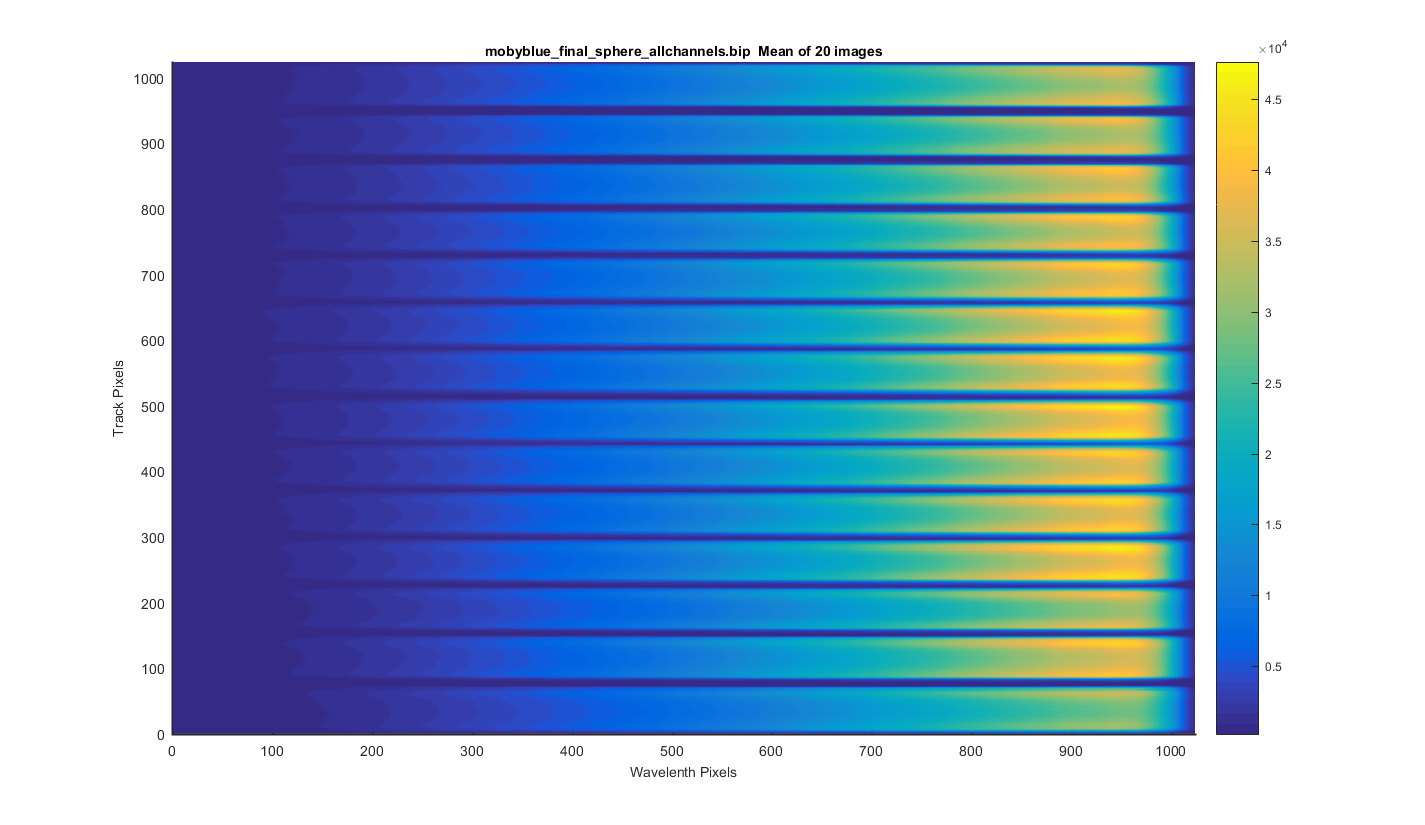
The sphere data with all the fibers illuminated. The file contains 20 images of the sphere source. All the data are dark subtracted. See each graph below for more detail.
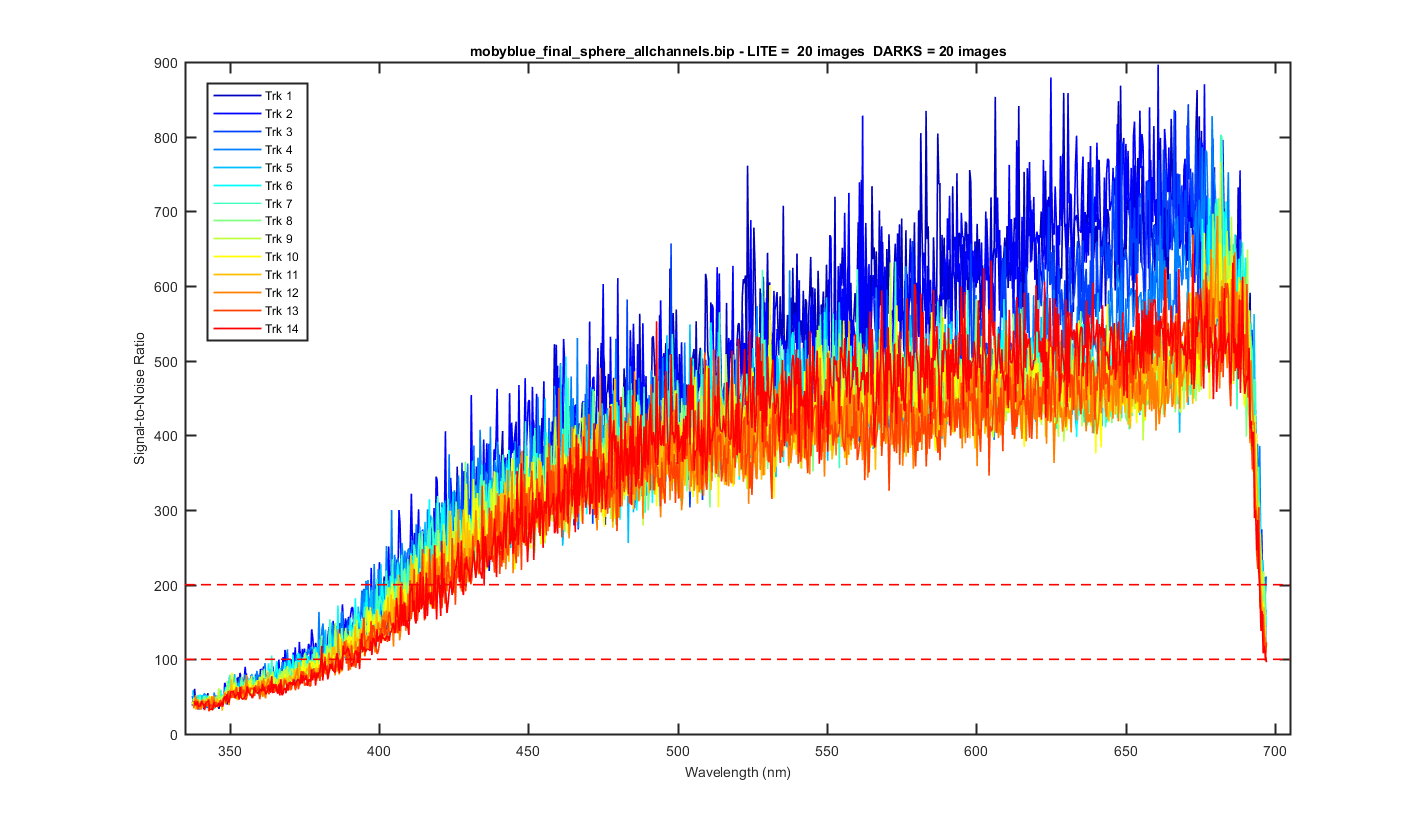
At the very bottom are the track data in linear and log and the signal to noise ratio calculated for each track.
I took the 20 images and meaned them to get the surface plot below.
Figure 1
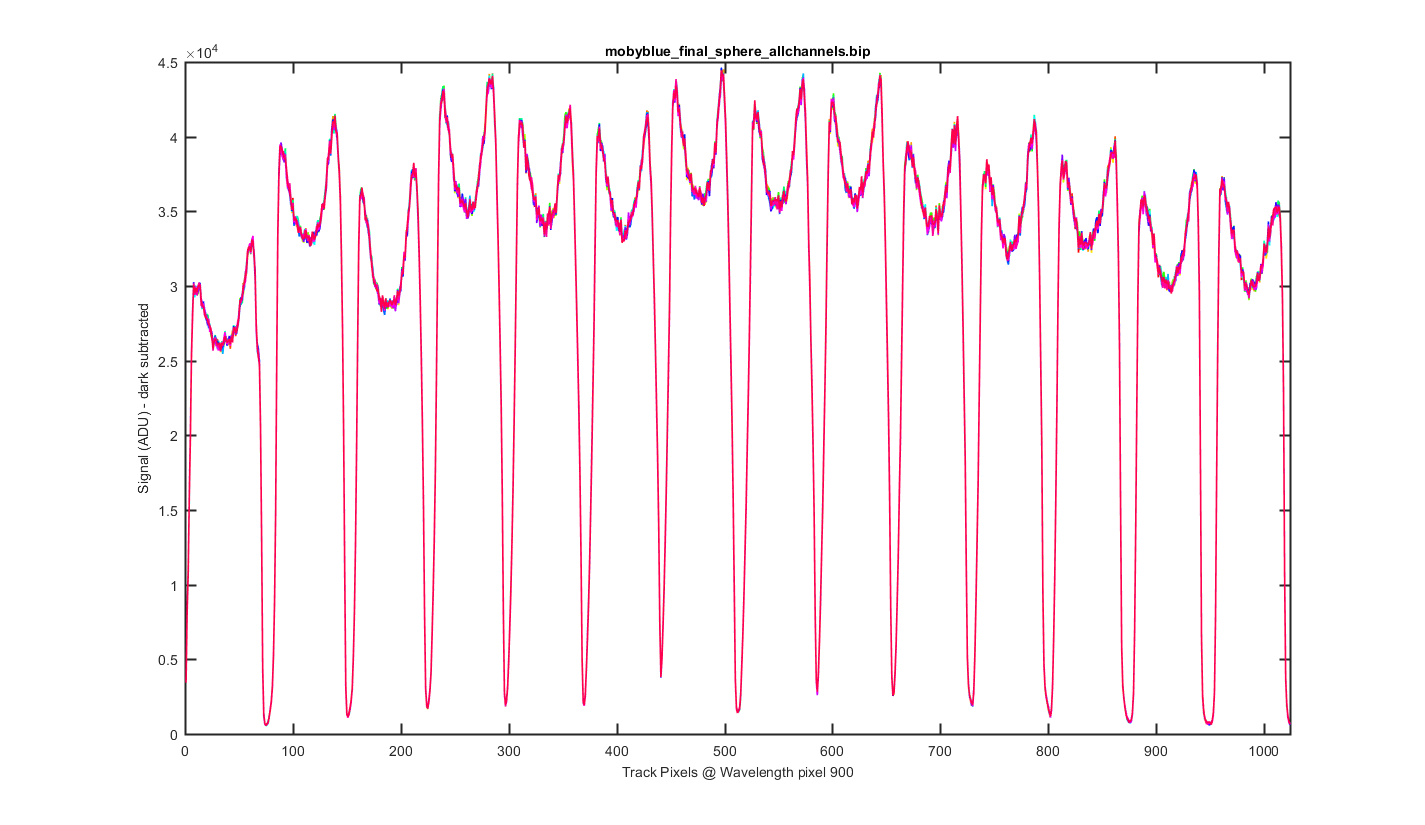
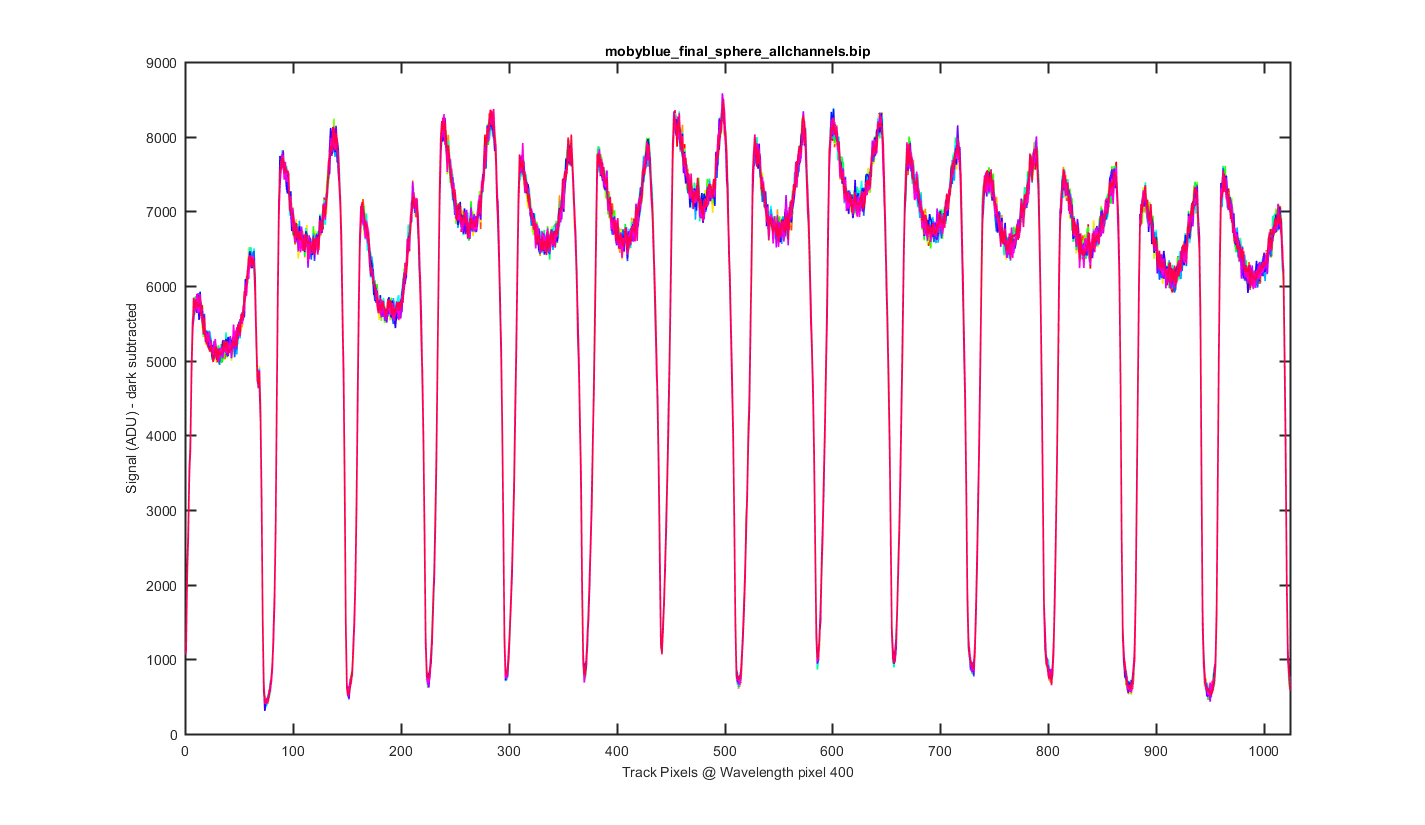
This is a cross section through the tracks at wavelength pixel 900, with one line for each of the 20 images. The tracks and their shapes look really stable.
Figure 2
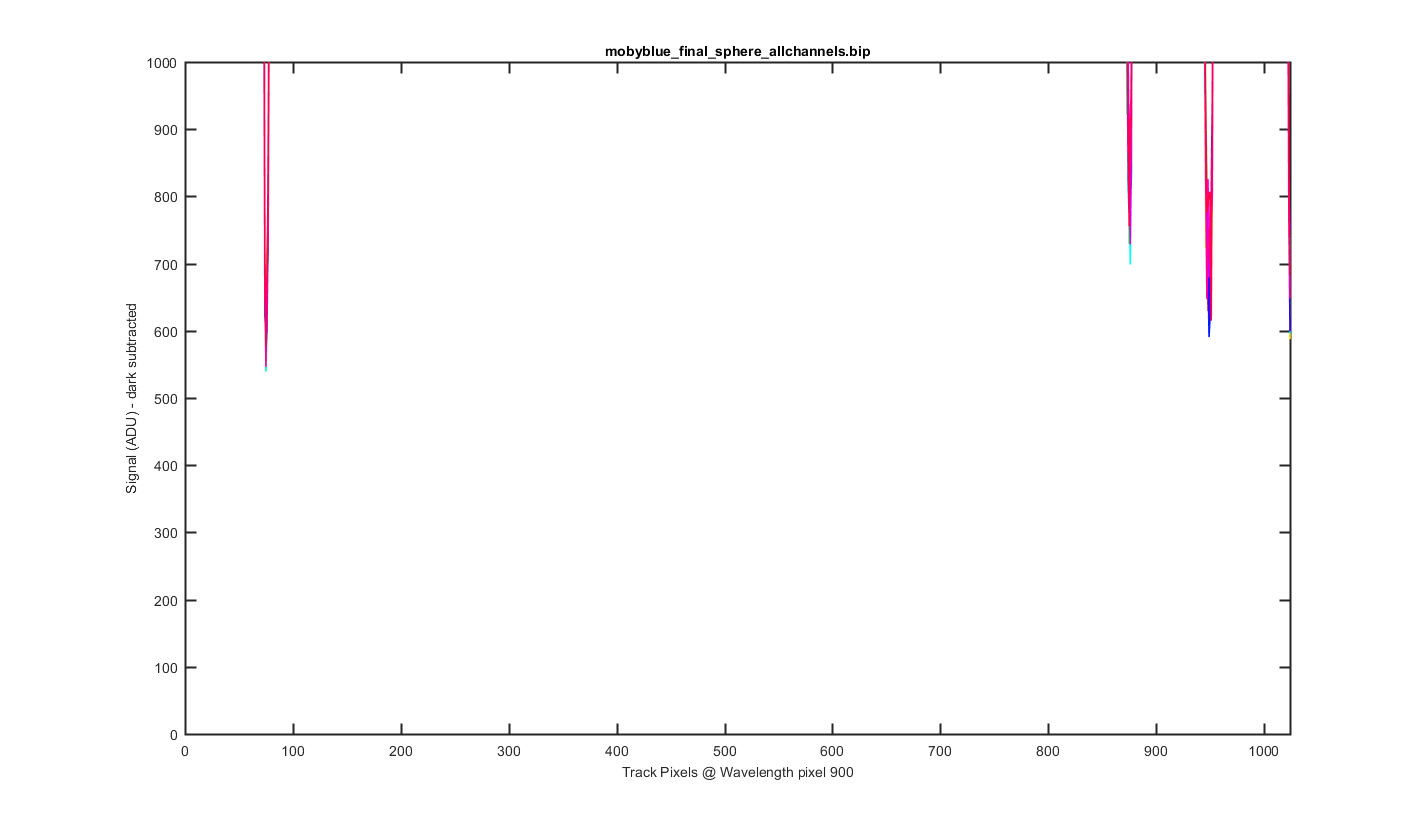
Same as the previous graph but zoomed into the bottom to see the level of the darks between the tracks.
Figure 3
Same as figure 2 but for Wavelength pixel 400.
Figure 4
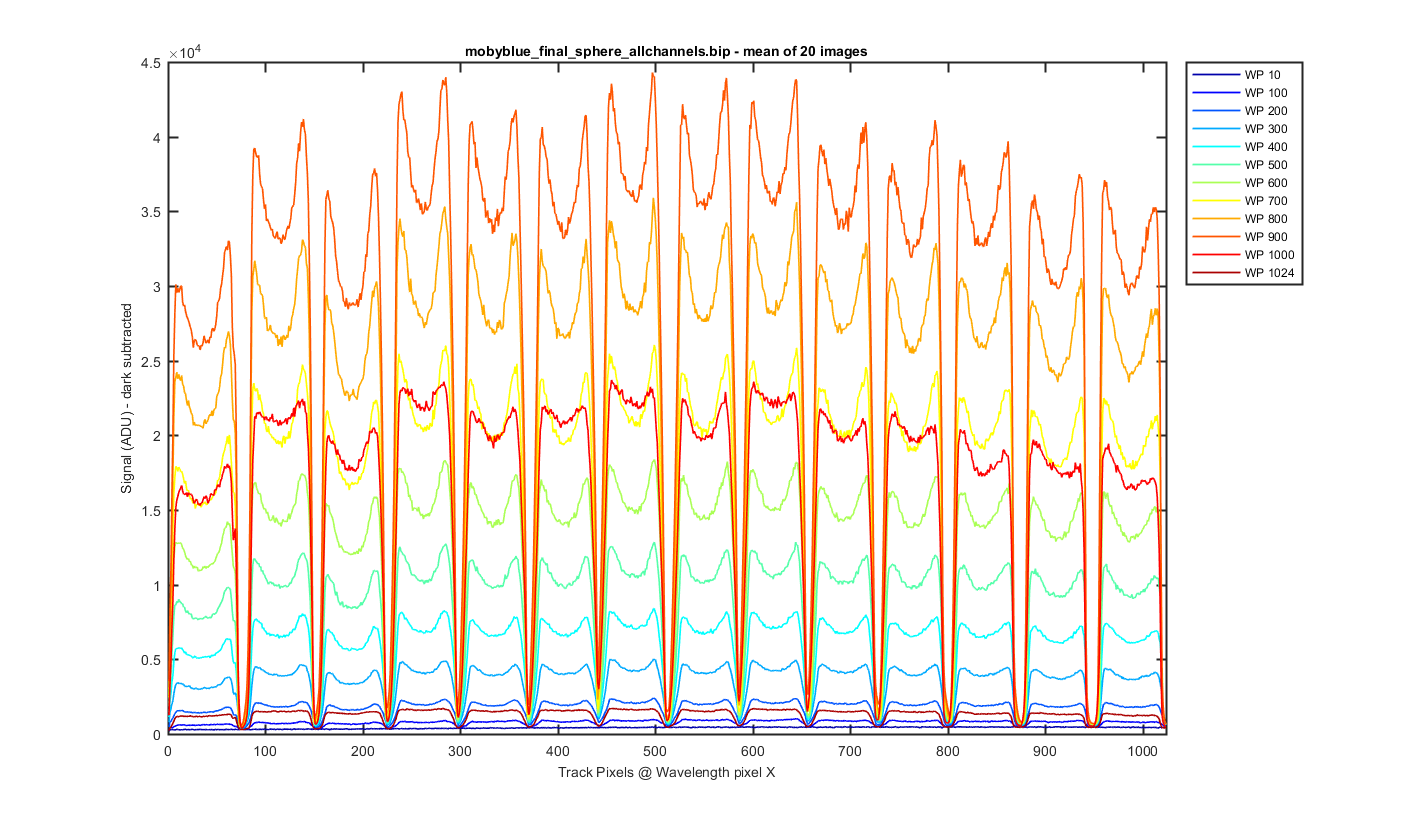
Again this is the mean image with slices thought the image at different wavelength pixels.
Figure 5
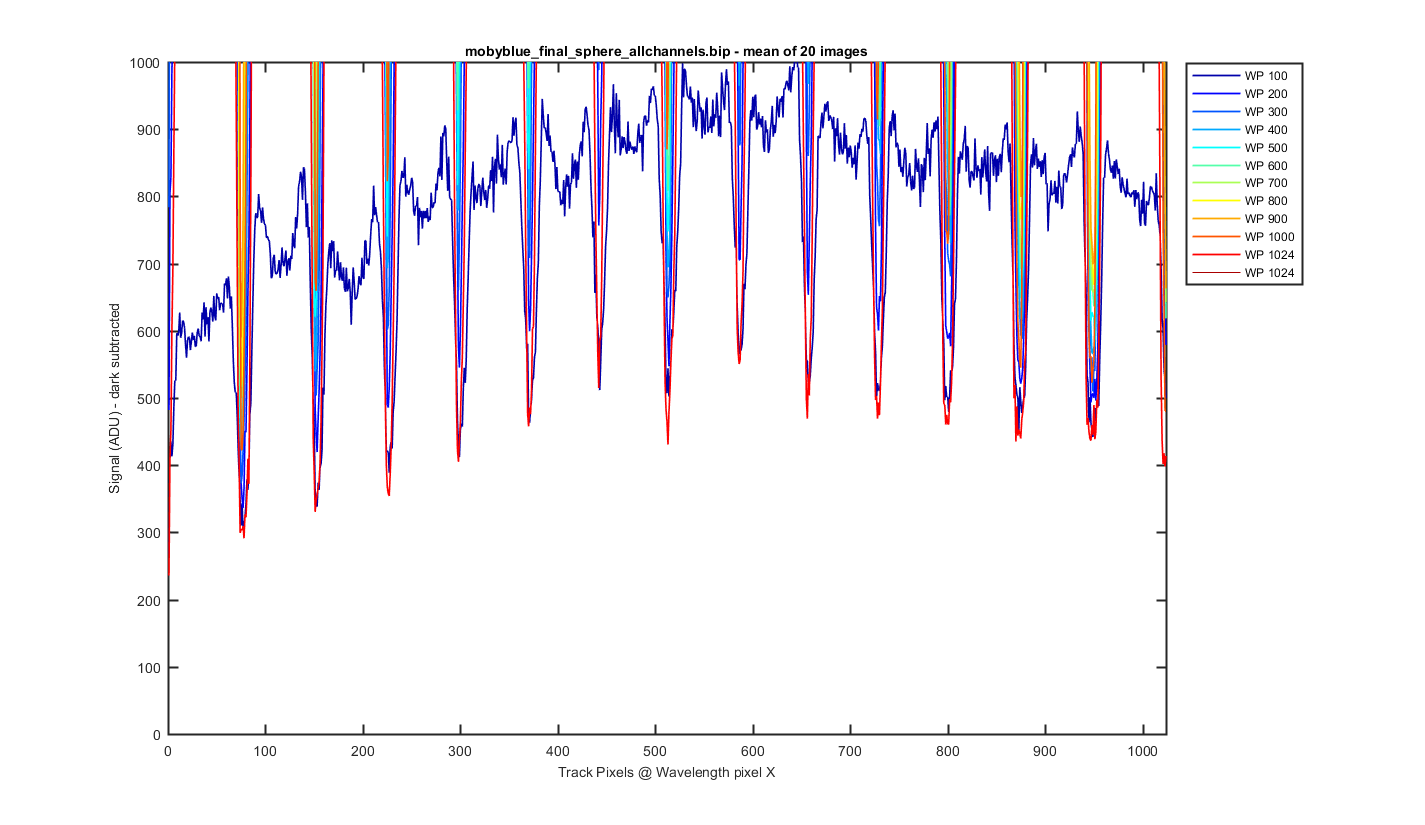
Same as figure 5 but zoomed to the bottom so you can see the darks between the tracks.
Figure 6
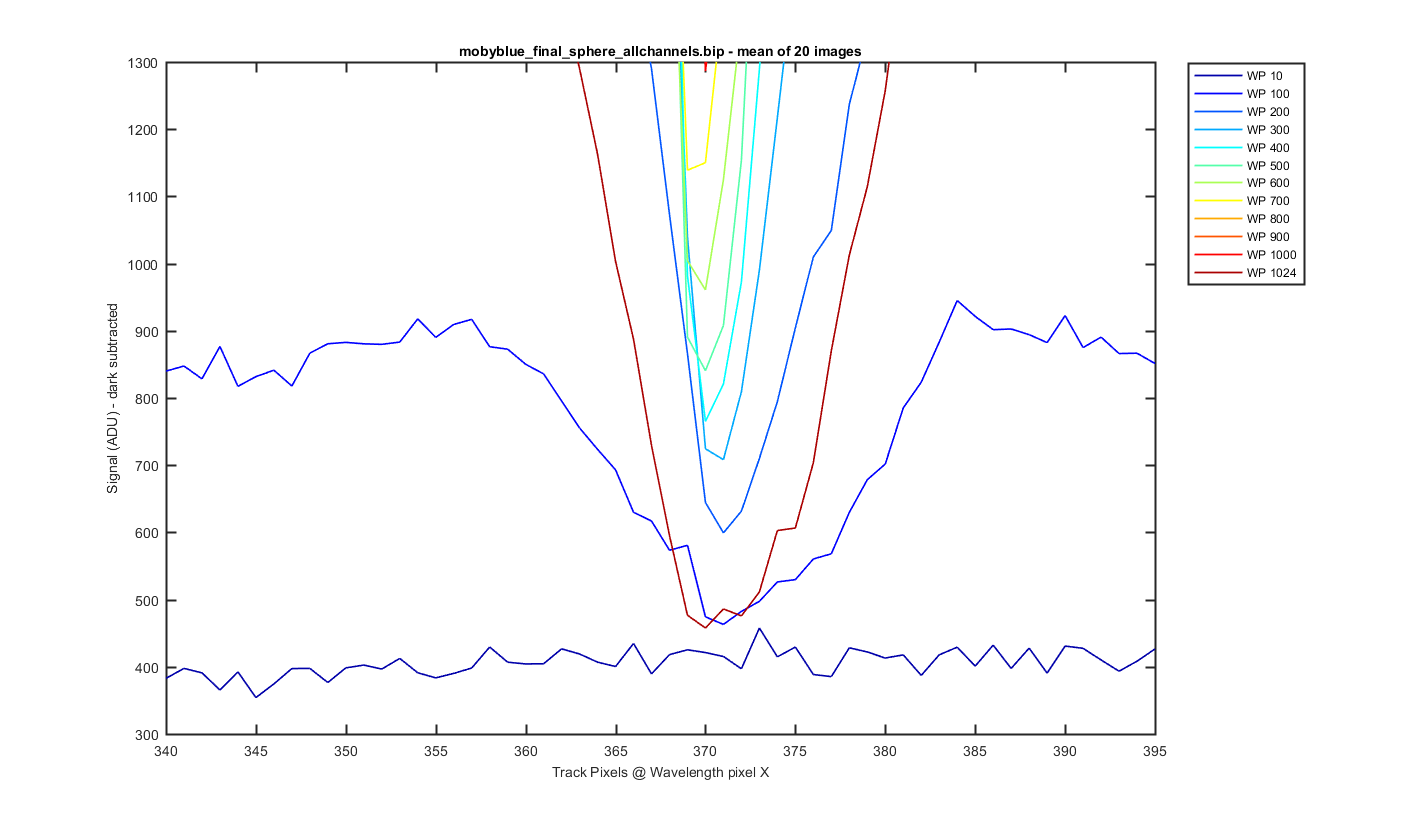
Same as figure 6 but zoomed to the dark space between track 5 and 6
Figure 7
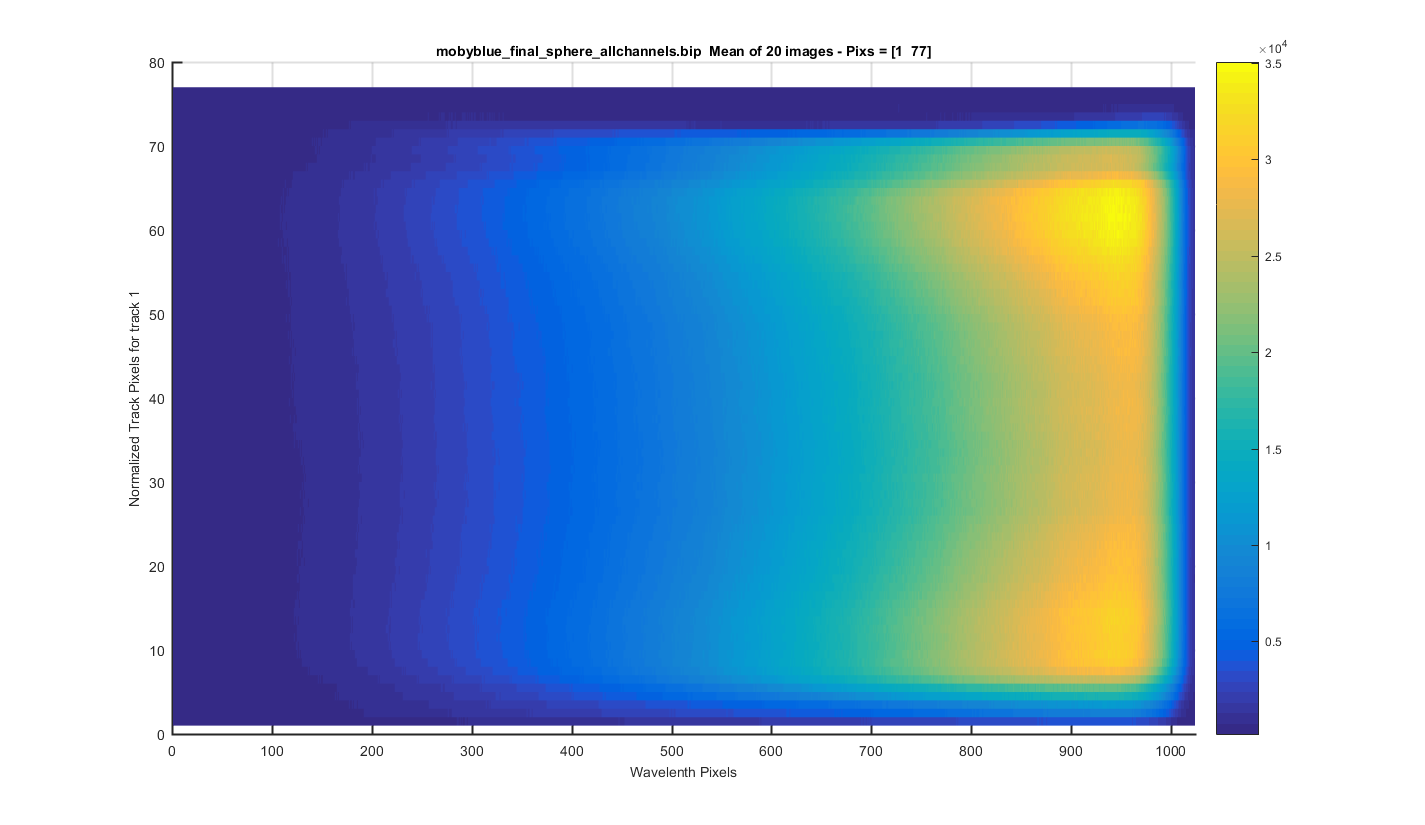
TRACK 1: The meaned image surface plot but for only one track so you can see each track zoomed in. The y-axis is the relative pixel for that track. The title contains the real pixels. I clicked to get these track positions so this will need to be refined in the future.
Figure 8
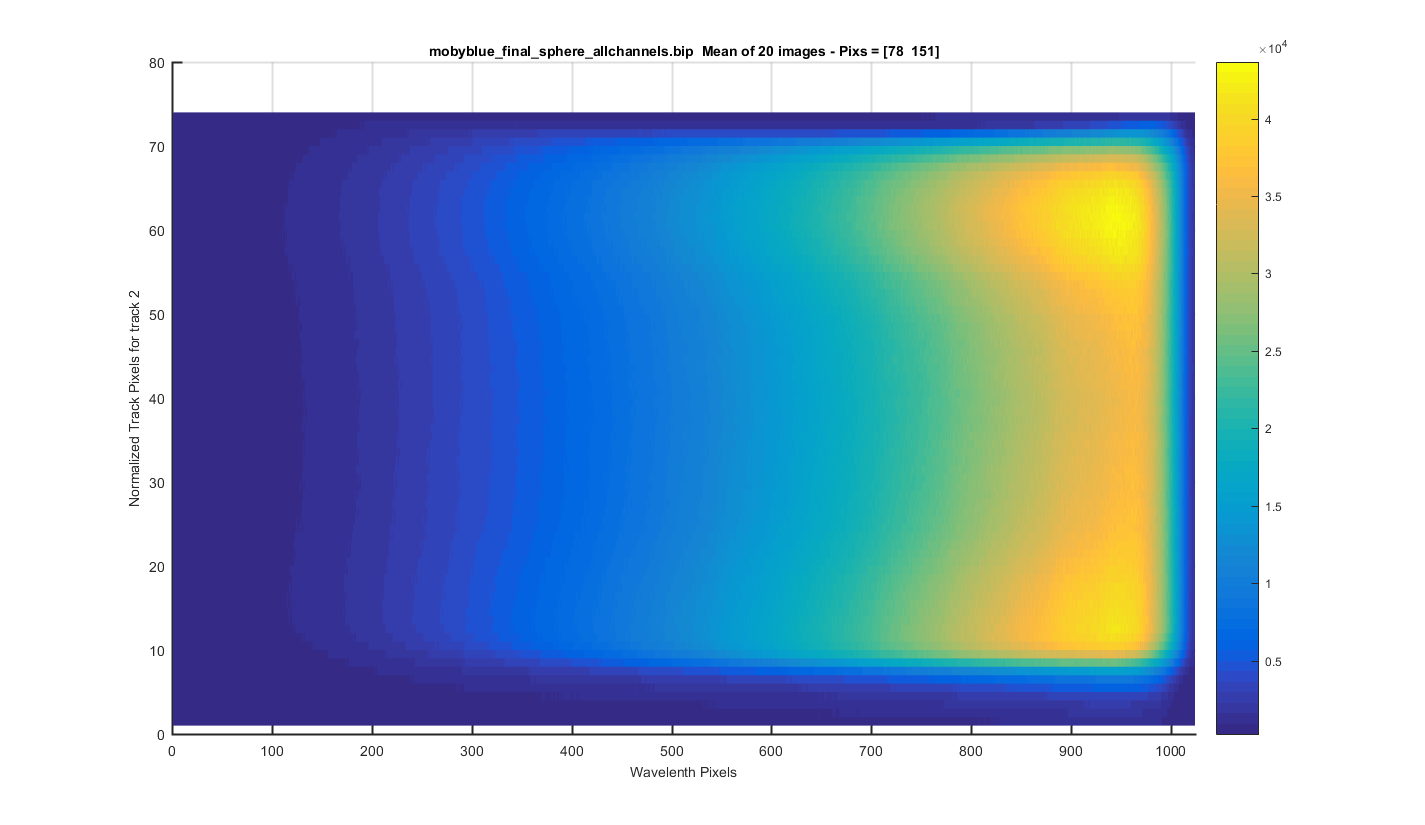
TRACK 2: The meaned image surface plot but for only one track so you can see each track zoomed in. The y-axis is the relative pixel for that track. The title contains the real pixels. I clicked to get these track positions so this will need to be refined in the future.
Figure 9
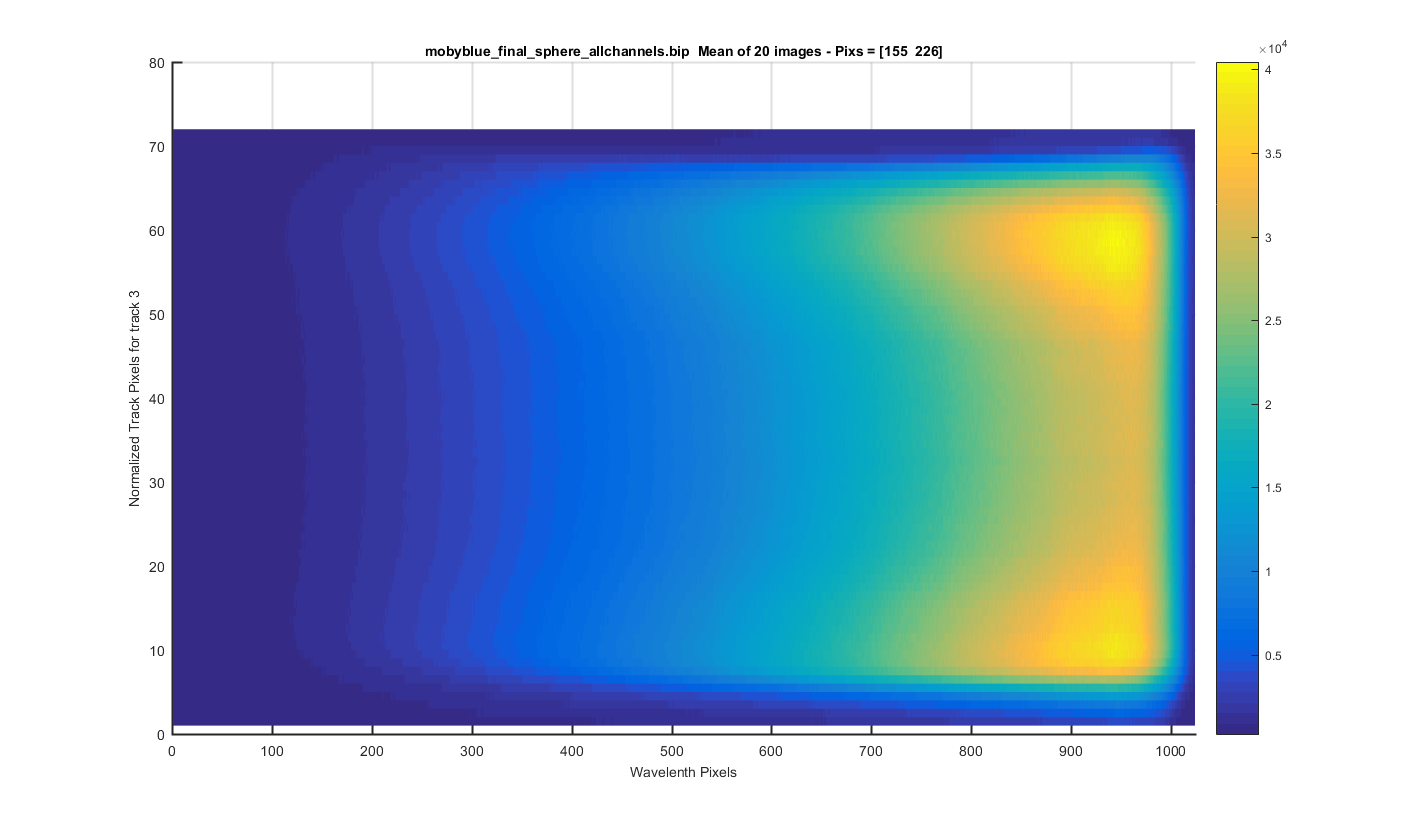
TRACK 3: The meaned image surface plot but for only one track so you can see each track zoomed in. The y-axis is the relative pixel for that track. The title contains the real pixels. I clicked to get these track positions so this will need to be refined in the future.
Figure 10
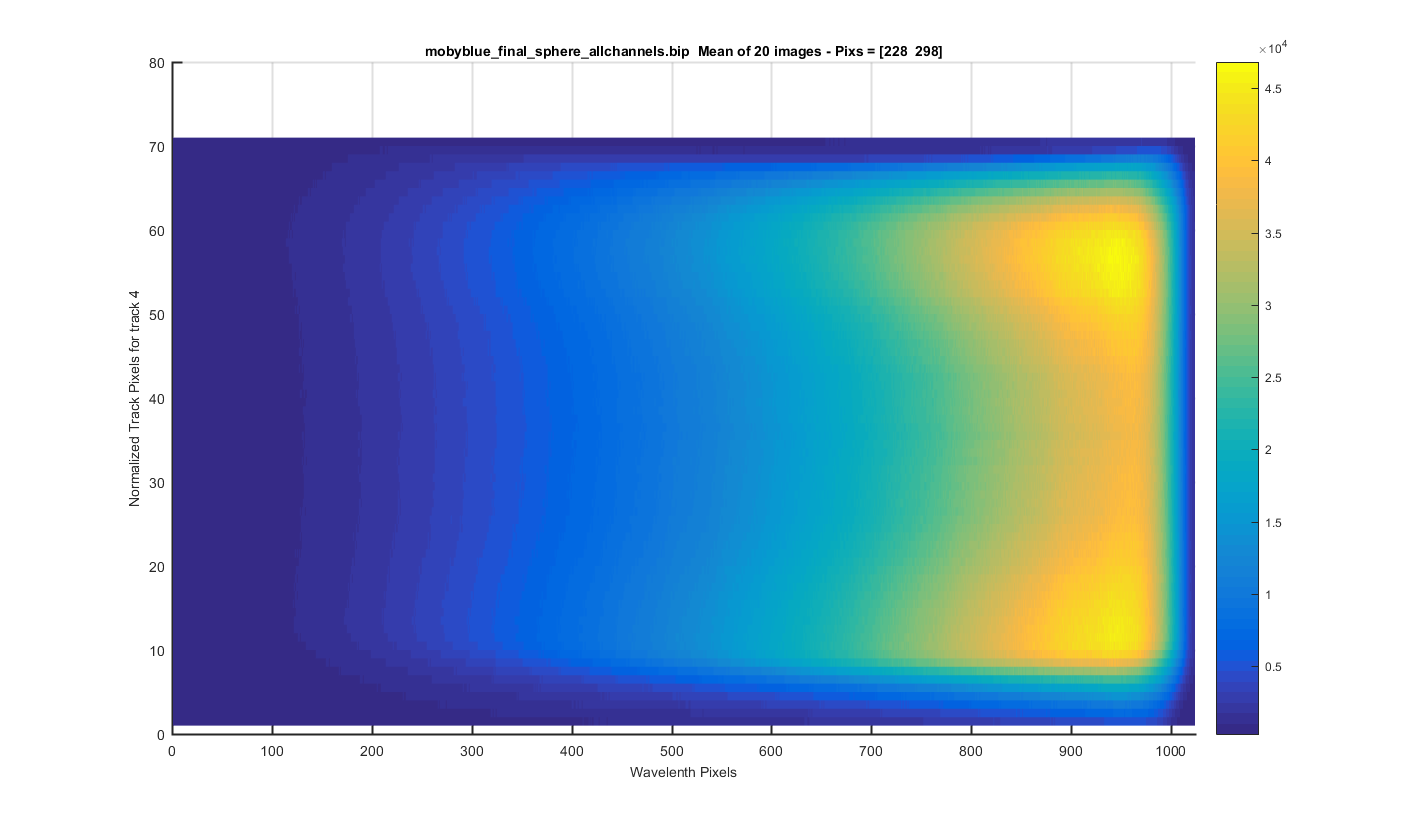
TRACK 4: The meaned image surface plot but for only one track so you can see each track zoomed in. The y-axis is the relative pixel for that track. The title contains the real pixels. I clicked to get these track positions so this will need to be refined in the future.
Figure 11
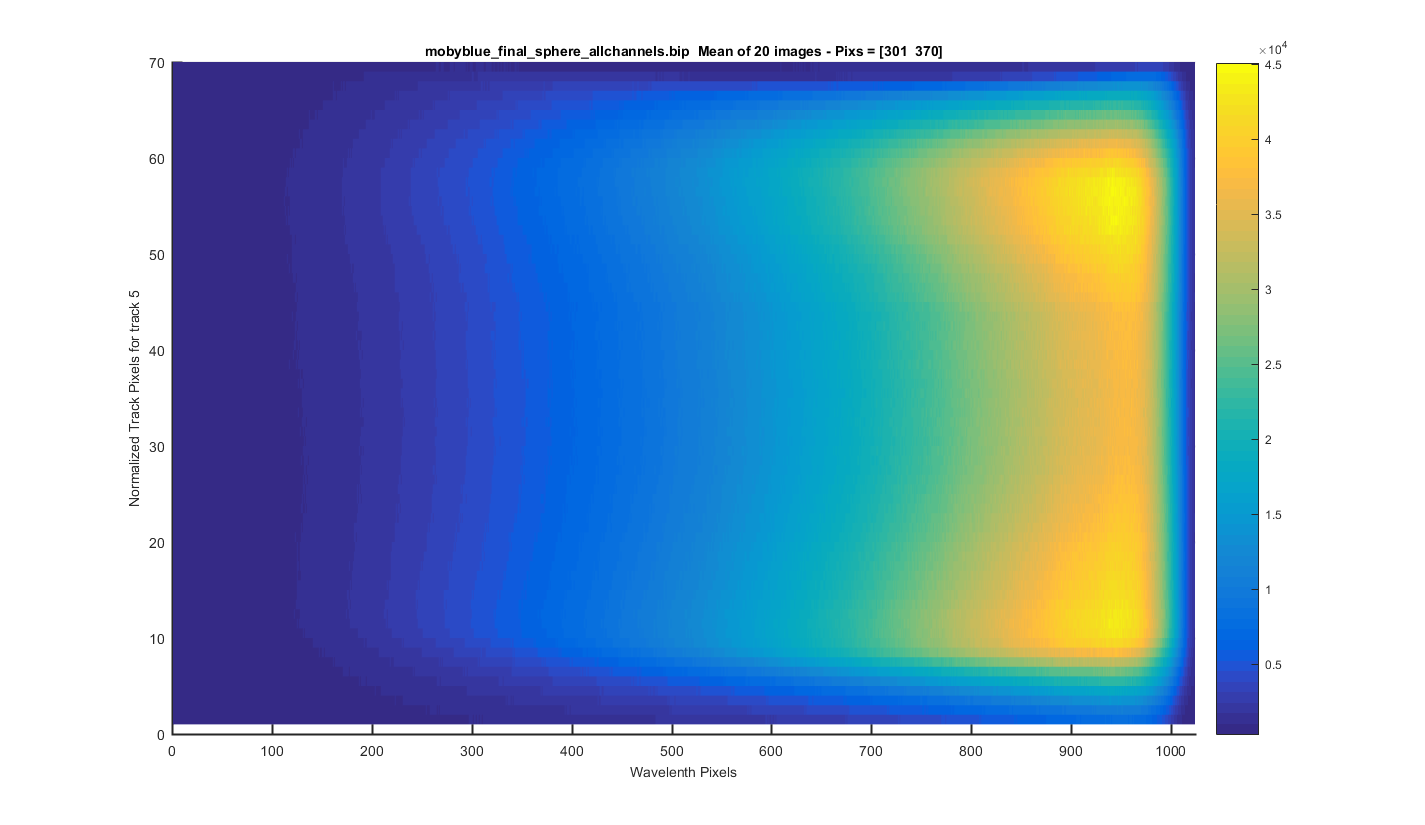
TRACK 5: The meaned image surface plot but for only one track so you can see each track zoomed in. The y-axis is the relative pixel for that track. The title contains the real pixels. I clicked to get these track positions so this will need to be refined in the future.
Figure 12
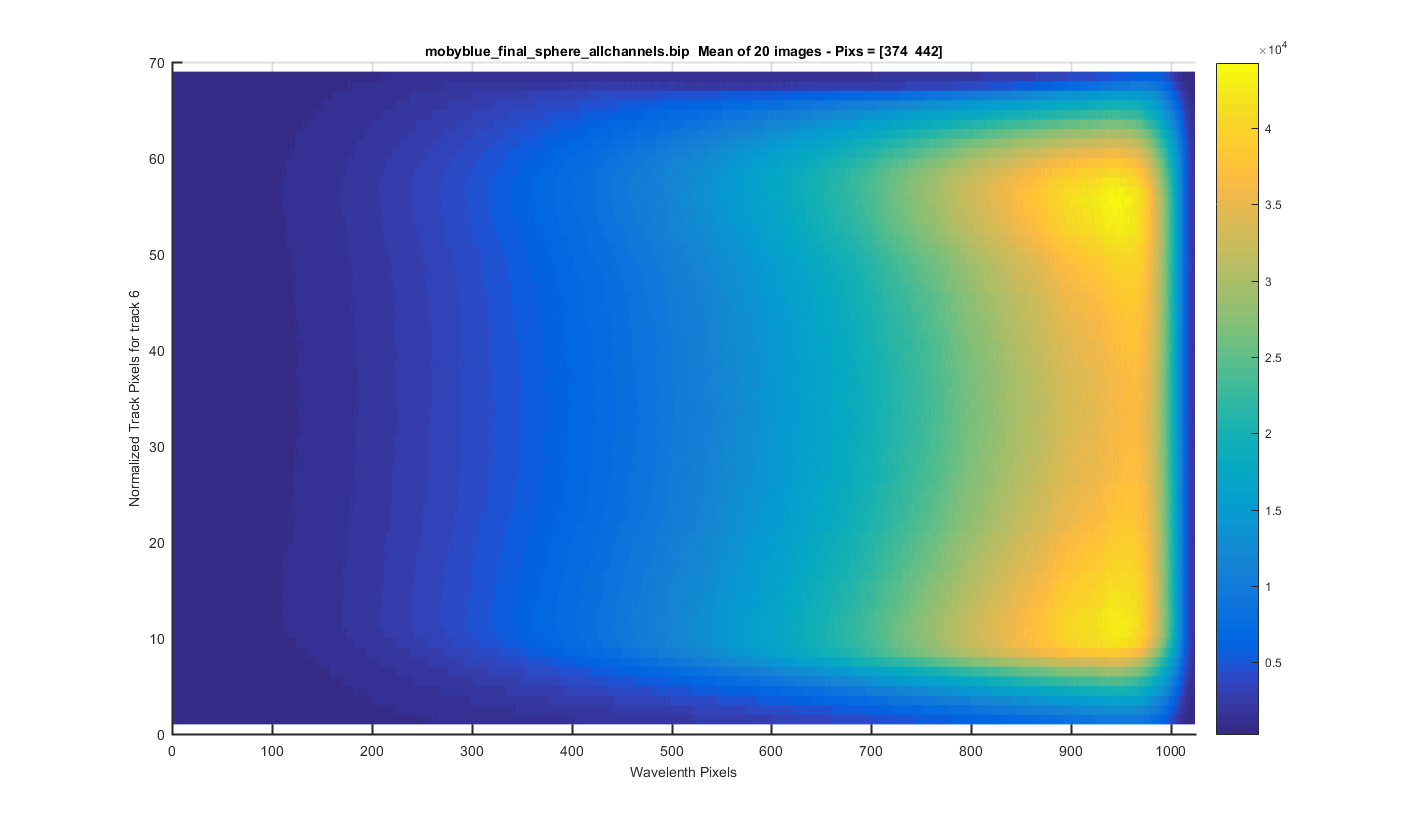
TRACK 6: The meaned image surface plot but for only one track so you can see each track zoomed in. The y-axis is the relative pixel for that track. The title contains the real pixels. I clicked to get these track positions so this will need to be refined in the future.
Figure 13
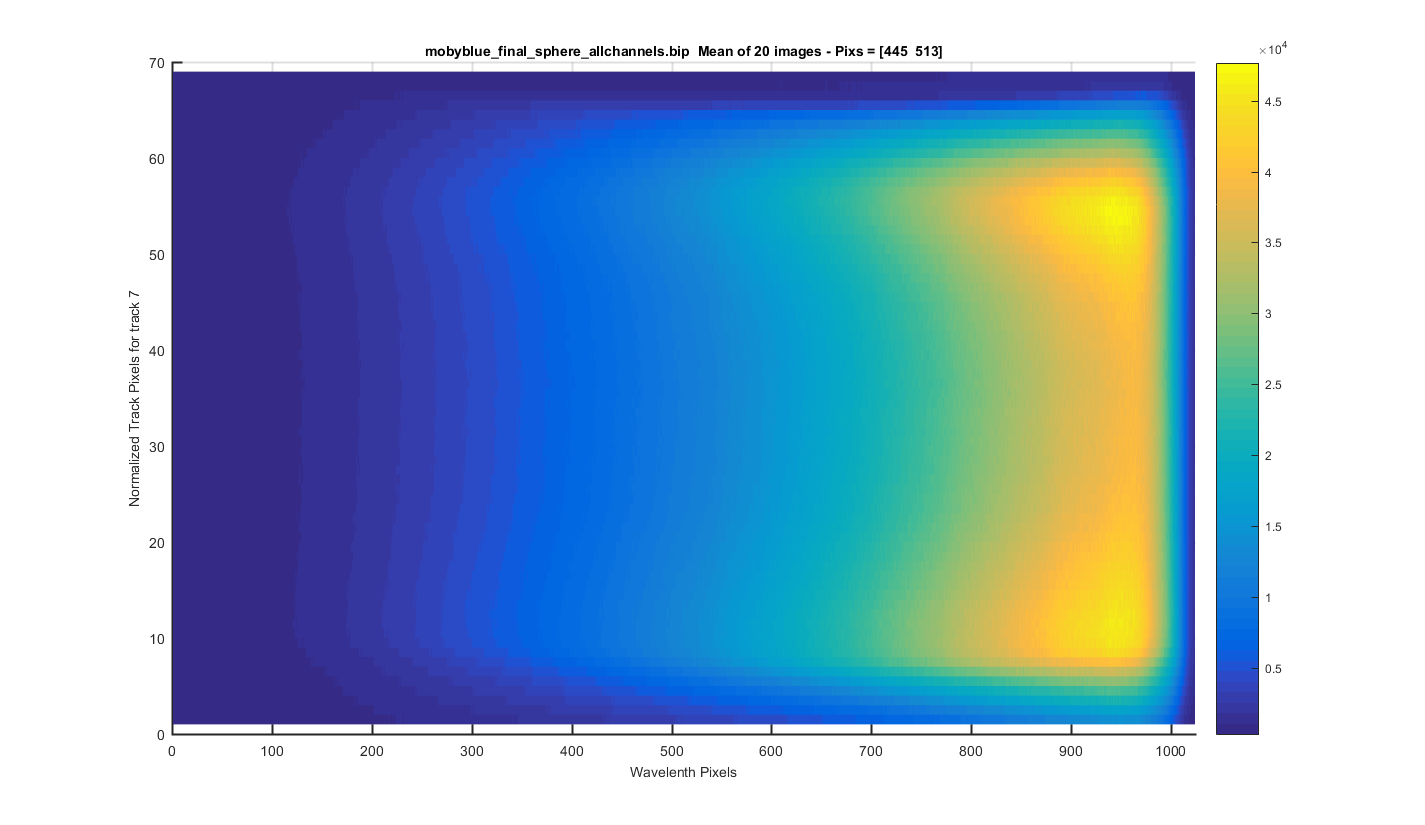
TRACK 7: The meaned image surface plot but for only one track so you can see each track zoomed in. The y-axis is the relative pixel for that track. The title contains the real pixels. I clicked to get these track positions so this will need to be refined in the future.
Figure 14
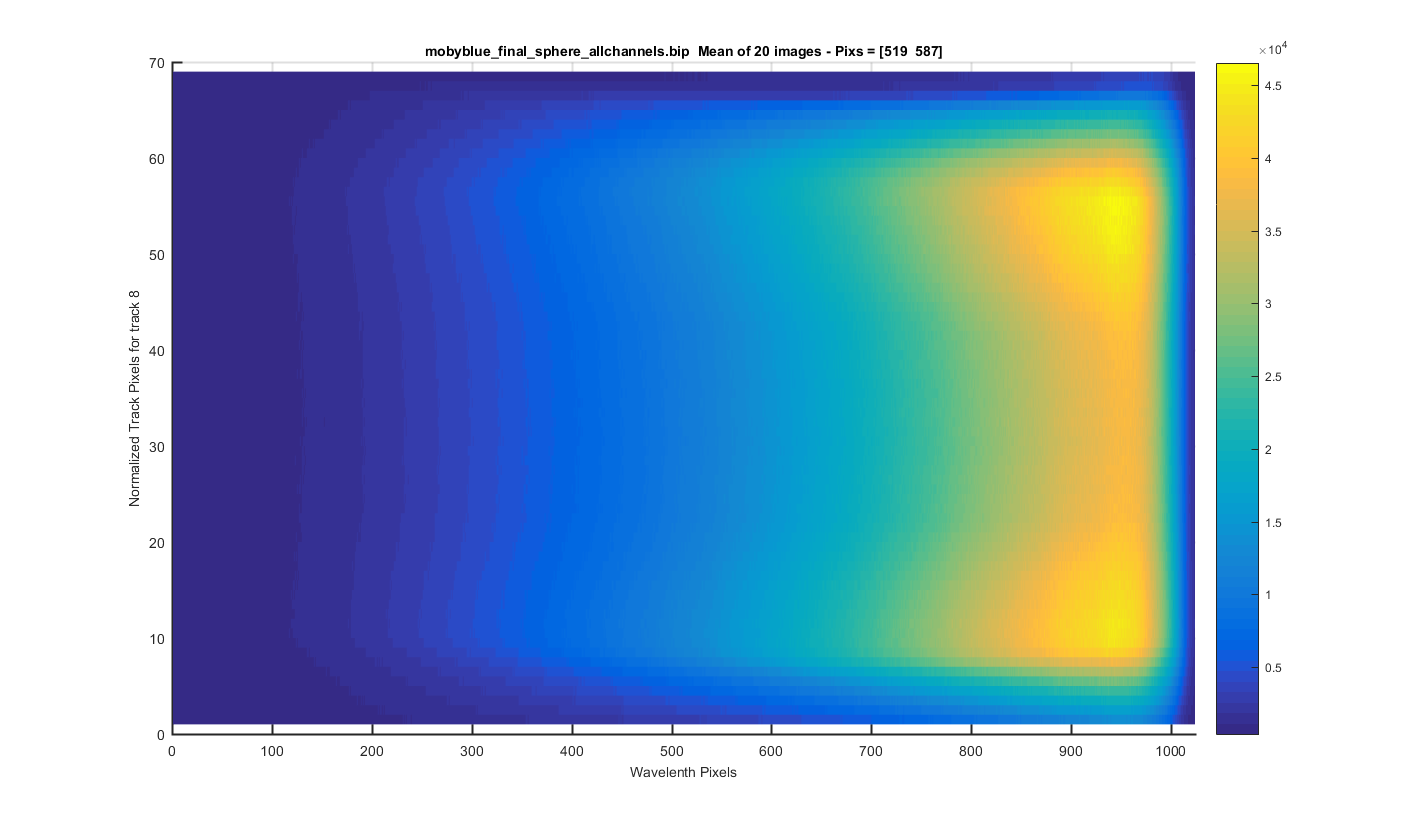
TRACK 8: The meaned image surface plot but for only one track so you can see each track zoomed in. The y-axis is the relative pixel for that track. The title contains the real pixels. I clicked to get these track positions so this will need to be refined in the future.
Figure 15
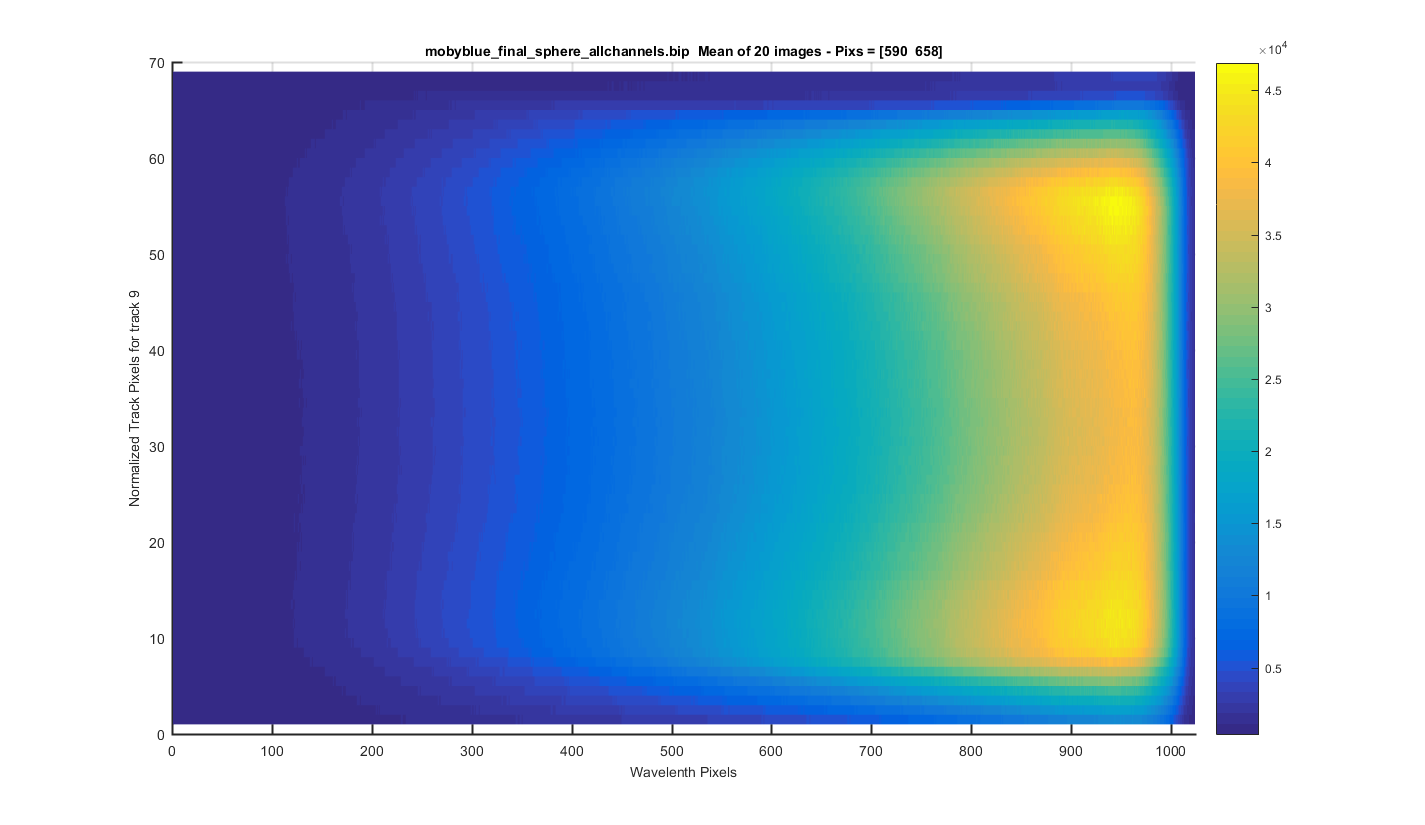
TRACK 9: The meaned image surface plot but for only one track so you can see each track zoomed in. The y-axis is the relative pixel for that track. The title contains the real pixels. I clicked to get these track positions so this will need to be refined in the future.
Figure 16
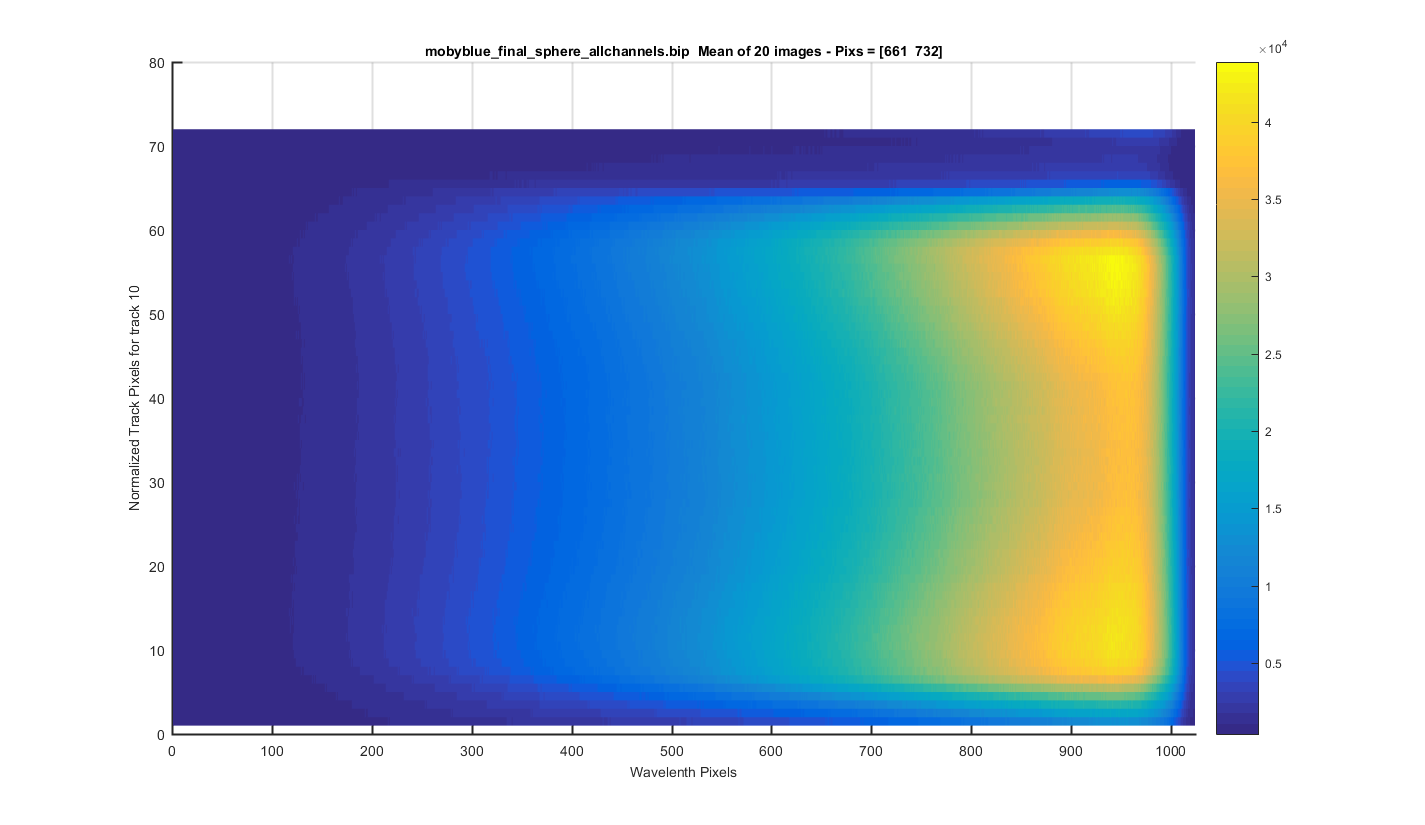
TRACK 10: The meaned image surface plot but for only one track so you can see each track zoomed in. The y-axis is the relative pixel for that track. The title contains the real pixels. I clicked to get these track positions so this will need to be refined in the future.
Figure 17
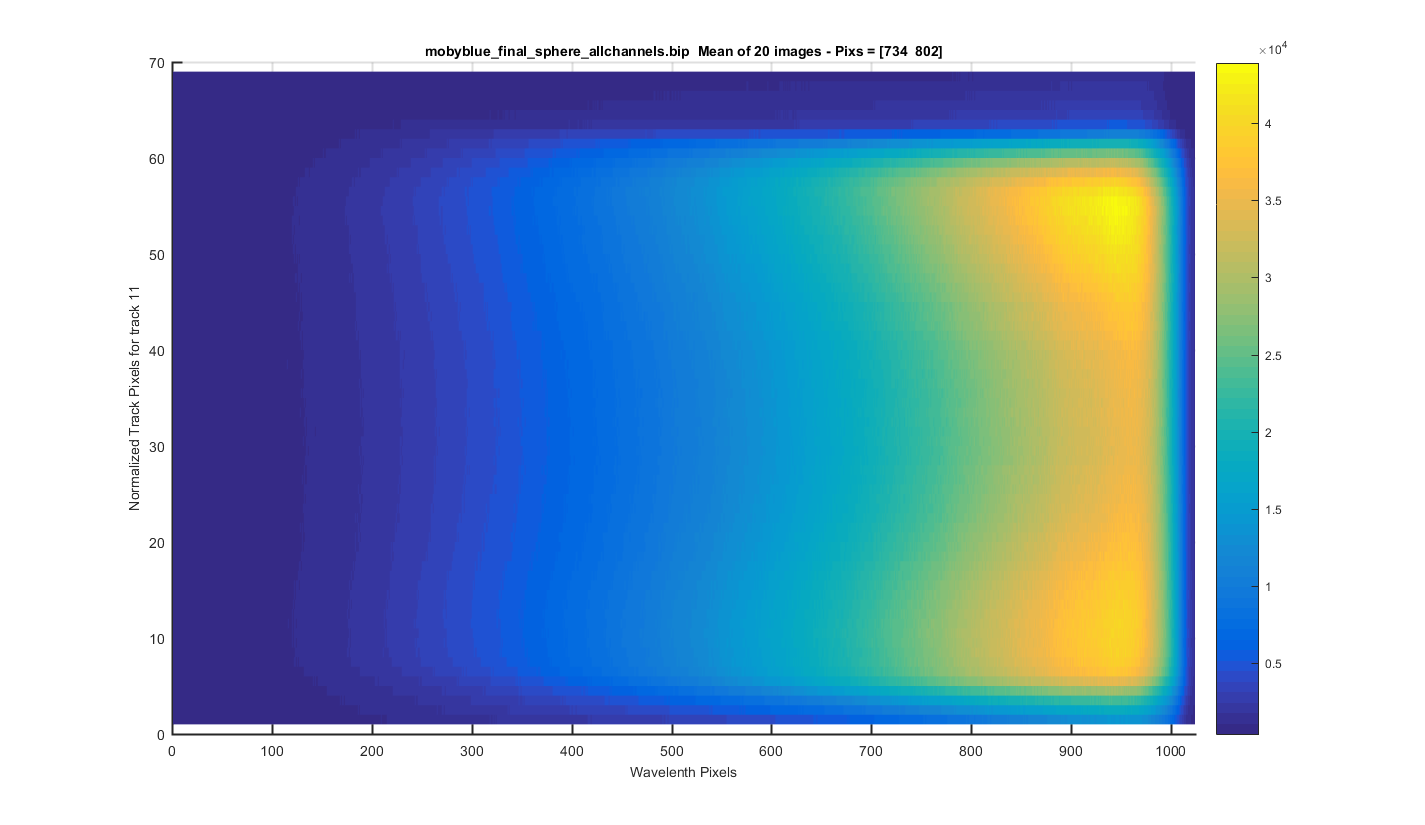
TRACK 11: The meaned image surface plot but for only one track so you can see each track zoomed in. The y-axis is the relative pixel for that track. The title contains the real pixels. I clicked to get these track positions so this will need to be refined in the future.
Figure 18
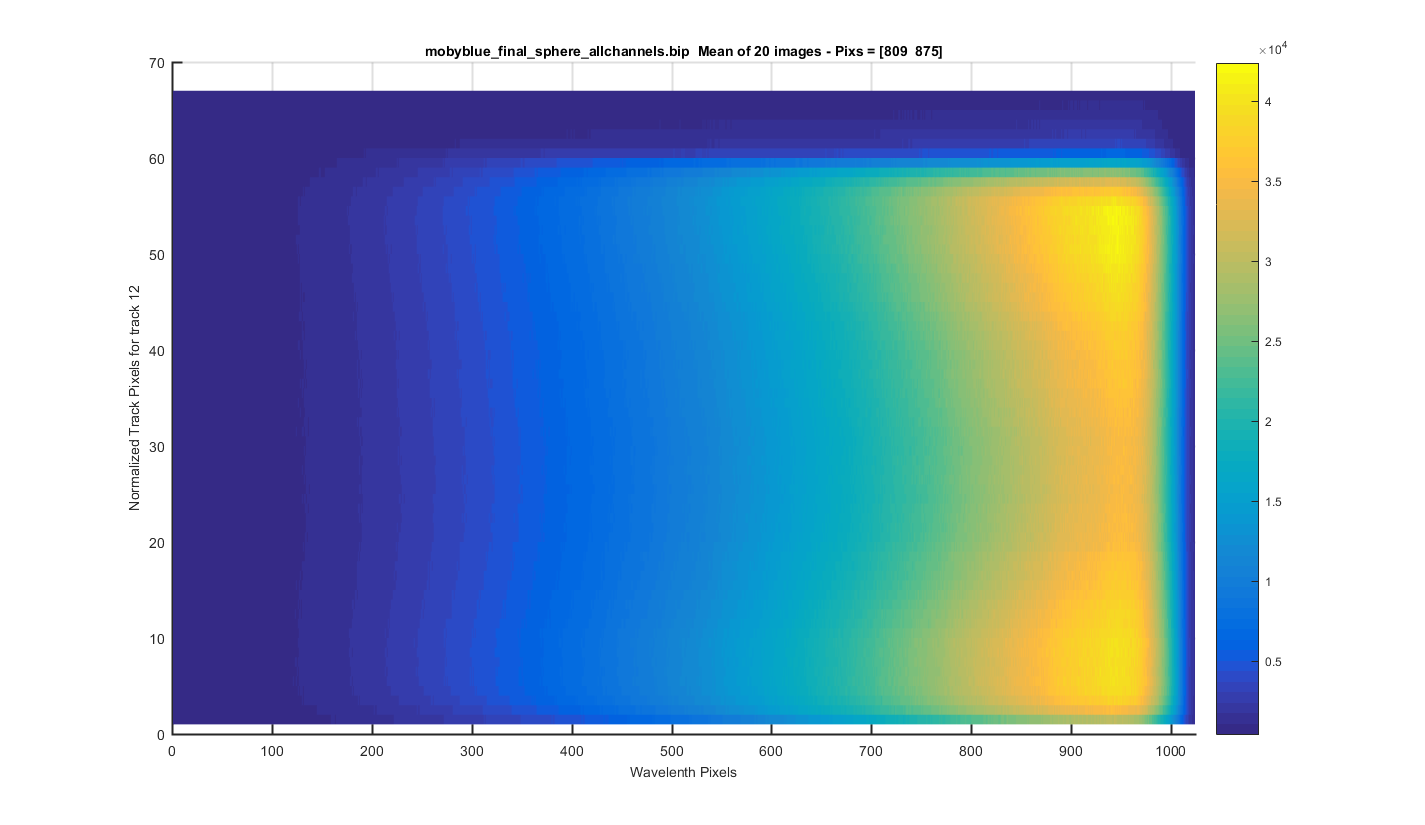
TRACK 12: The meaned image surface plot but for only one track so you can see each track zoomed in. The y-axis is the relative pixel for that track. The title contains the real pixels. I clicked to get these track positions so this will need to be refined in the future.
Figure 19
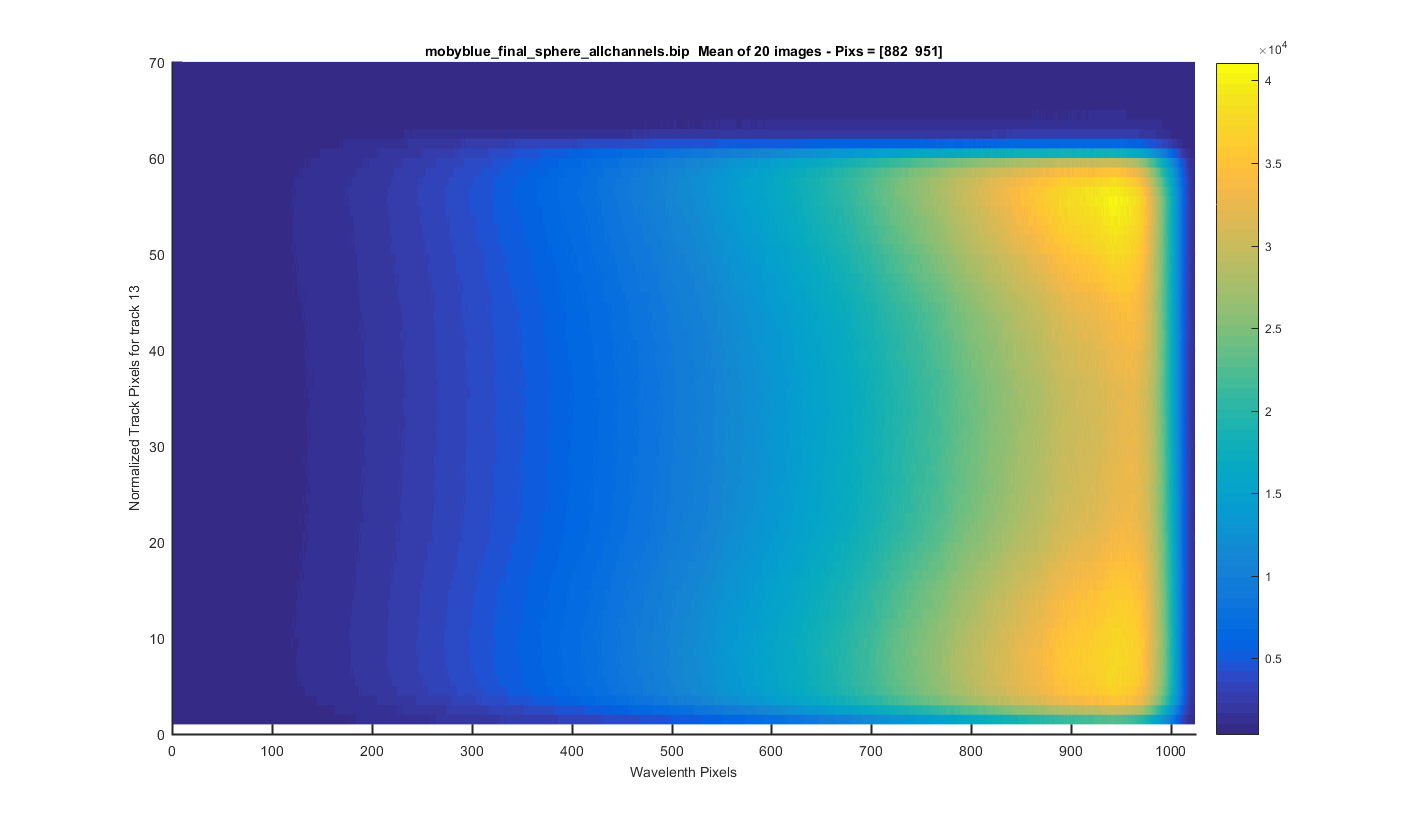
TRACK 13: The meaned image surface plot but for only one track so you can see each track zoomed in. The y-axis is the relative pixel for that track. The title contains the real pixels. I clicked to get these track positions so this will need to be refined in the future.
Figure 20
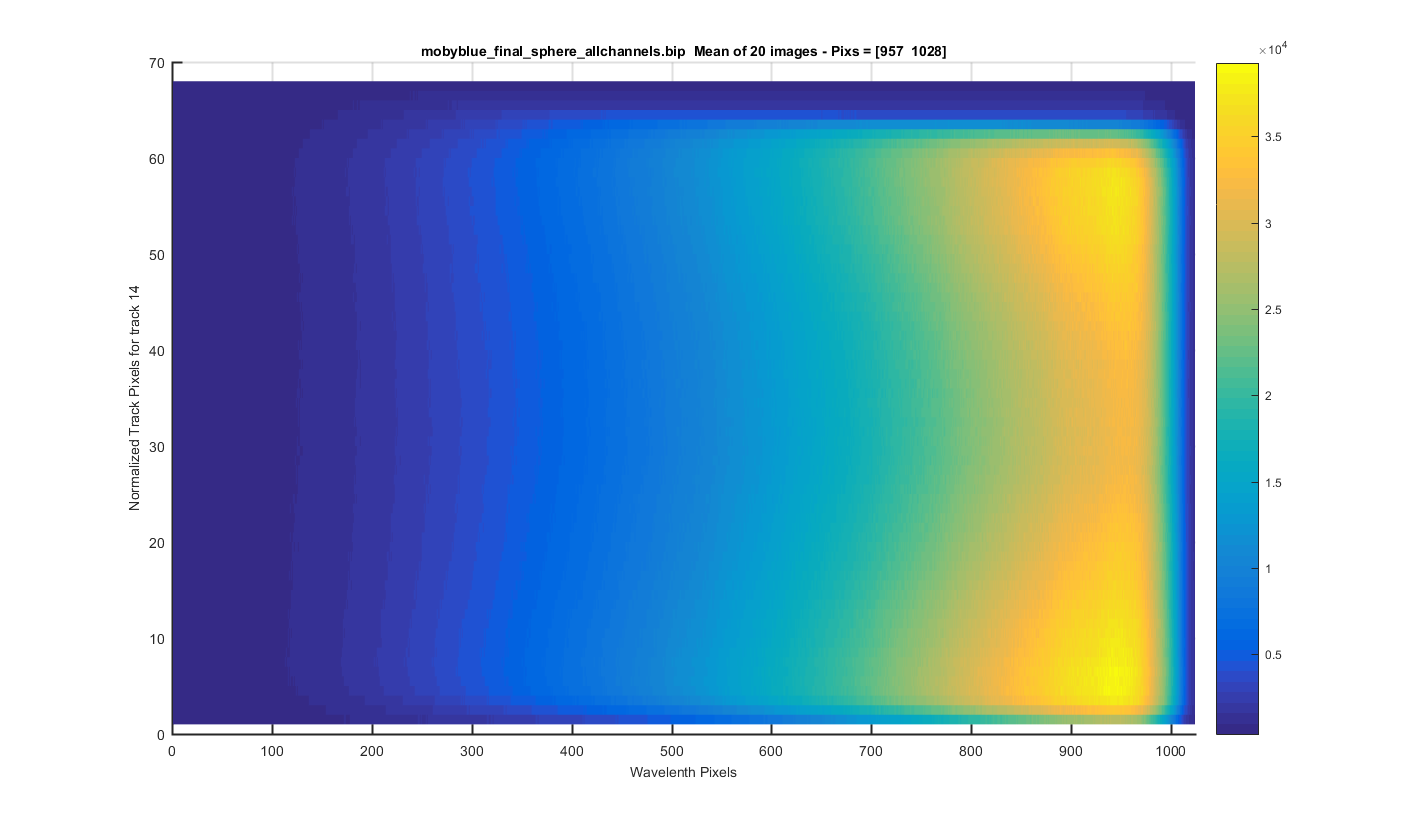
TRACK 14: The meaned image surface plot but for only one track so you can see each track zoomed in. The y-axis is the relative pixel for that track. The title contains the real pixels. I clicked to get these track positions so this will need to be refined in the future.
Figure 21
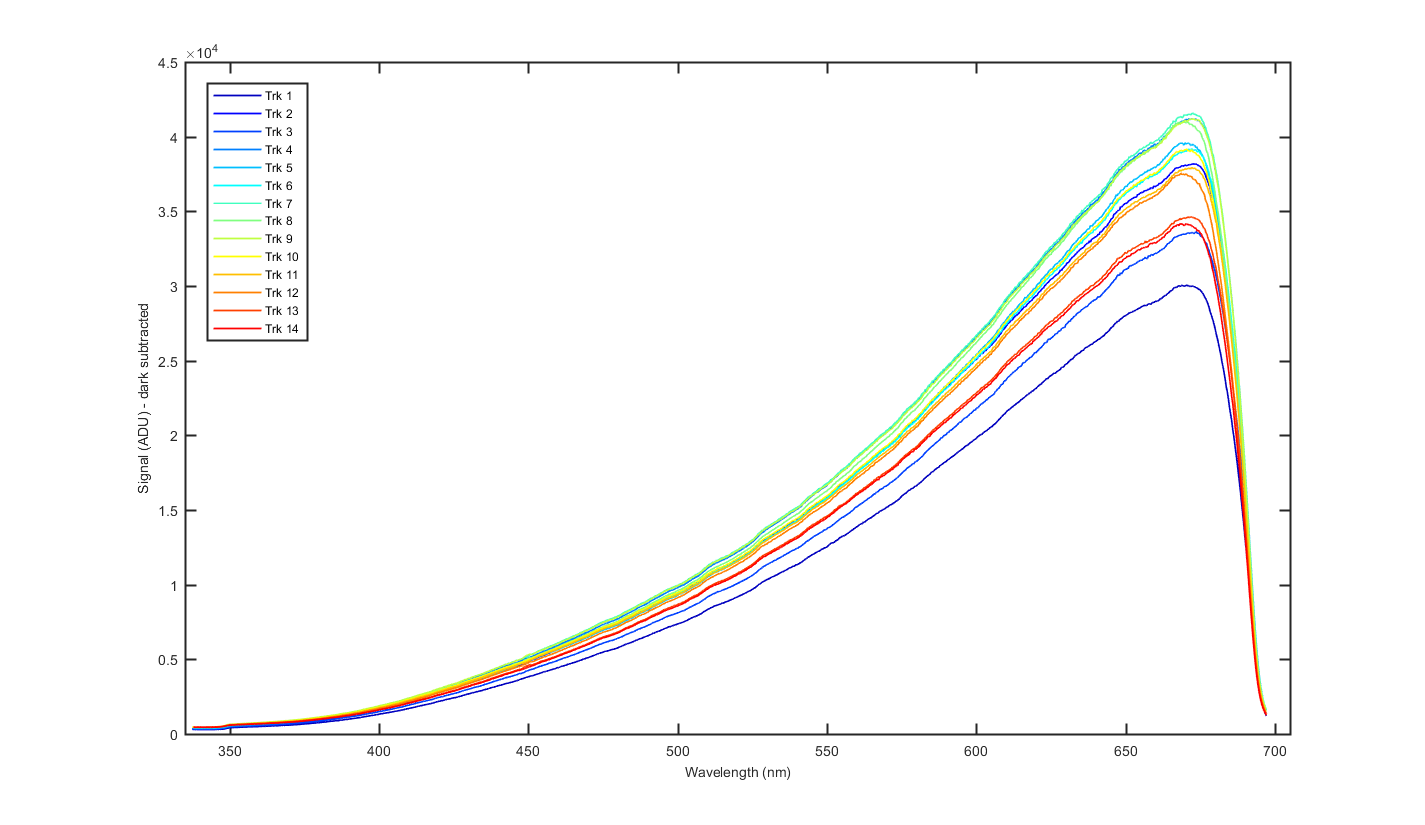
Signal in ADU but dark subtracted
Figure 22
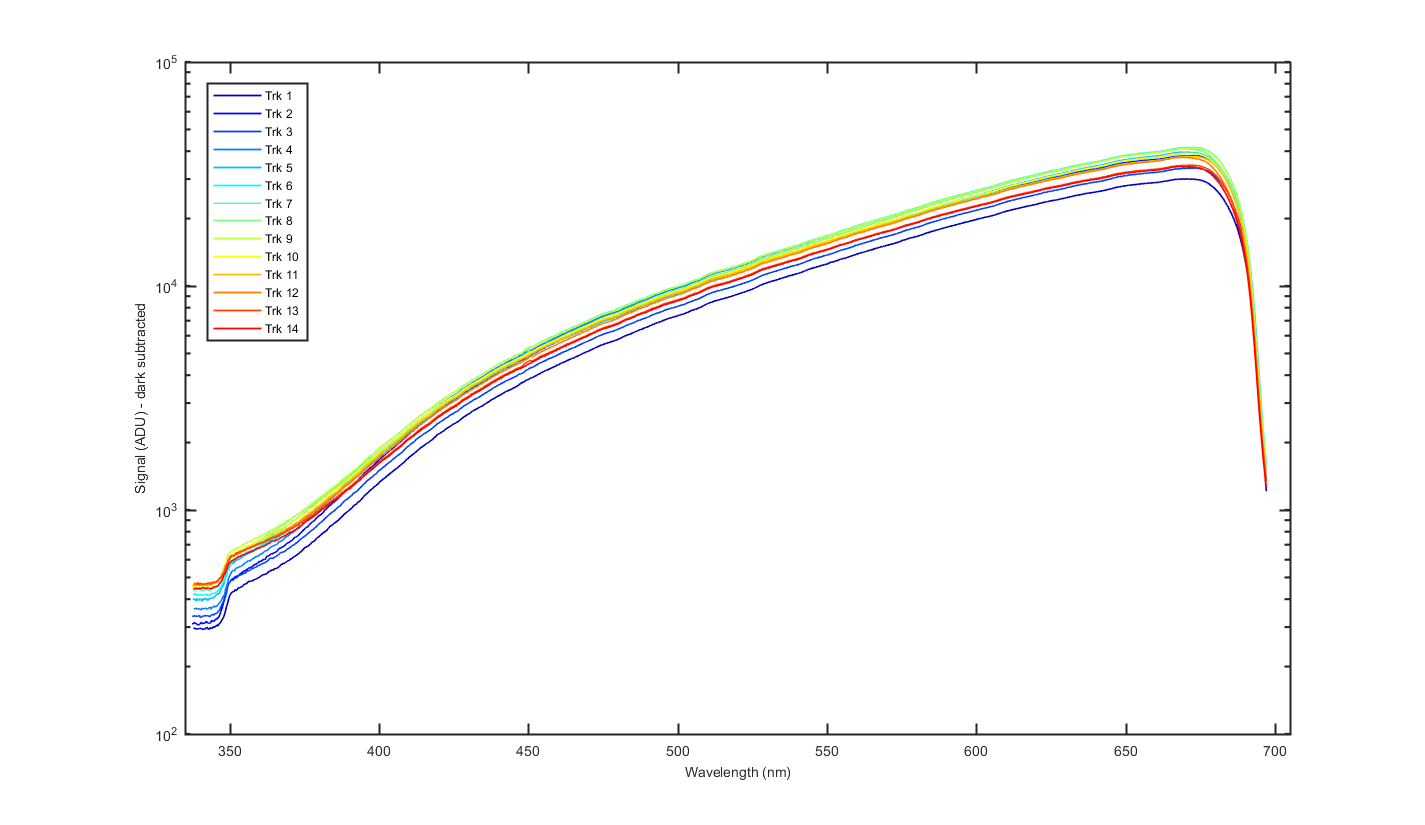
Signal in ADU but dark subtracted - log scale
Figure 23
Signal to Noise Ratio for each track
Figure 24