REVISION DATE: 04-Dec-2015 16:43:44
Email from Casey on 4 Dec 2015 11:09 am:

Hi Everyone,

New data is up.

All files were taken without dark noise removed.  You will find the dark noise cube in the folder that is valid for all of
the cubes.  I have also subtracted the temporal mean of the dark noise cube and included those corrected files as well.
The Radiometric Response should be the response of the system in microflicks/DN, but I have not had time to error check this yet.

Integration times of the system are in the header files as "shutter".  This reflects the electronic integration time of the CCD,
as the mechanical shutter is open slightly longer that the CCD is integrating for (as I understand this camera anyway).

The "radiance" file has all of the fibers looking into the integrating sphere.

The data is in calibrated wavelengths.  The spectral range of the system is 503.7 nm to 911.4 nm, although as Mike pointed
out the cut-on wavelength is closer to 540 nm due to the high pass filter coating.

Please let me know if you have questions or have specific data you would like collected.

Thanks,
Casey
Files sent: RadiometricResponse_Microflicks.bip, channel8_radiance.bip, helium.bip allfibers_radiance.bip, channel8_radiance_darkremoved.bip, helium_darkremoved.bip allfibers_radiance_darkremoved.bip, dark_100ms.bip
Below are my graphs of the allfibers_radiance.bip file. The file contains 20 dark images at 0.1 sec Note some graphs are dark corrected and some are not so check the axis labels to know what you are looking at.
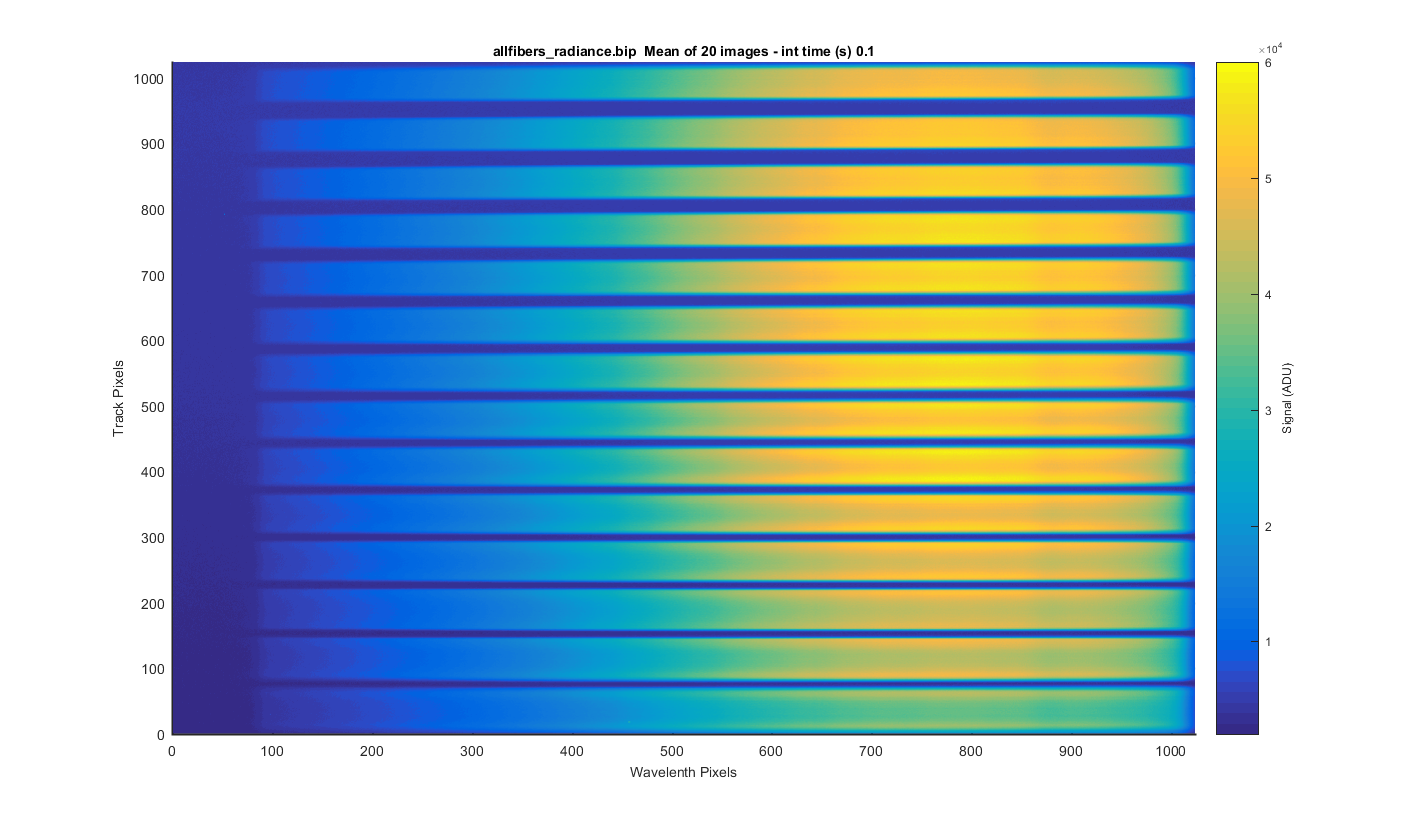
I took the 20 images and meaned them to get the surface plot below. Things to note 1) notice that the width of the dark areas between the tracks is tighter at the bottom than wider at the top. 2) Tracks are wider at the bottom and narrower at the top. 3) The line in Track 4 that was seen on the previous image is now gone.
Figure 1
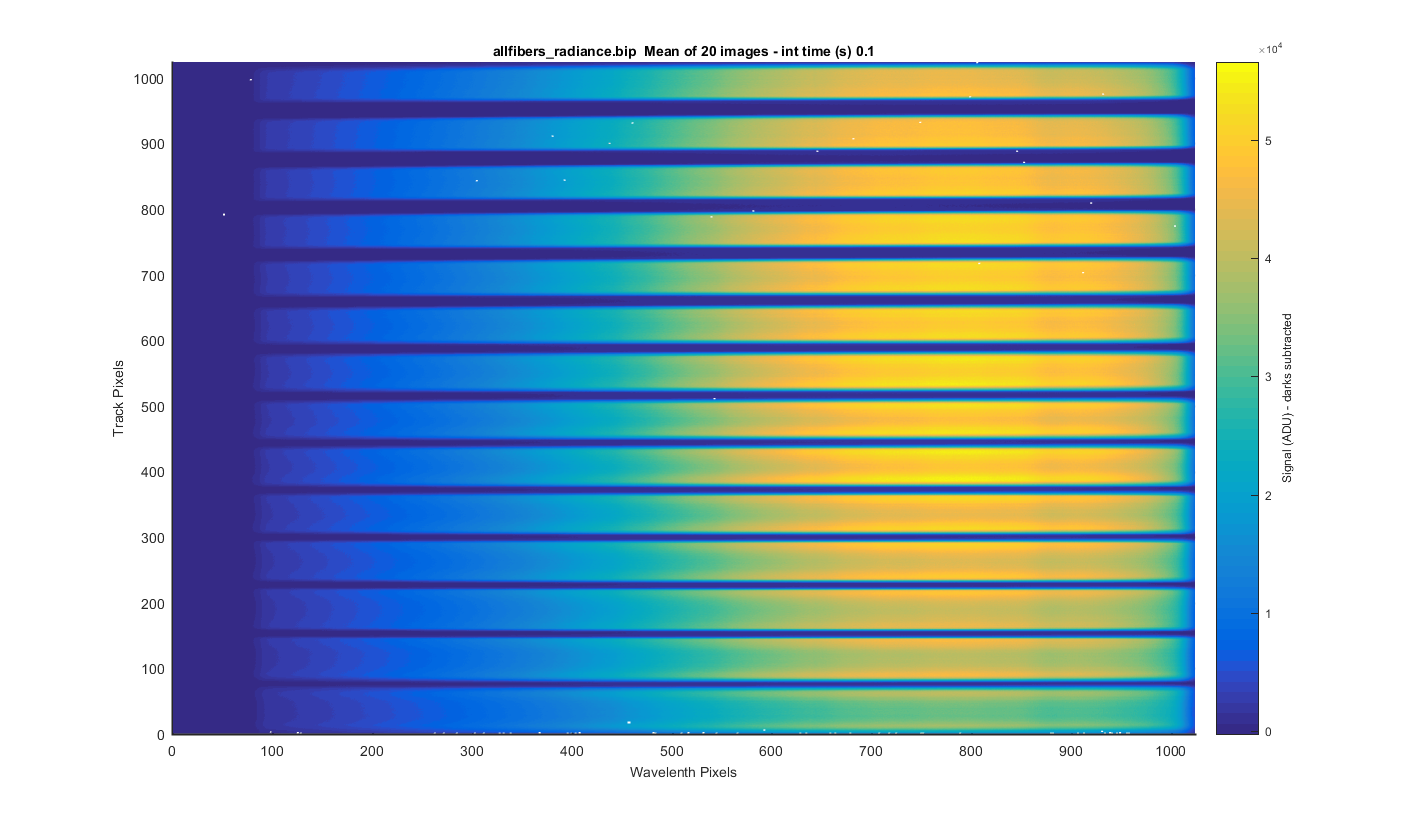
Same as the previous images but with the dark image subtracted. The little white dots are where there where spiked in the darks which where set to NaN.
Figure 2
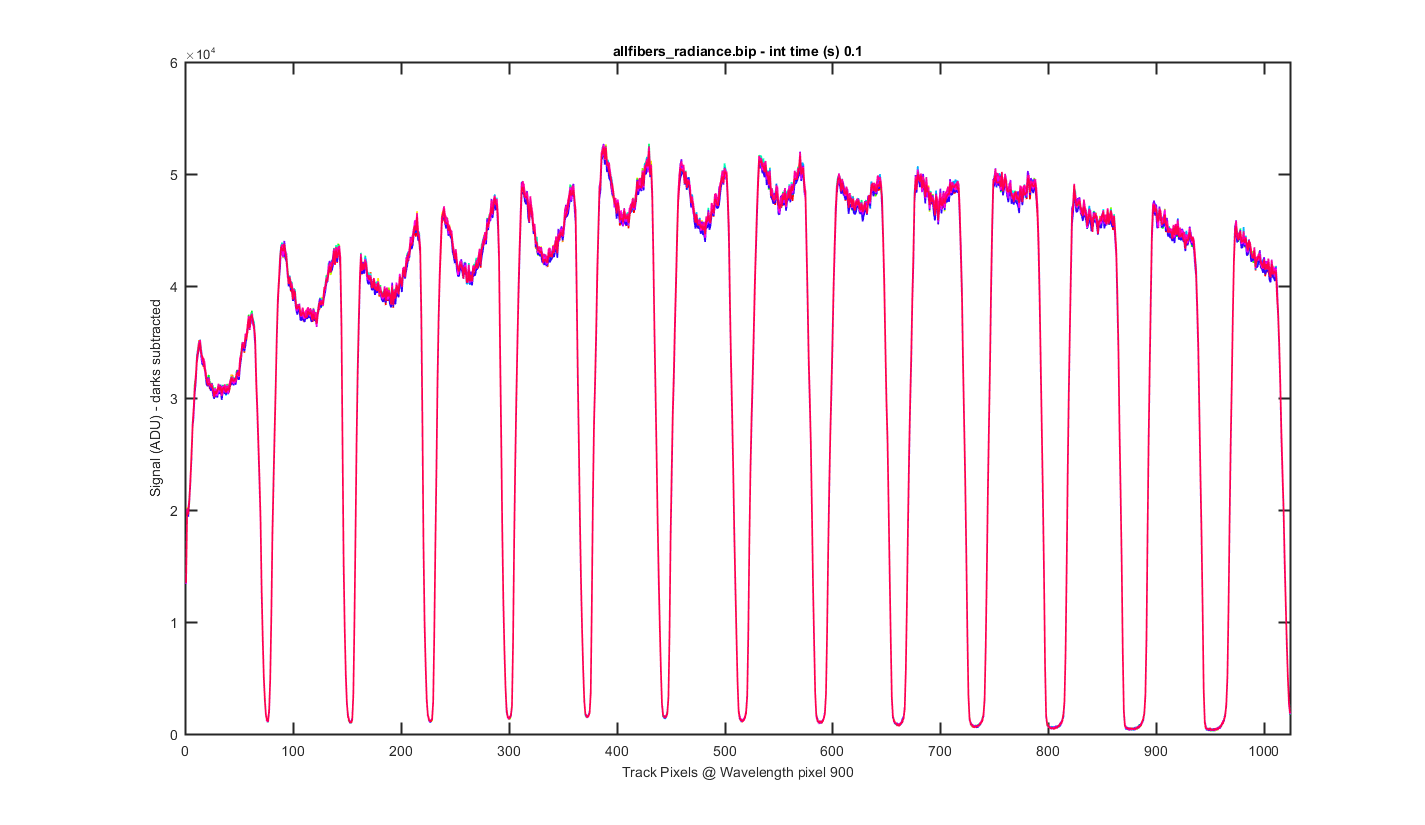
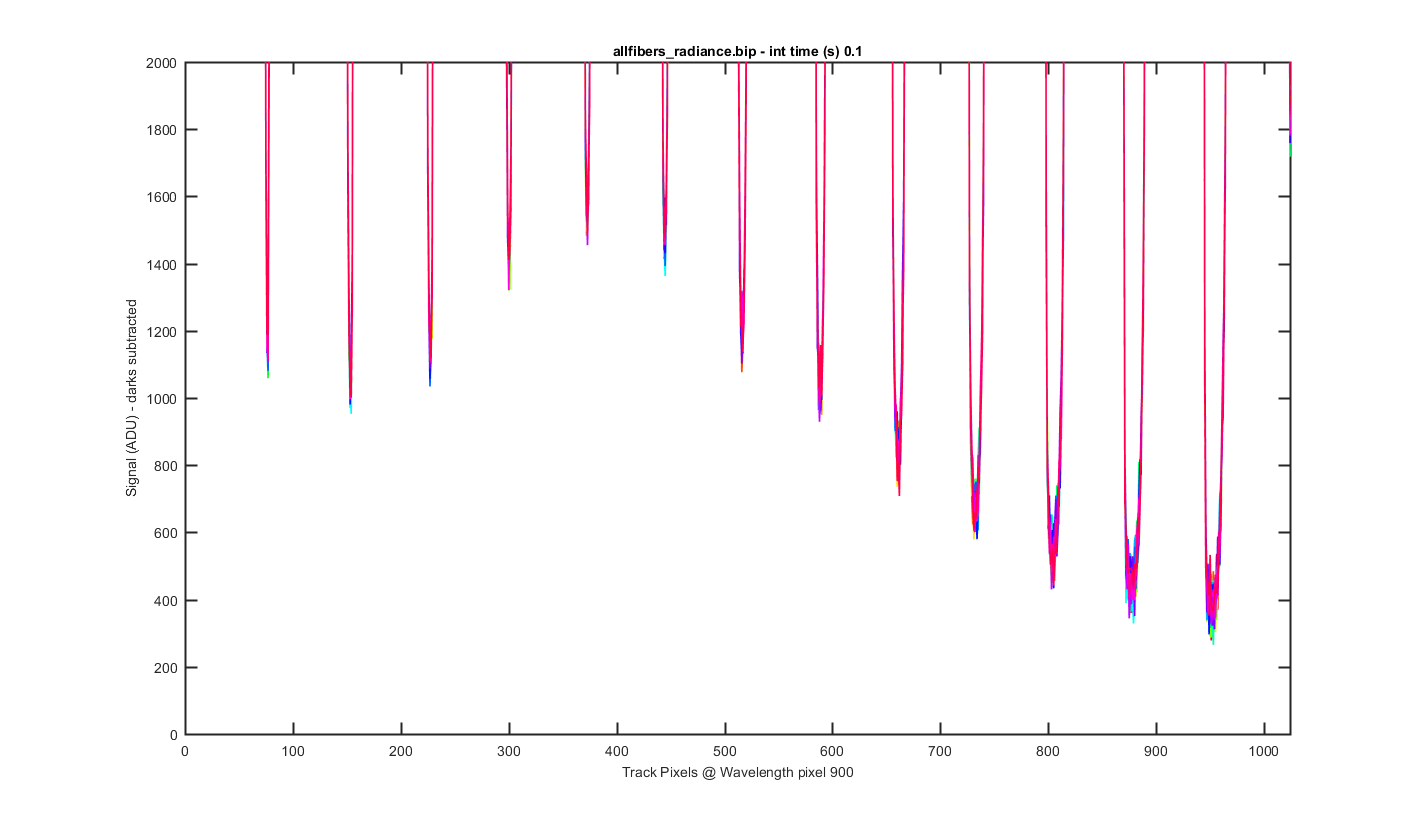
This is a cross section through the tracks at wavelength pixel 900, with one line for each of the 20 images (darks are subtracted). The tracks and their shapes look really stable. You can see the differences in the width of the spacing between the tracks here too.
Figure 3
Same as the previous graph but zoomed into the bottom to see the level of the darks between the tracks. Looks like there might be more light getting between the tracks for tracks 4-9?? (darks are subtracted)
Figure 4
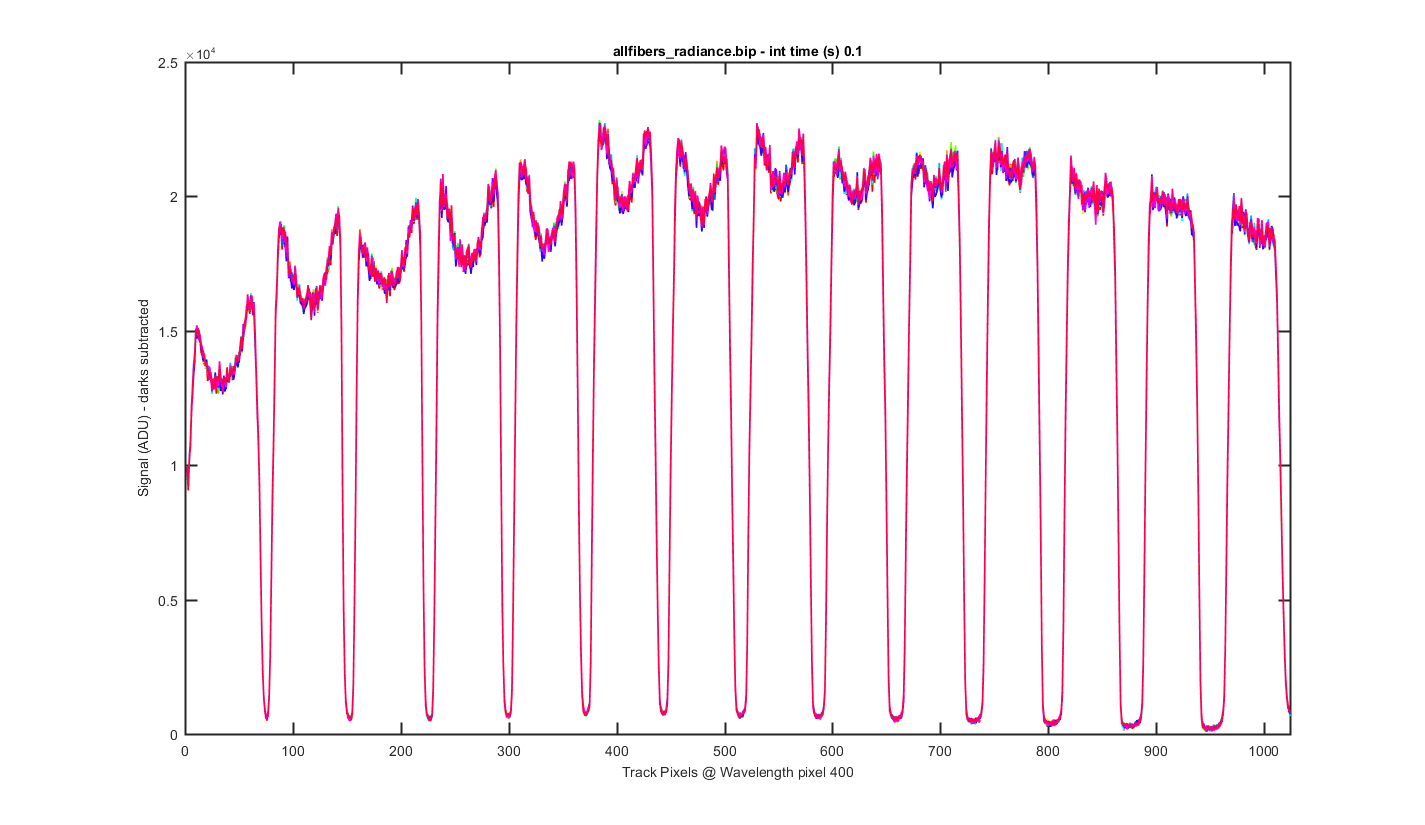
Same as figure 2 but for Wavelength pixel 400 (darks are subtracted)
Figure 5
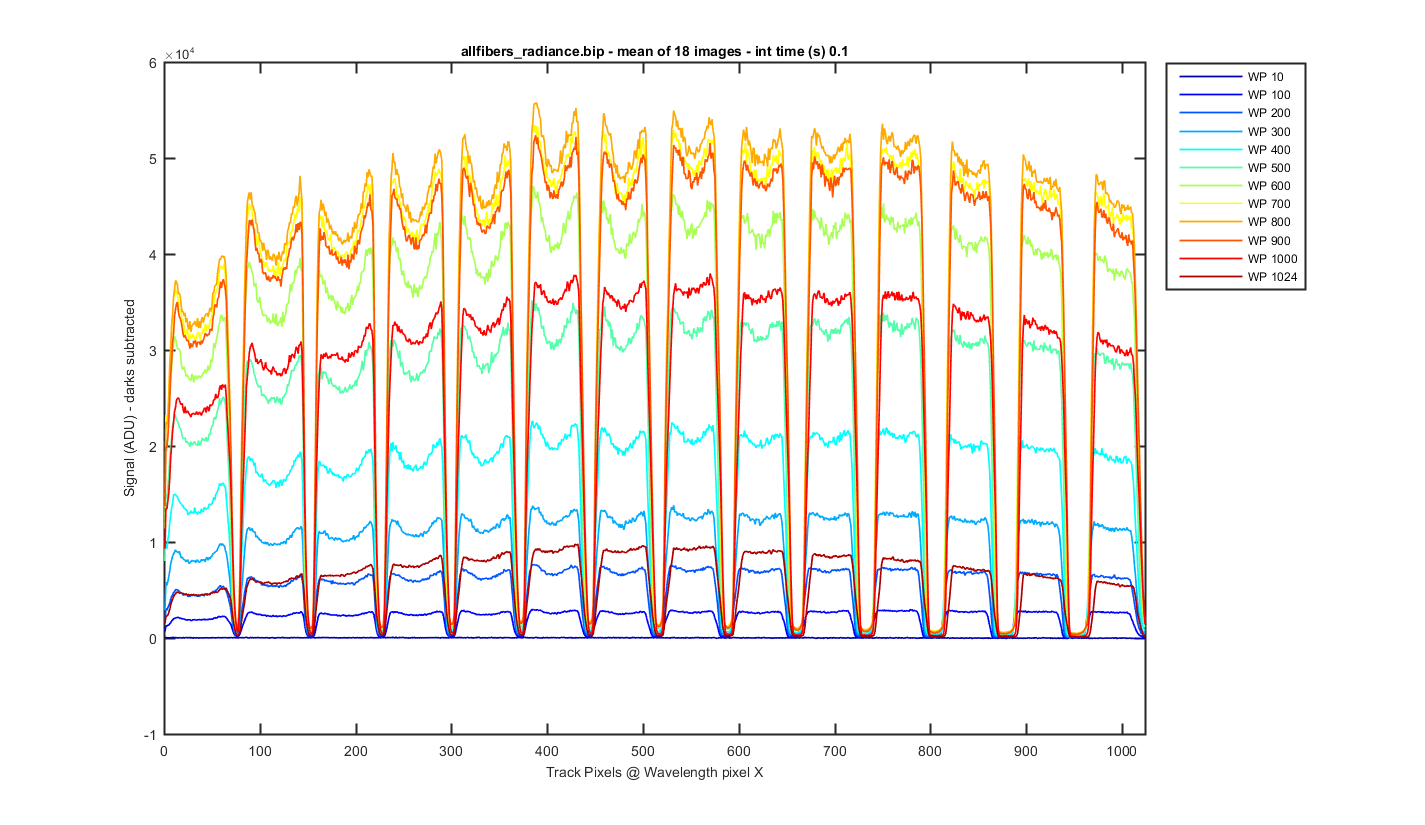
Again this is the mean image with slices thought the image at different wavelength pixels (darks are subtracted).
Figure 6
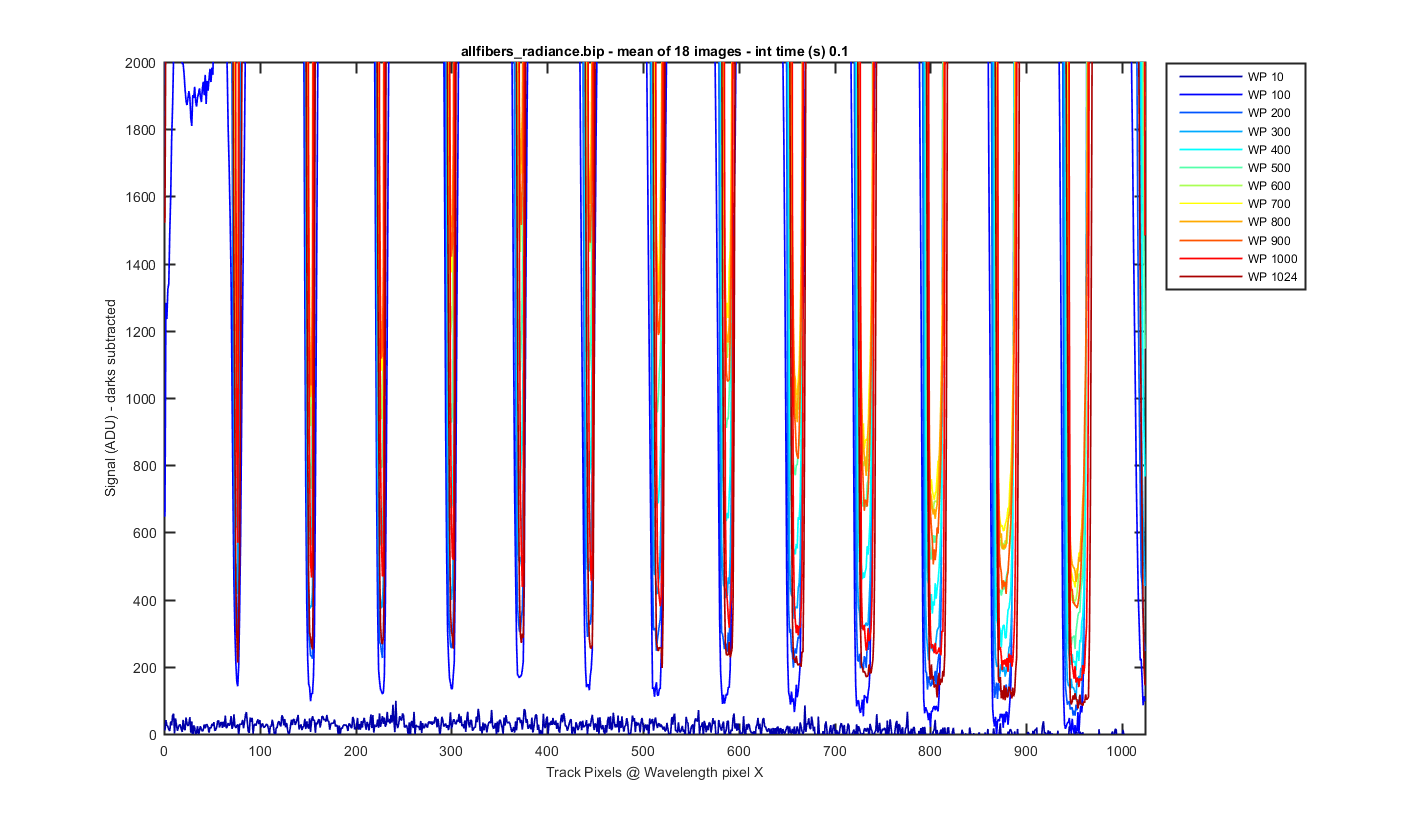
Same as figure 6 but zoomed to the bottom so you can see the darks between the tracks (darks are subtracted).
Figure 7
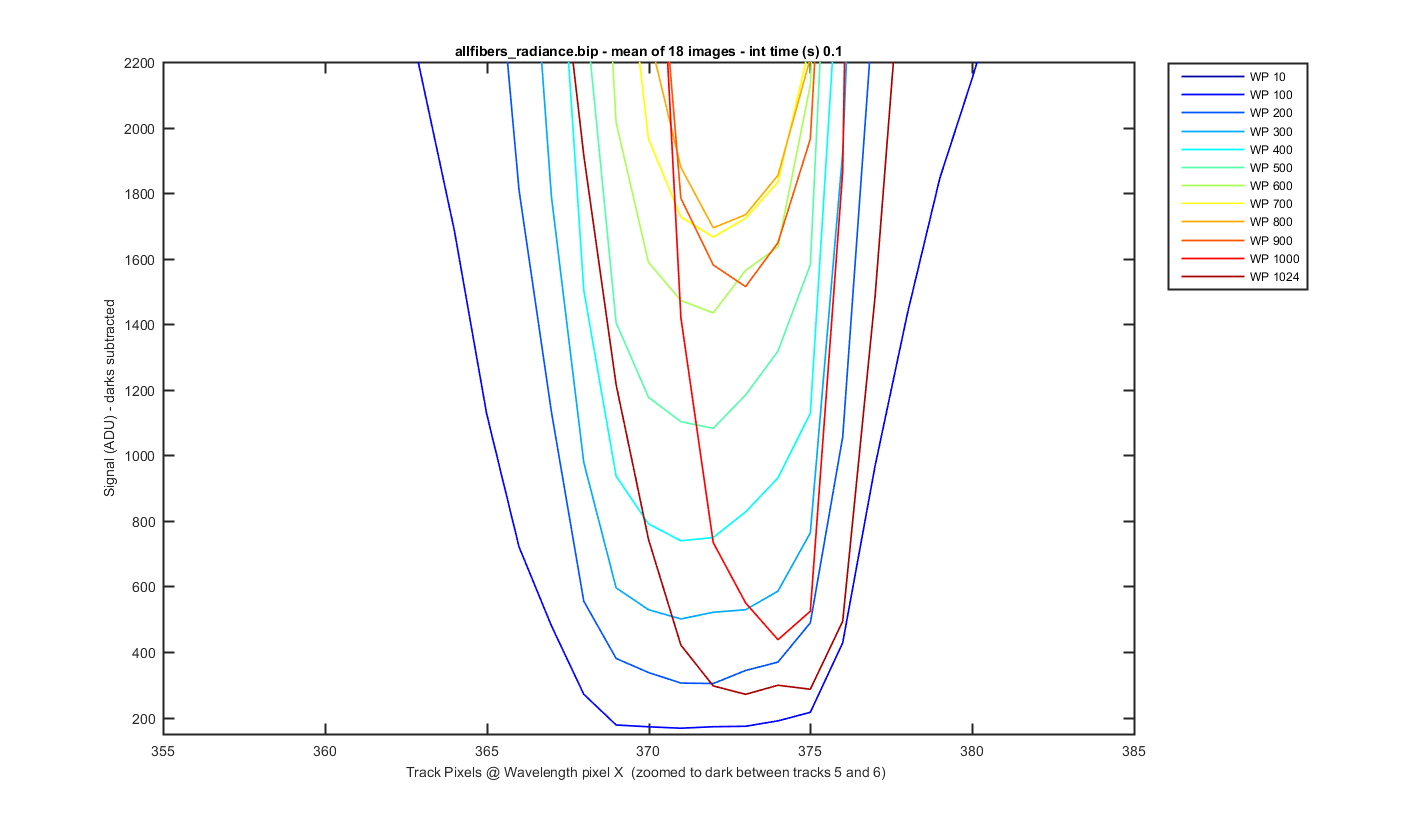
Same as figure 7 but zoomed into the dark area between tracks 5 and 6 so you can see the amount of light getting between the tracks (darks are subtracted). It varies by wavelength.
Figure 8
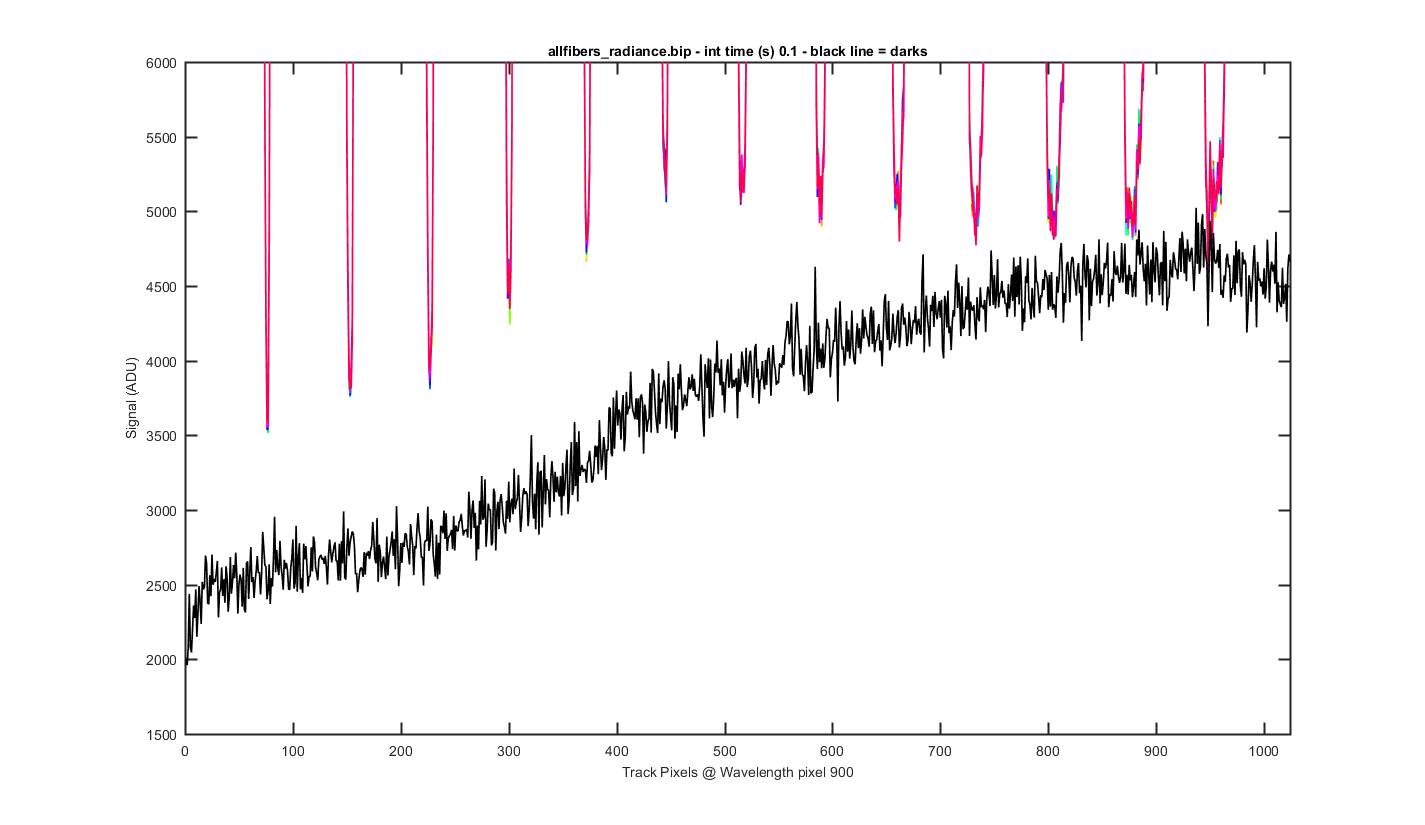
The same cross track plots but zoomed to the bottom and not dark corrected with the dark plotted at a black line (wavelength pixel 900).
Figure 9
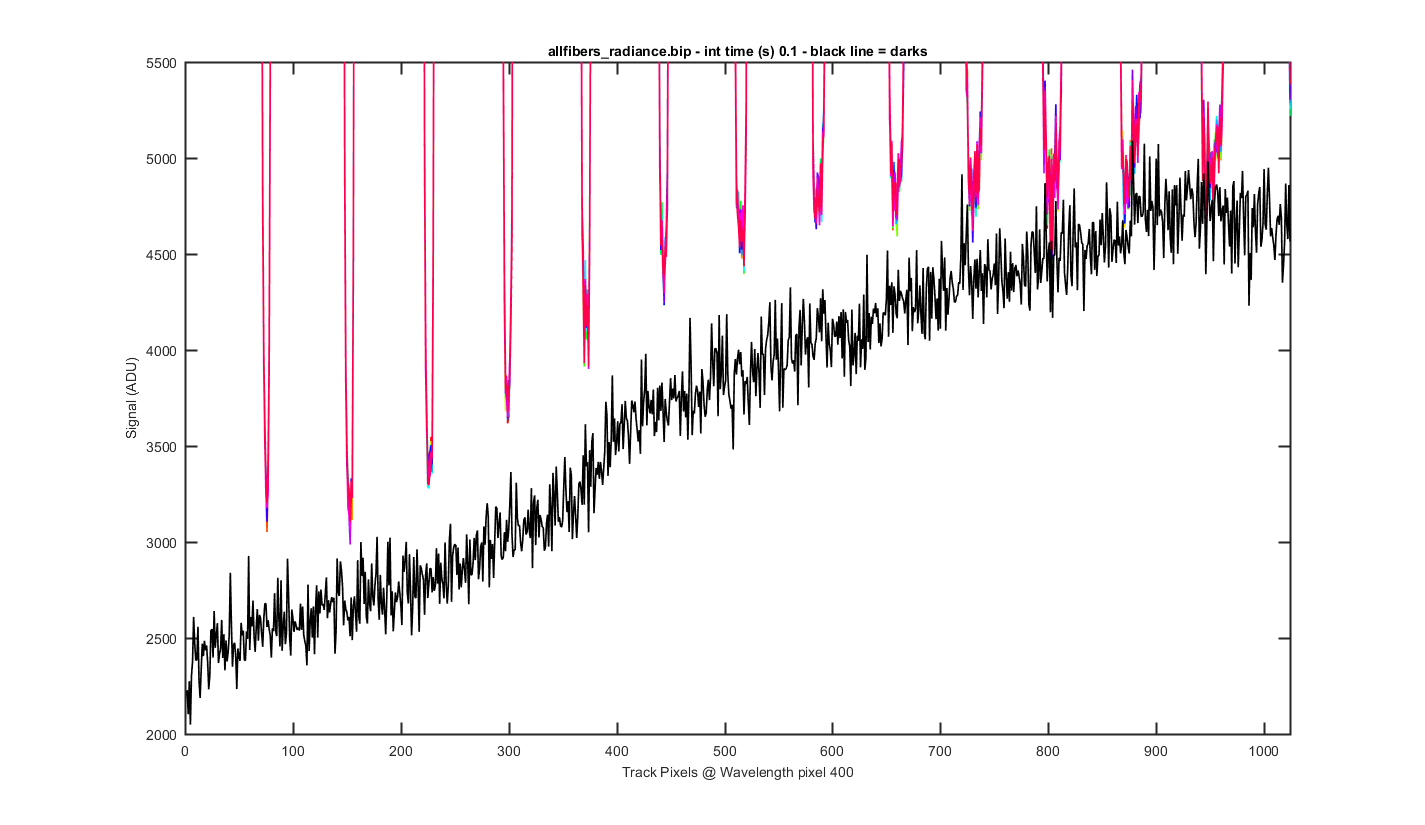
The same cross track plots but zoomed to the bottom and not dark corrected with the dark plotted at a black line (wavelength pixel 400).
Figure 10
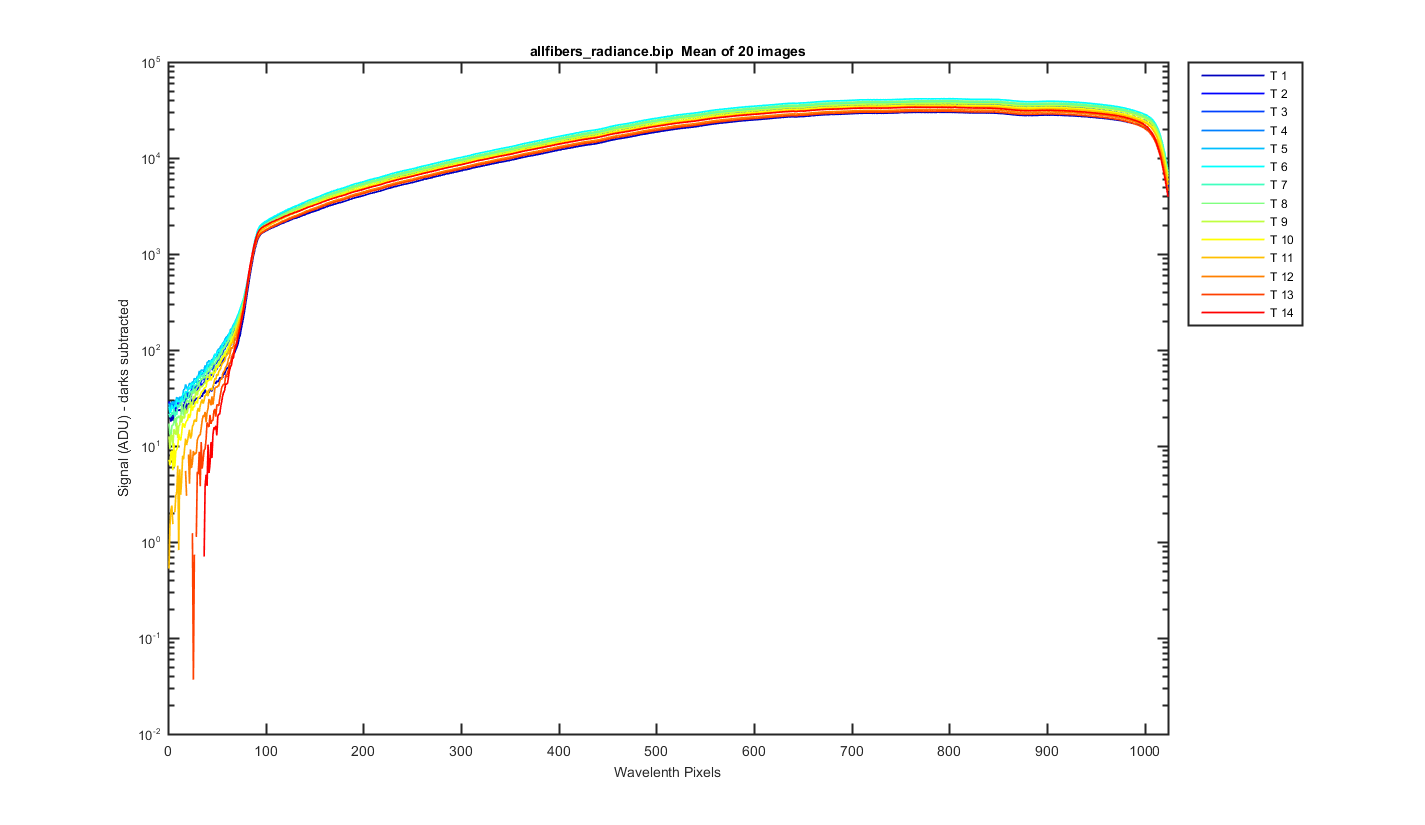
Track data which is dark subtracted
Figure 11
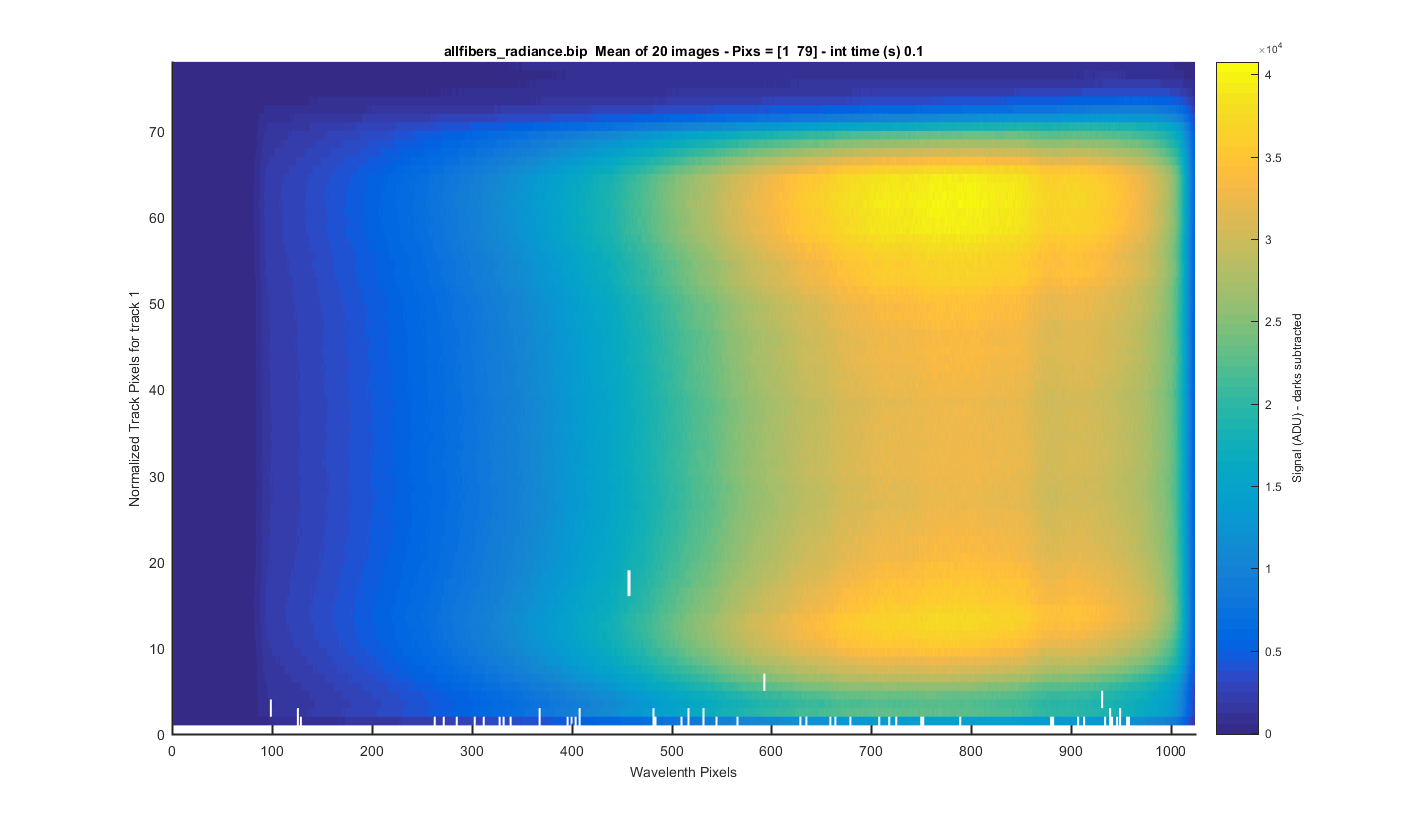
TRACK 1: The meaned image (darks are subtracted) surface plot but for only one track so you can see each track zoomed in. The y-axis is the relative pixel for that track. The title contains the real pixels. I clicked to get these track positions so this will need to be refined in the future.
Figure 12
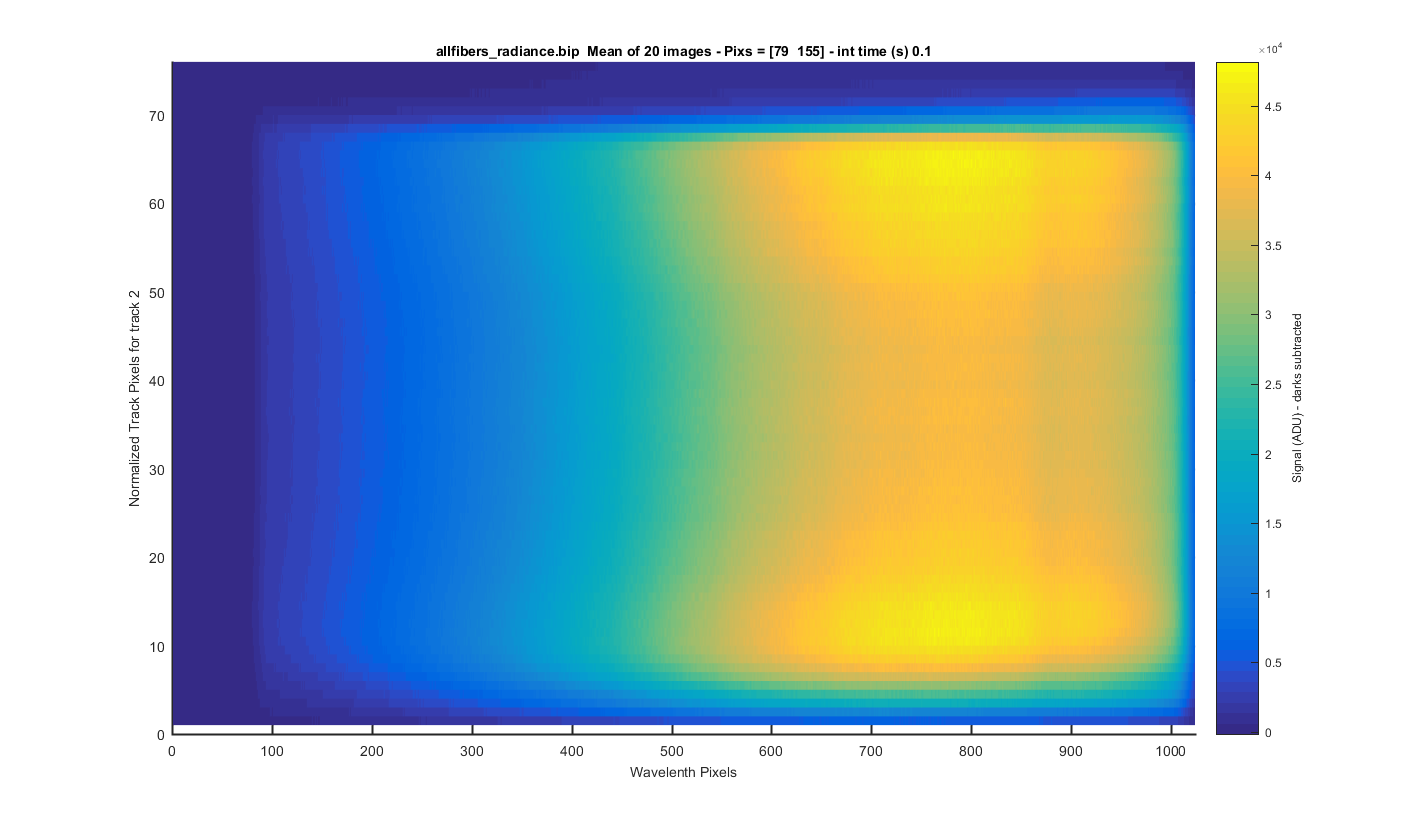
TRACK 2: The meaned image (darks are subtracted) surface plot but for only one track so you can see each track zoomed in. The y-axis is the relative pixel for that track. The title contains the real pixels. I clicked to get these track positions so this will need to be refined in the future.
Figure 13
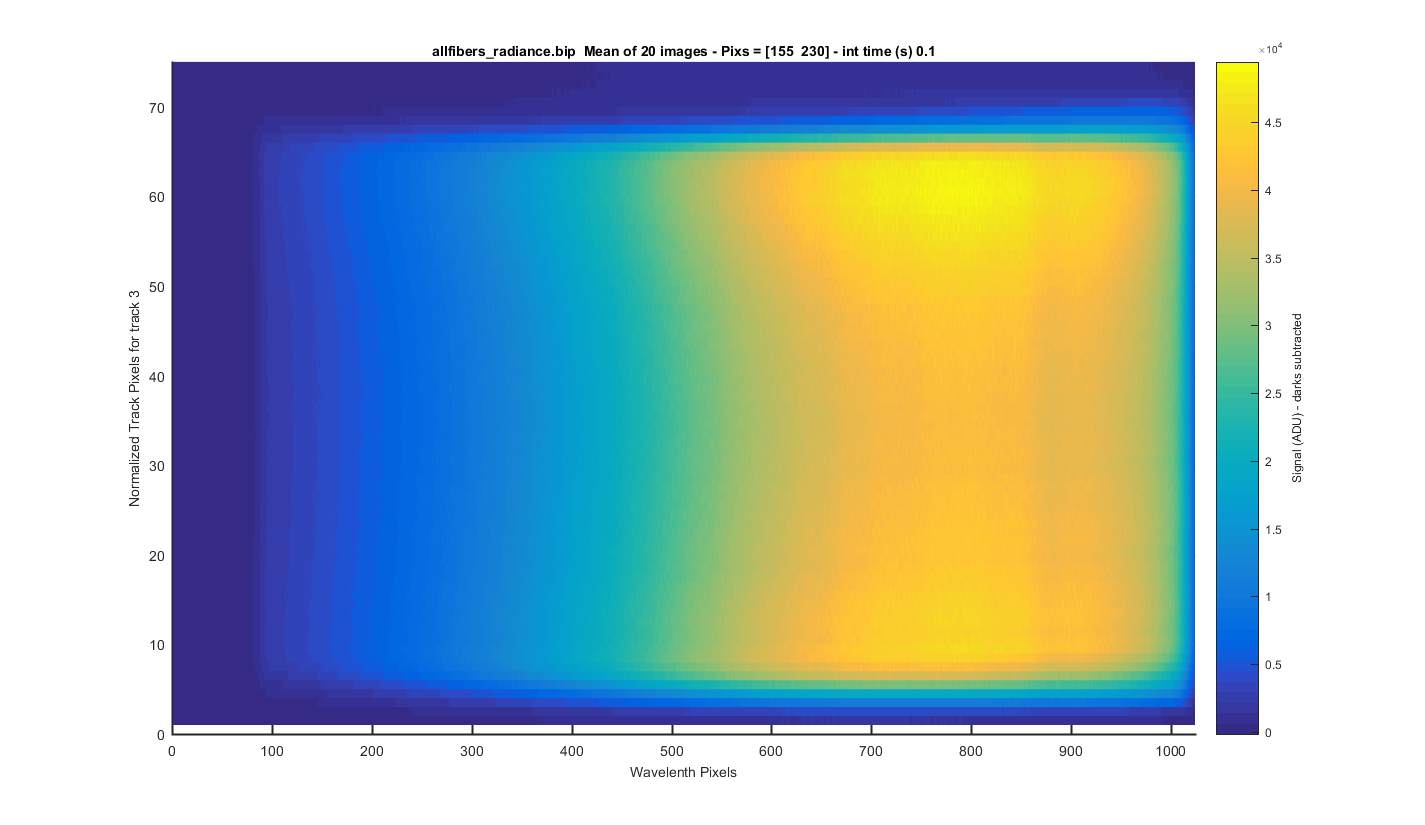
TRACK 3: The meaned image (darks are subtracted) surface plot but for only one track so you can see each track zoomed in. The y-axis is the relative pixel for that track. The title contains the real pixels. I clicked to get these track positions so this will need to be refined in the future.
Figure 14
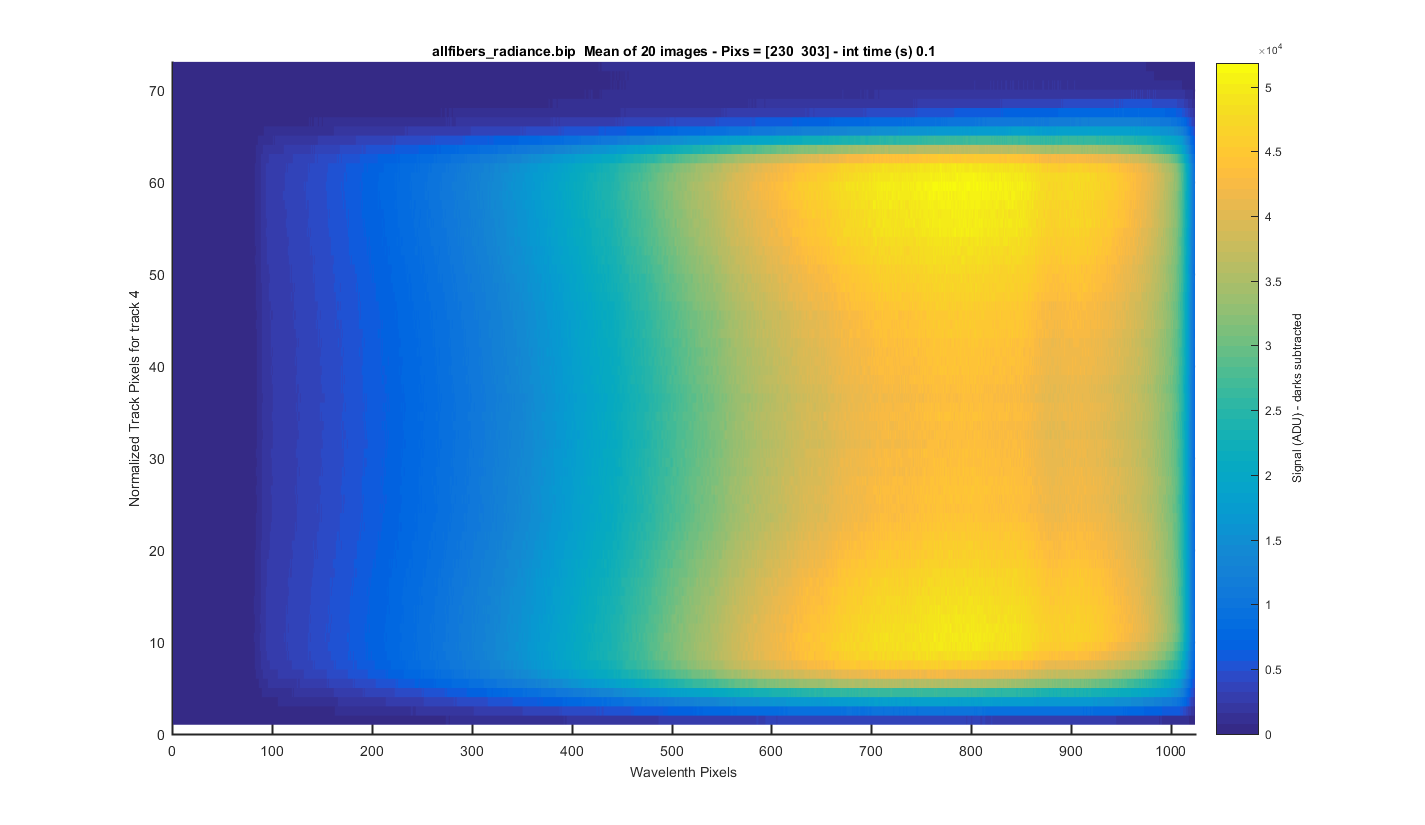
TRACK 4: The meaned image (darks are subtracted) surface plot but for only one track so you can see each track zoomed in. The y-axis is the relative pixel for that track. The title contains the real pixels. I clicked to get these track positions so this will need to be refined in the future.
Figure 15
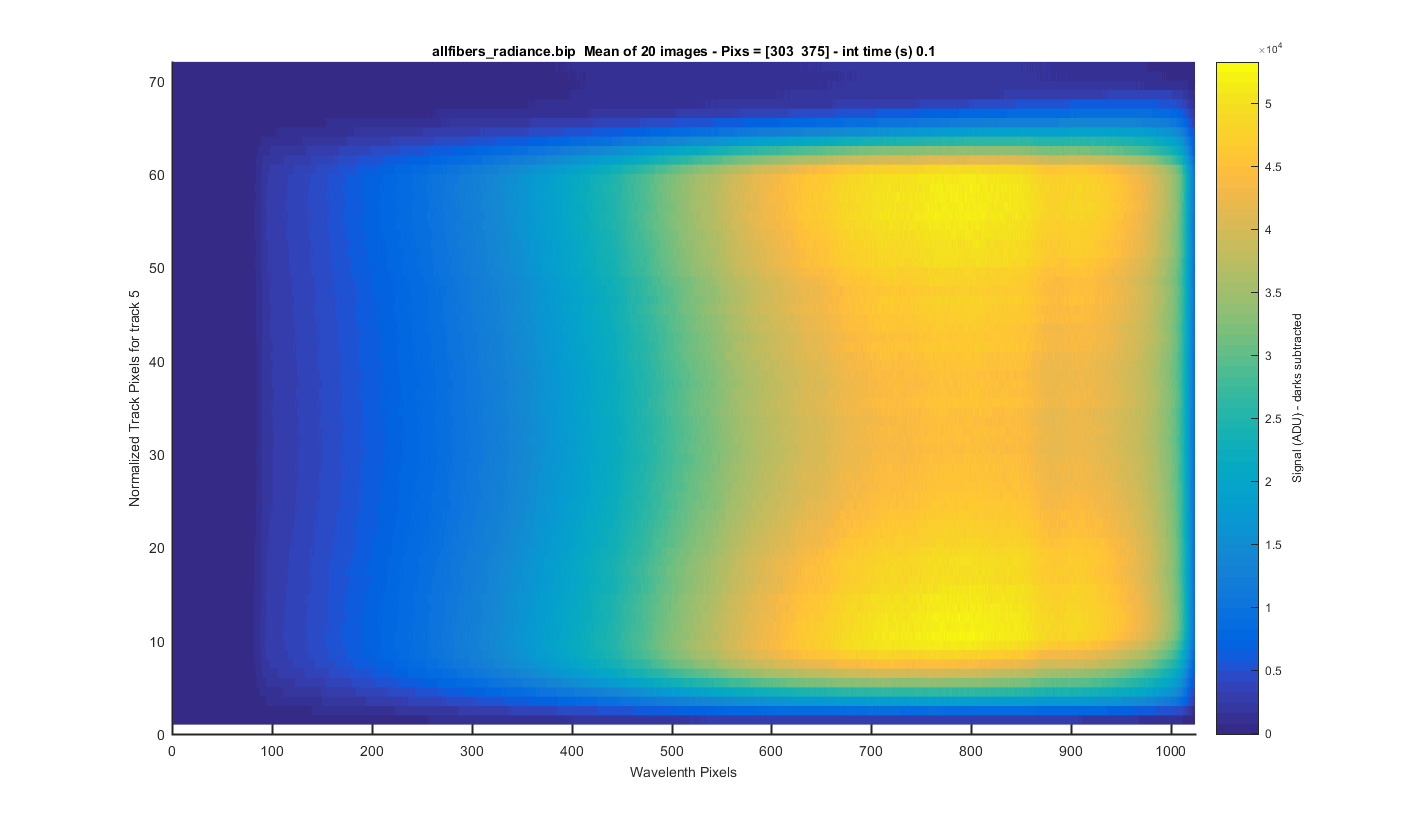
TRACK 5: The meaned image (darks are subtracted) surface plot but for only one track so you can see each track zoomed in. The y-axis is the relative pixel for that track. The title contains the real pixels. I clicked to get these track positions so this will need to be refined in the future.
Figure 16
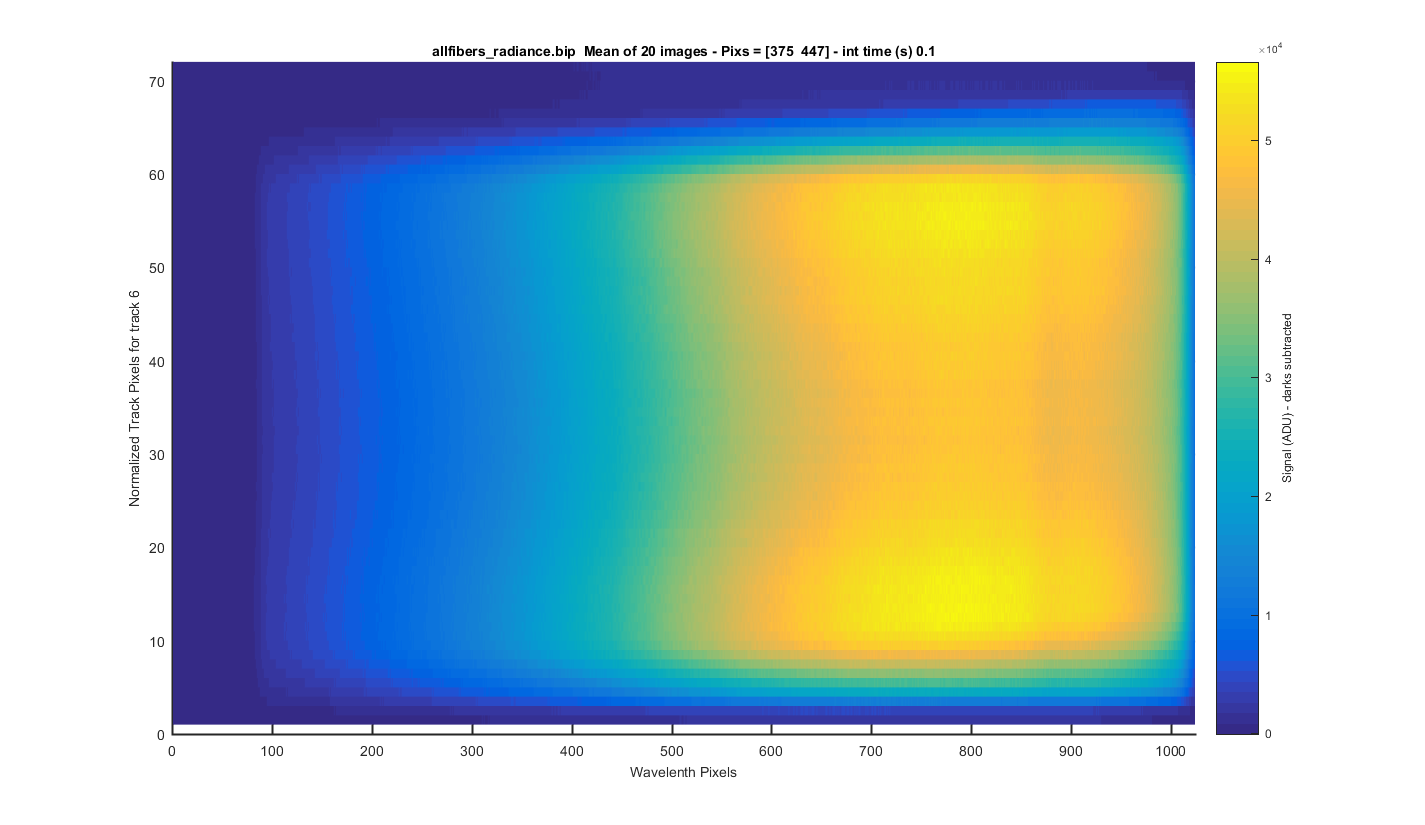
TRACK 6: The meaned image (darks are subtracted) surface plot but for only one track so you can see each track zoomed in. The y-axis is the relative pixel for that track. The title contains the real pixels. I clicked to get these track positions so this will need to be refined in the future.
Figure 17
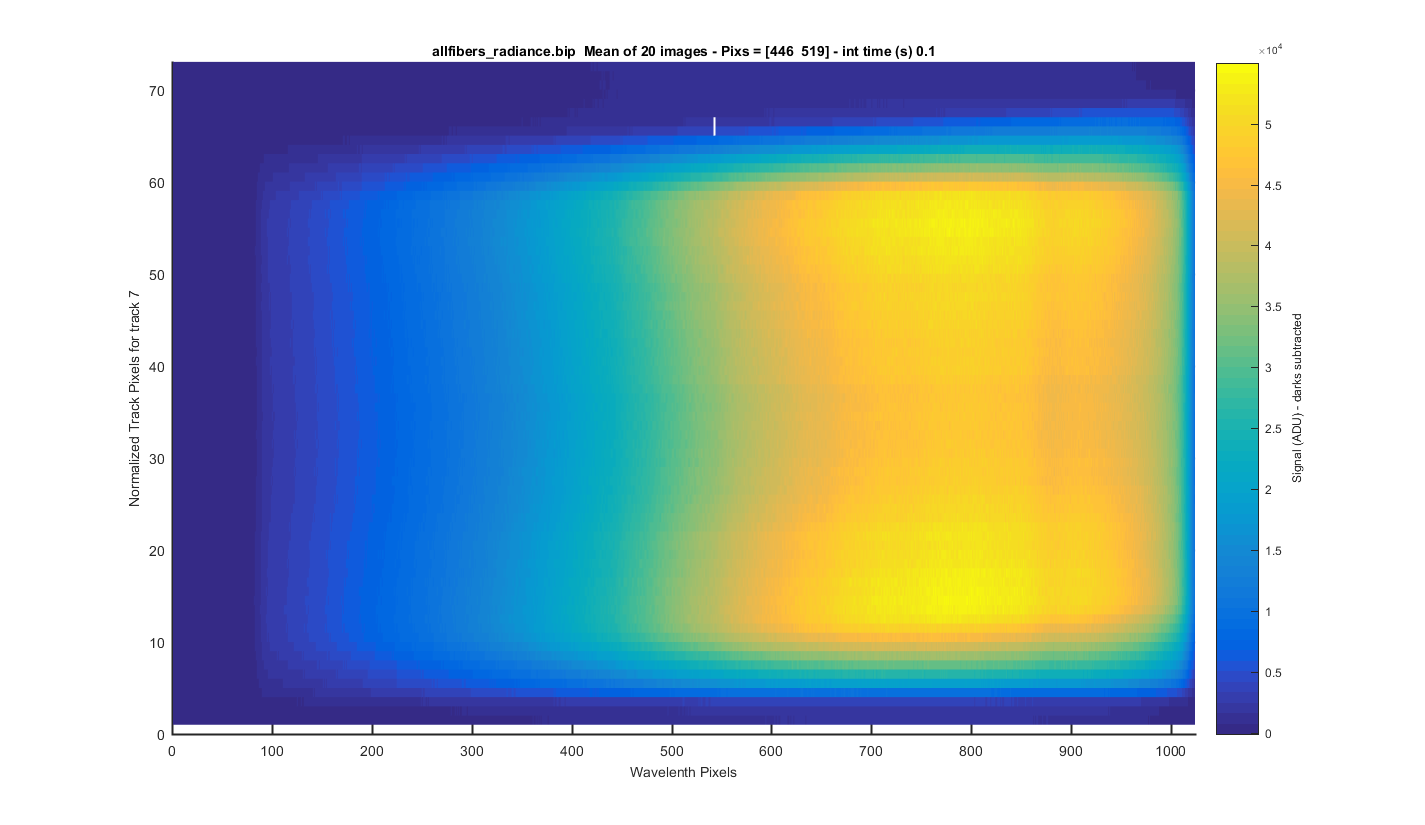
TRACK 7: The meaned image (darks are subtracted) surface plot but for only one track so you can see each track zoomed in. The y-axis is the relative pixel for that track. The title contains the real pixels. I clicked to get these track positions so this will need to be refined in the future.
Figure 18
TRACK 8: The meaned image (darks are subtracted) surface plot but for only one track so you can see each track zoomed in. The y-axis is the relative pixel for that track. The title contains the real pixels. I clicked to get these track positions so this will need to be refined in the future.
Figure 19

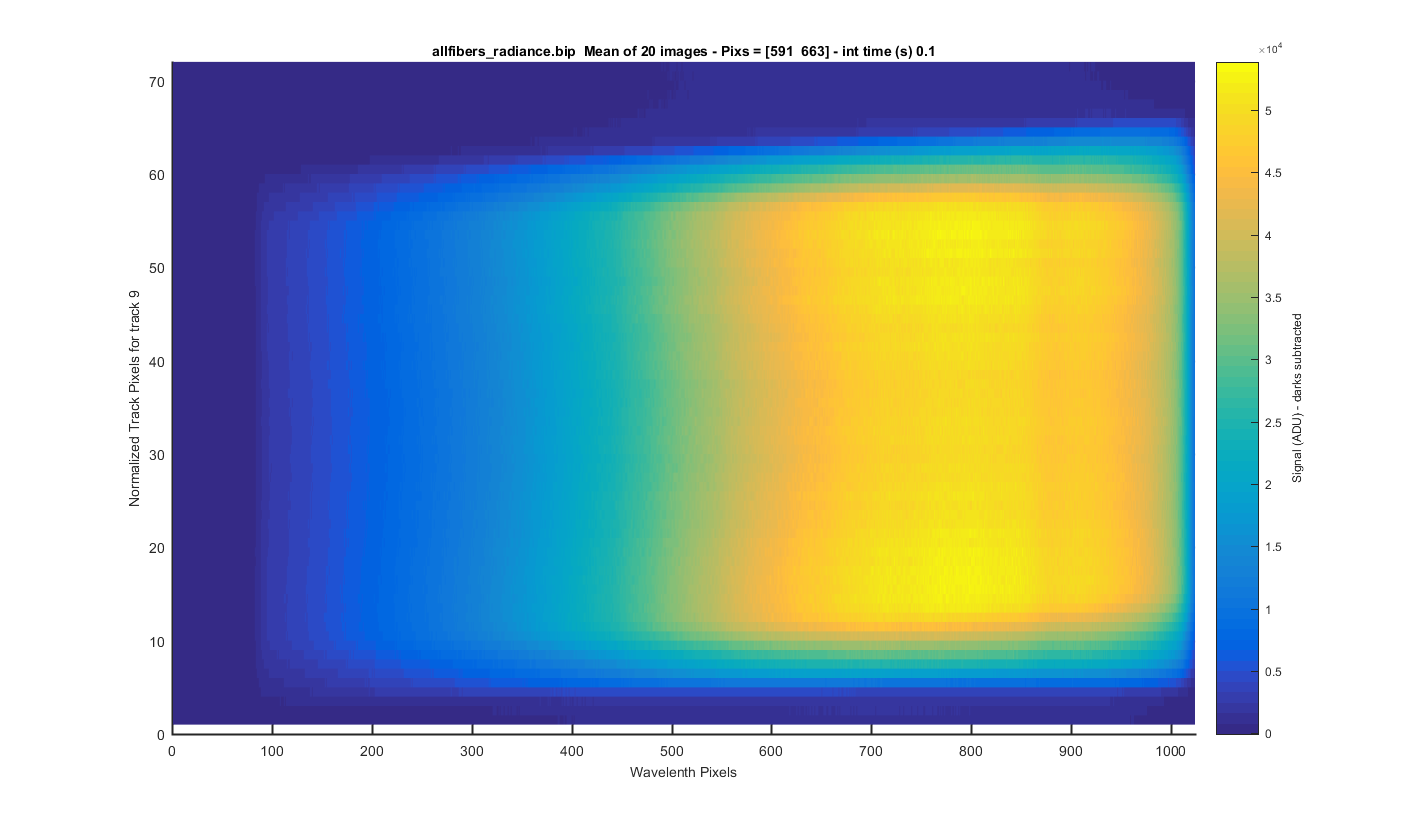
TRACK 9: The meaned image (darks are subtracted) surface plot but for only one track so you can see each track zoomed in. The y-axis is the relative pixel for that track. The title contains the real pixels. I clicked to get these track positions so this will need to be refined in the future.
Figure 20
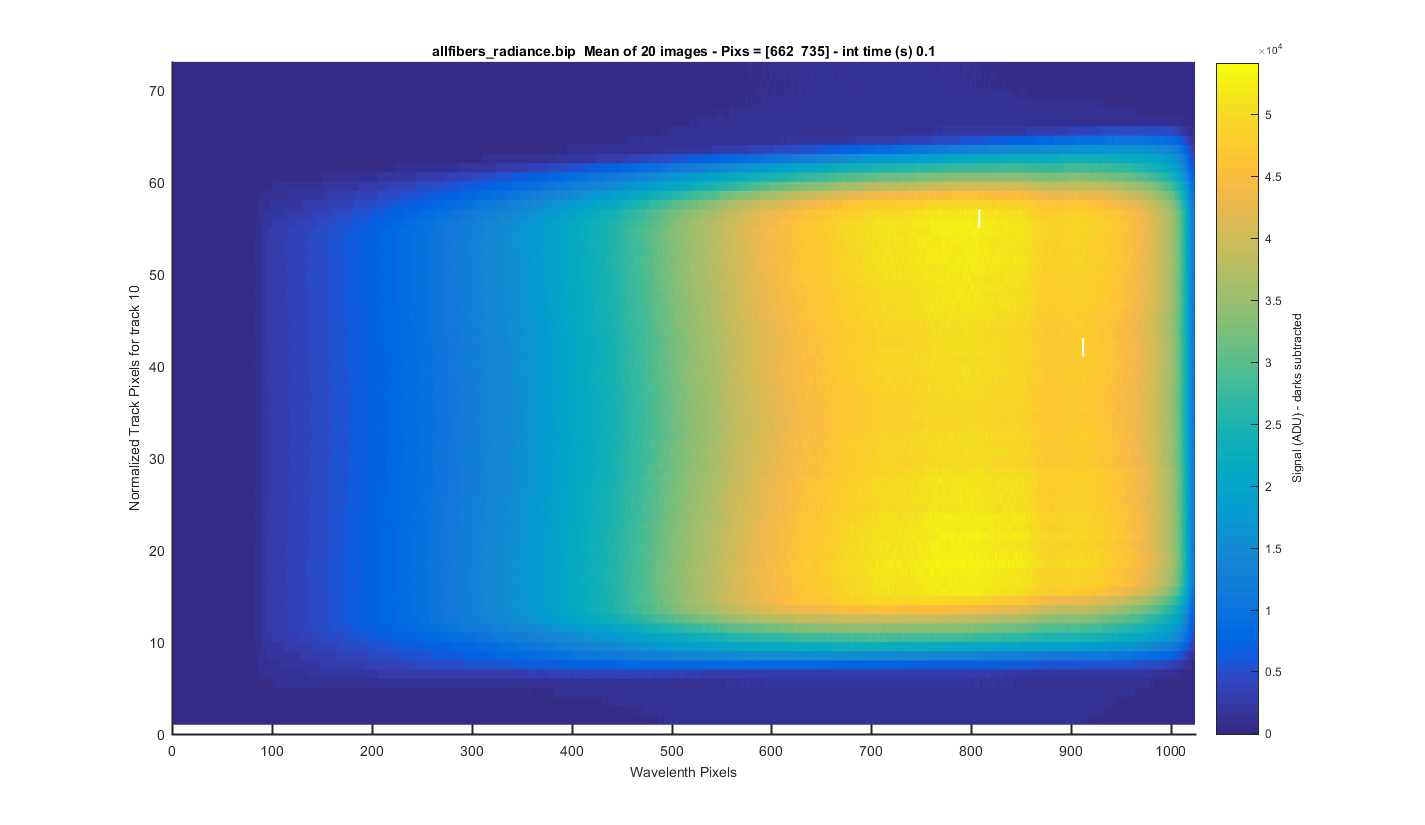
TRACK 10: The meaned image (darks are subtracted) surface plot but for only one track so you can see each track zoomed in. The y-axis is the relative pixel for that track. The title contains the real pixels. I clicked to get these track positions so this will need to be refined in the future.
Figure 21
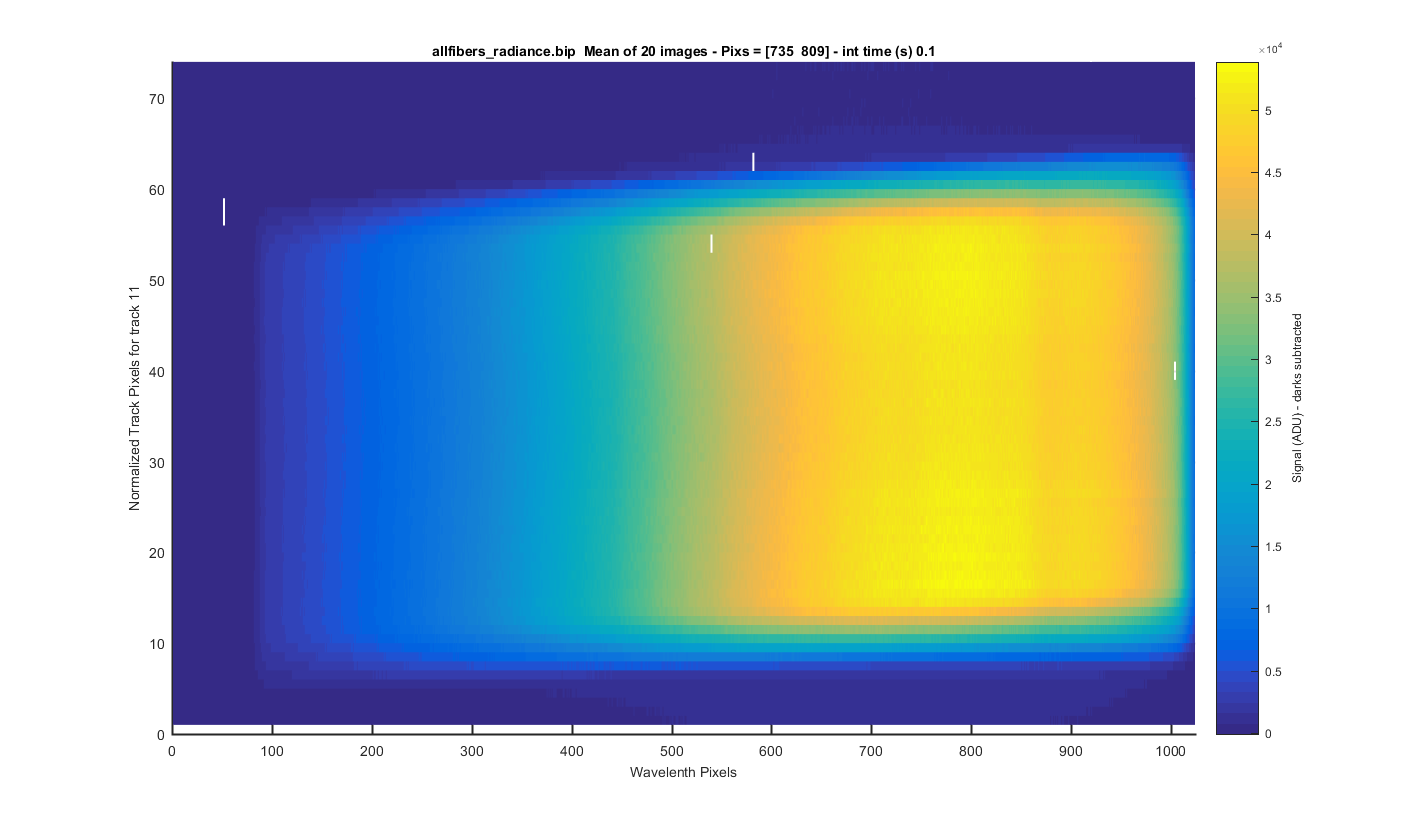
TRACK 11: The meaned image (darks are subtracted) surface plot but for only one track so you can see each track zoomed in. The y-axis is the relative pixel for that track. The title contains the real pixels. I clicked to get these track positions so this will need to be refined in the future.
Figure 22
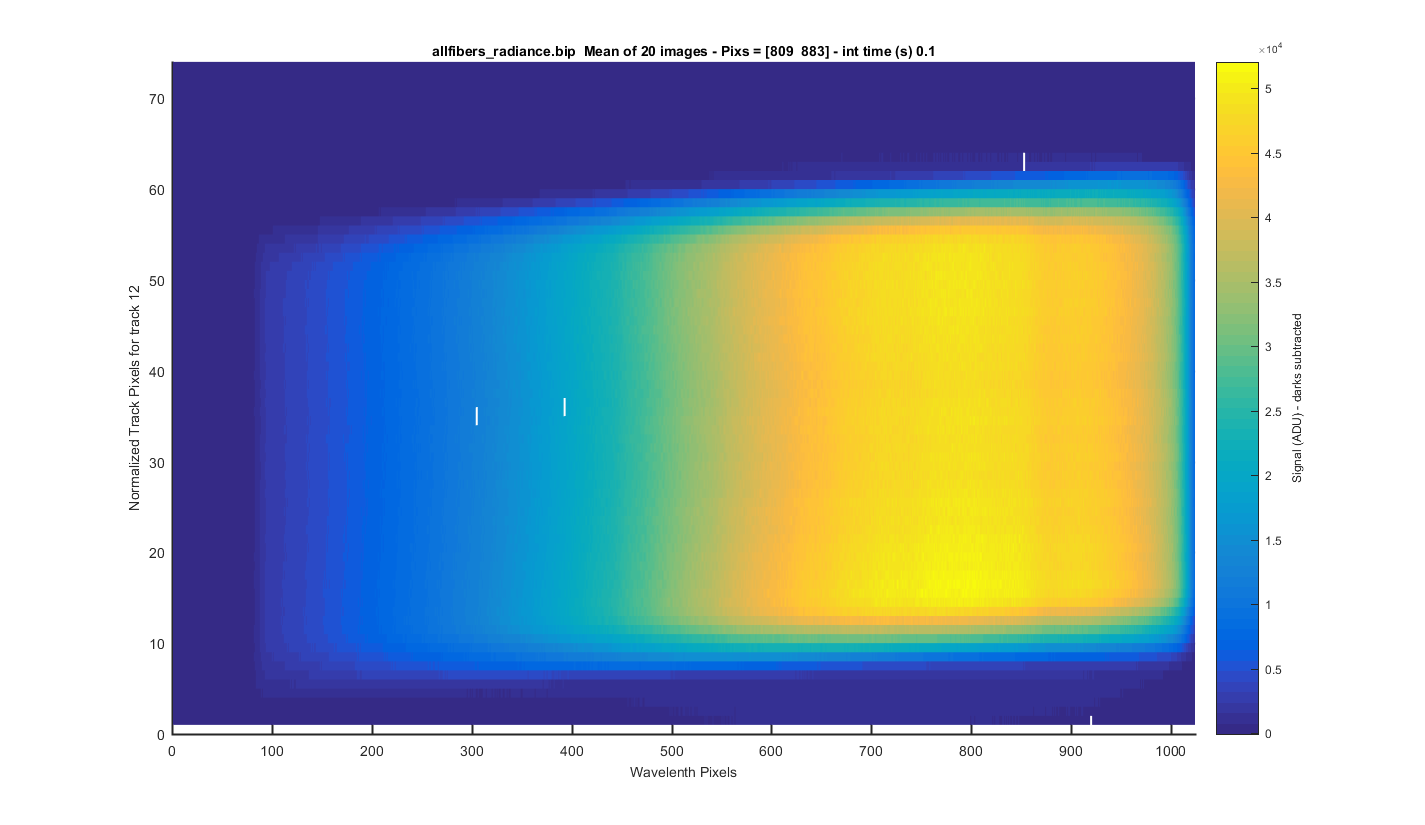
TRACK 12: The meaned image (darks are subtracted) surface plot but for only one track so you can see each track zoomed in. The y-axis is the relative pixel for that track. The title contains the real pixels. I clicked to get these track positions so this will need to be refined in the future.
Figure 23
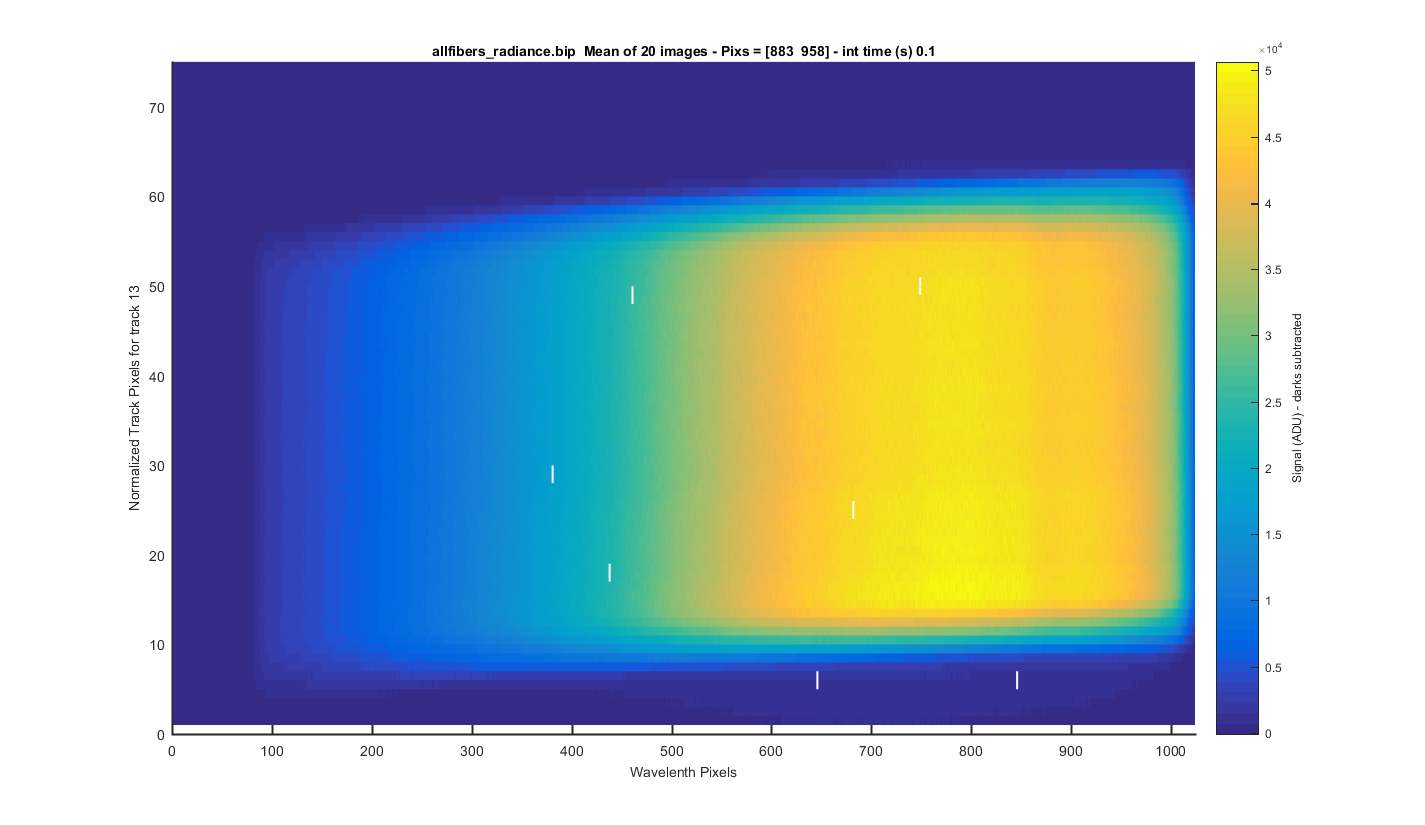
TRACK 13: The meaned image (darks are subtracted) surface plot but for only one track so you can see each track zoomed in. The y-axis is the relative pixel for that track. The title contains the real pixels. I clicked to get these track positions so this will need to be refined in the future.
Figure 24
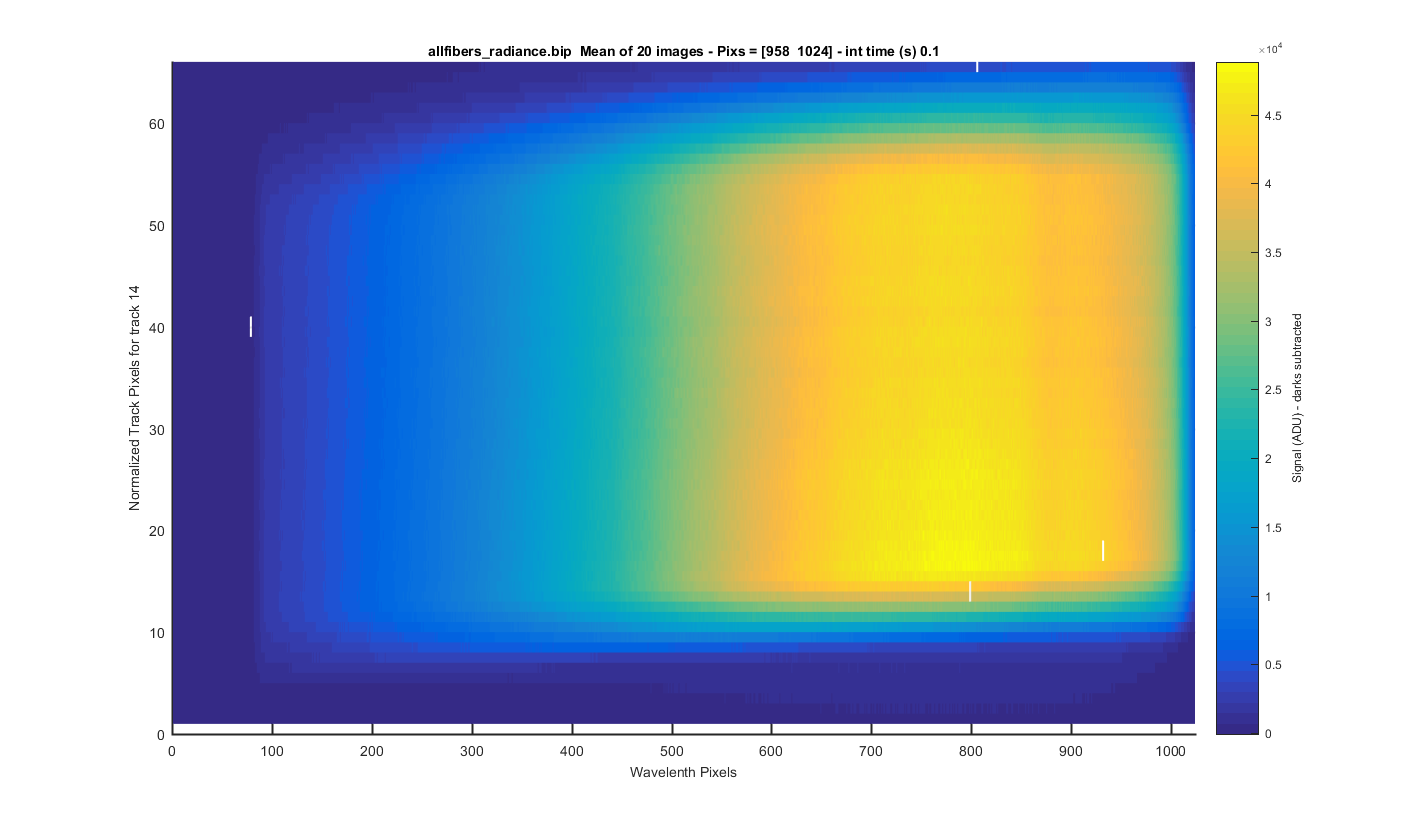
TRACK 14: The meaned image (darks are subtracted) surface plot but for only one track so you can see each track zoomed in. The y-axis is the relative pixel for that track. The title contains the real pixels. I clicked to get these track positions so this will need to be refined in the future.
Figure 25