REVISION DATE: 07-Dec-2015 09:41:10
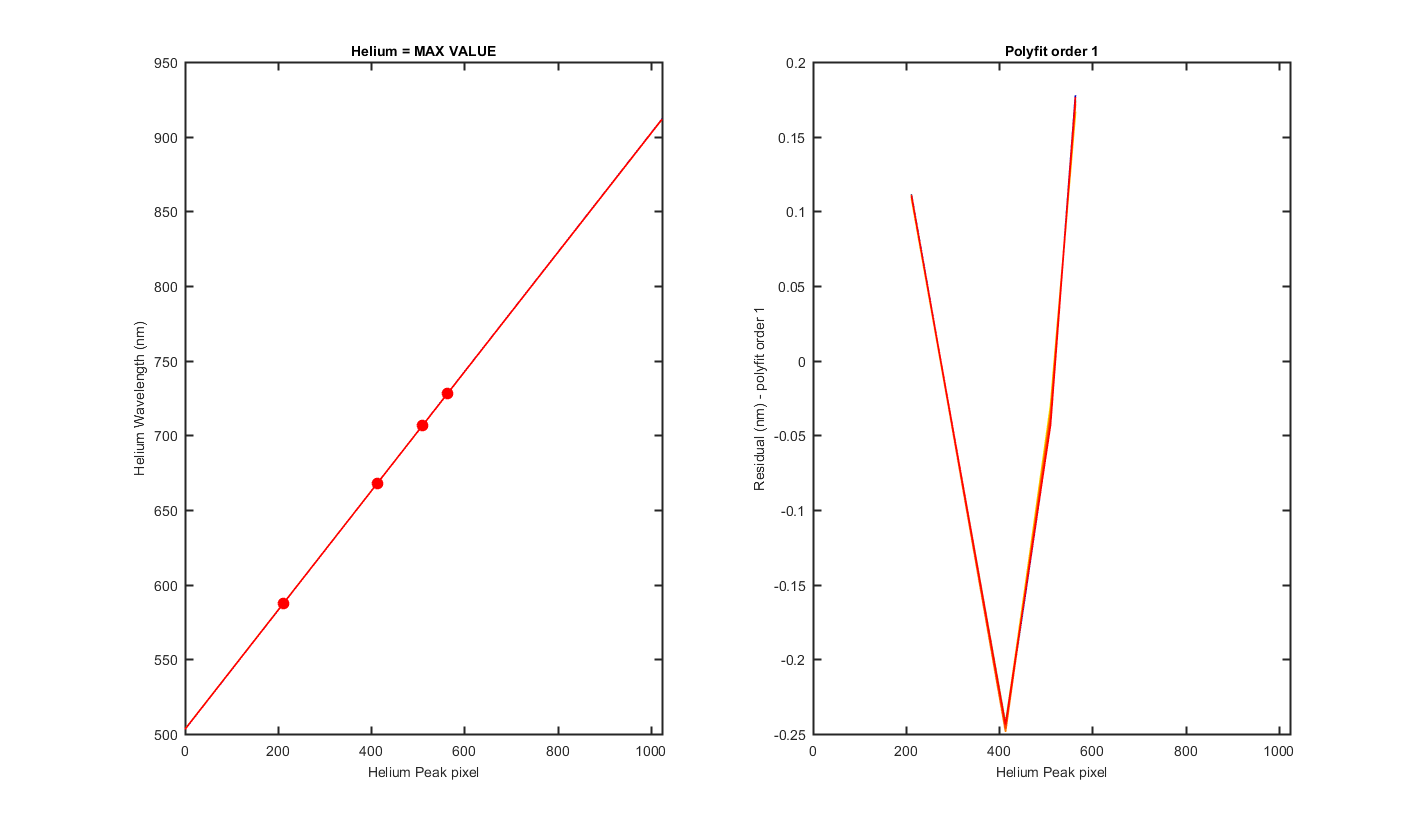
Email from Casey on 4 Dec 2015 11:09 am:

Hi Everyone,

New data is up.

All files were taken without dark noise removed.  You will find the dark noise cube in the folder that is valid for all of
the cubes.  I have also subtracted the temporal mean of the dark noise cube and included those corrected files as well.
The Radiometric Response should be the response of the system in microflicks/DN, but I have not had time to error check this yet.

Integration times of the system are in the header files as "shutter".  This reflects the electronic integration time of the CCD,
as the mechanical shutter is open slightly longer that the CCD is integrating for (as I understand this camera anyway).

The "radiance" file has all of the fibers looking into the integrating sphere.

The data is in calibrated wavelengths.  The spectral range of the system is 503.7 nm to 911.4 nm, although as Mike pointed
out the cut-on wavelength is closer to 540 nm due to the high pass filter coating.

Please let me know if you have questions or have specific data you would like collected.

Thanks,
Casey

MIKES EMAIL-----------------------------------------------------------------------------------------------------
Hi Mark, Hi Steph,

I looked at the NIST Atomic Spectra Database for Helium lines (in-air, nm)
( http://www.nist.gov/pml/data/asd.cfm,  "Lines",  "He I,   500 to 1000 nm"  )

and from the 4x big peaks in helium.bip data from Stephanie, I regressed:
pix=[ 209 411 508 562 ], wav=[ 587.5621 667.8151 706.5190 728.1349 ]
wav_fit(nm) = 504.30 + 0.39813 * pix   (r^2=1.0, SE=0.11, N=4)

This gives pix #1 = 504.70, pix #1024 = 911.97, with pixel separation = 0.40 nm.

 think this is aboot the same as Stephs work (except for her 778 nm point).

The 3x small peaks in helium.bip were somewhat problematic for me:
pix=[ 342 683 848 ], give via the above regression
wav_fit(nm)=[ 640.46 776.22 841.91 ]  -
there is really no NIST He line(s) near 640 nm, and
the nearest NIST to the others are 781.61 & 836.17, which are off by +/- 5 nm.

Cheers, MF

FROM CASEY EMAIL-----------------------------------------------------------------------------------------------------
The spectral range of the system is 503.7 nm to 911.4 nm, although as Mike pointed out the cut-on wavelength is closer to 540 nm due to the high pass filter coating.
Files sent: RadiometricResponse_Microflicks.bip, channel8_radiance.bip, helium.bip allfibers_radiance.bip, channel8_radiance_darkremoved.bip, helium_darkremoved.bip allfibers_radiance_darkremoved.bip, dark_100ms.bip
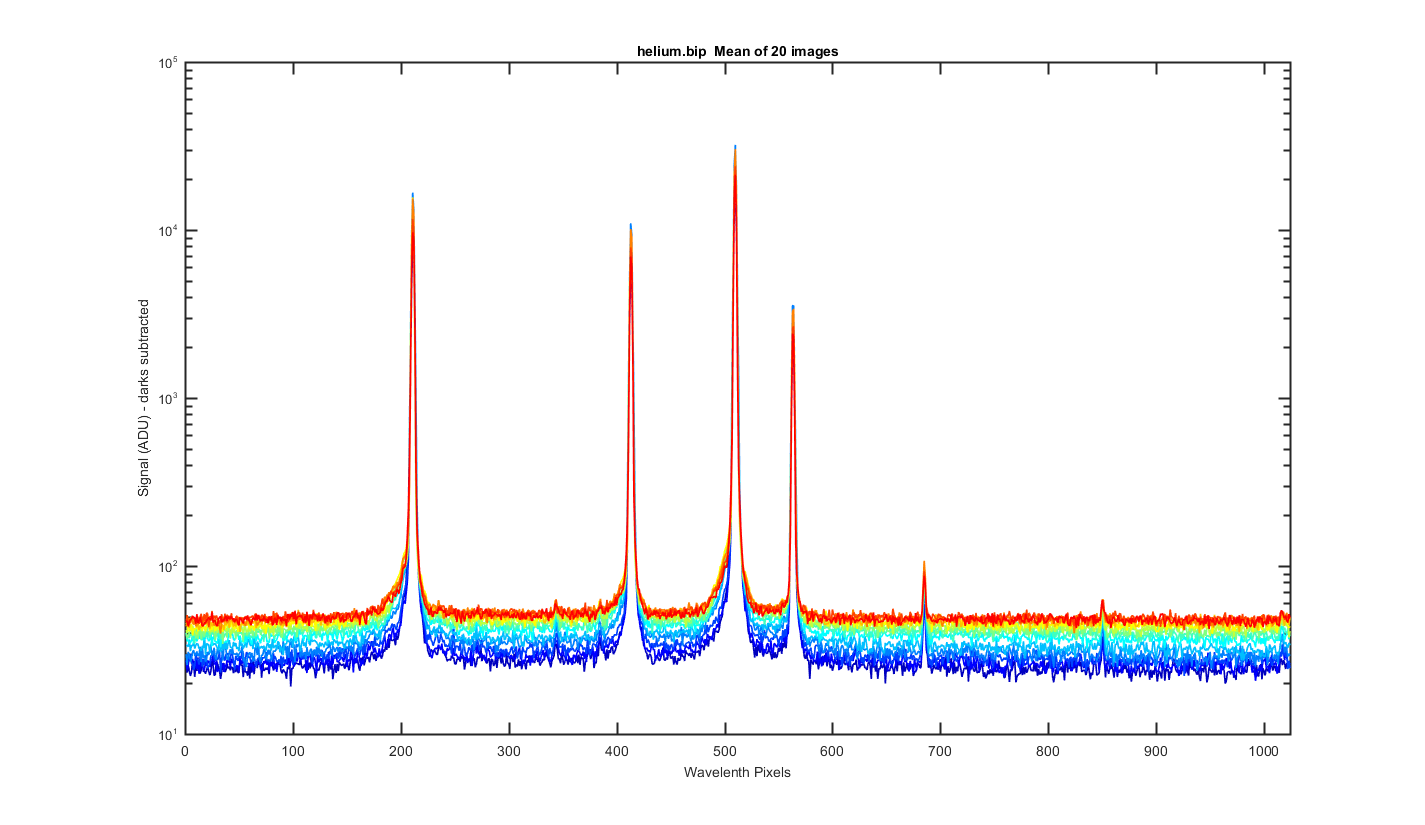
Below are my graphs of the helium.bip file. The file contains 20 dark images at 0.1 sec Note some graphs are dark corrected and some are not so check the axis labels to know what you are looking at.
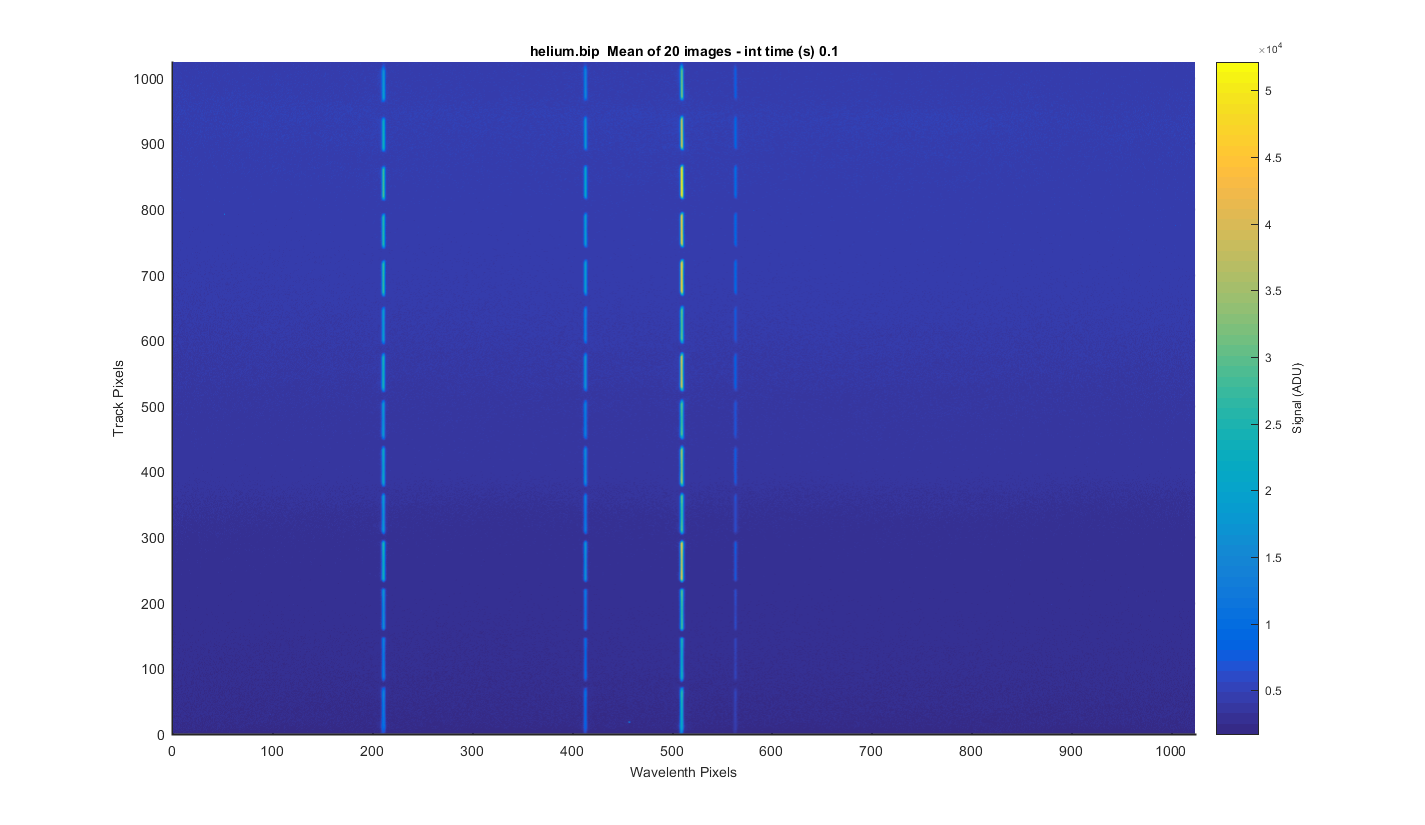
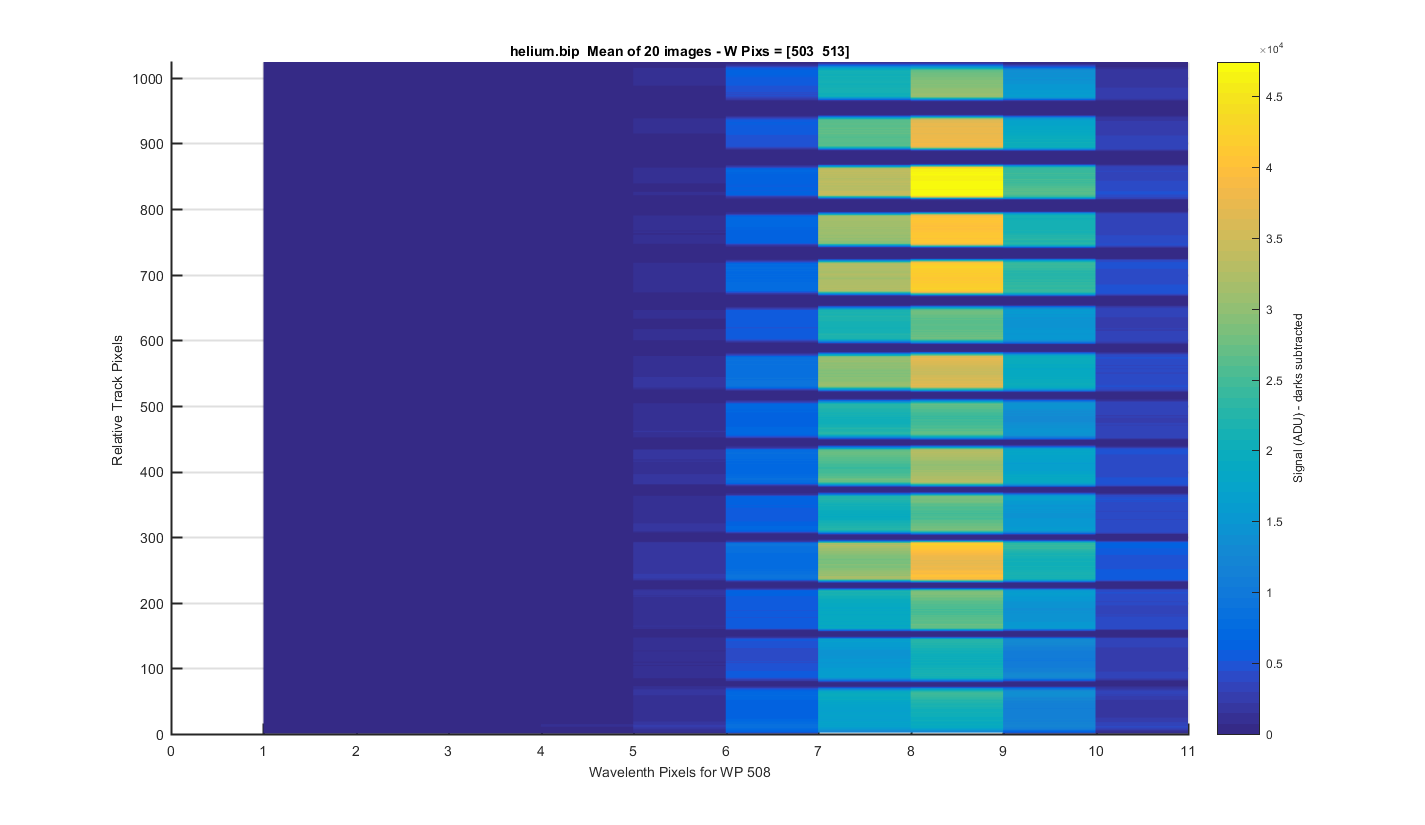
I took the 20 images and meaned them to get the surface plot below. It is a little harder to see the dark track widths here but the look the same as the white light source.
Figure 1
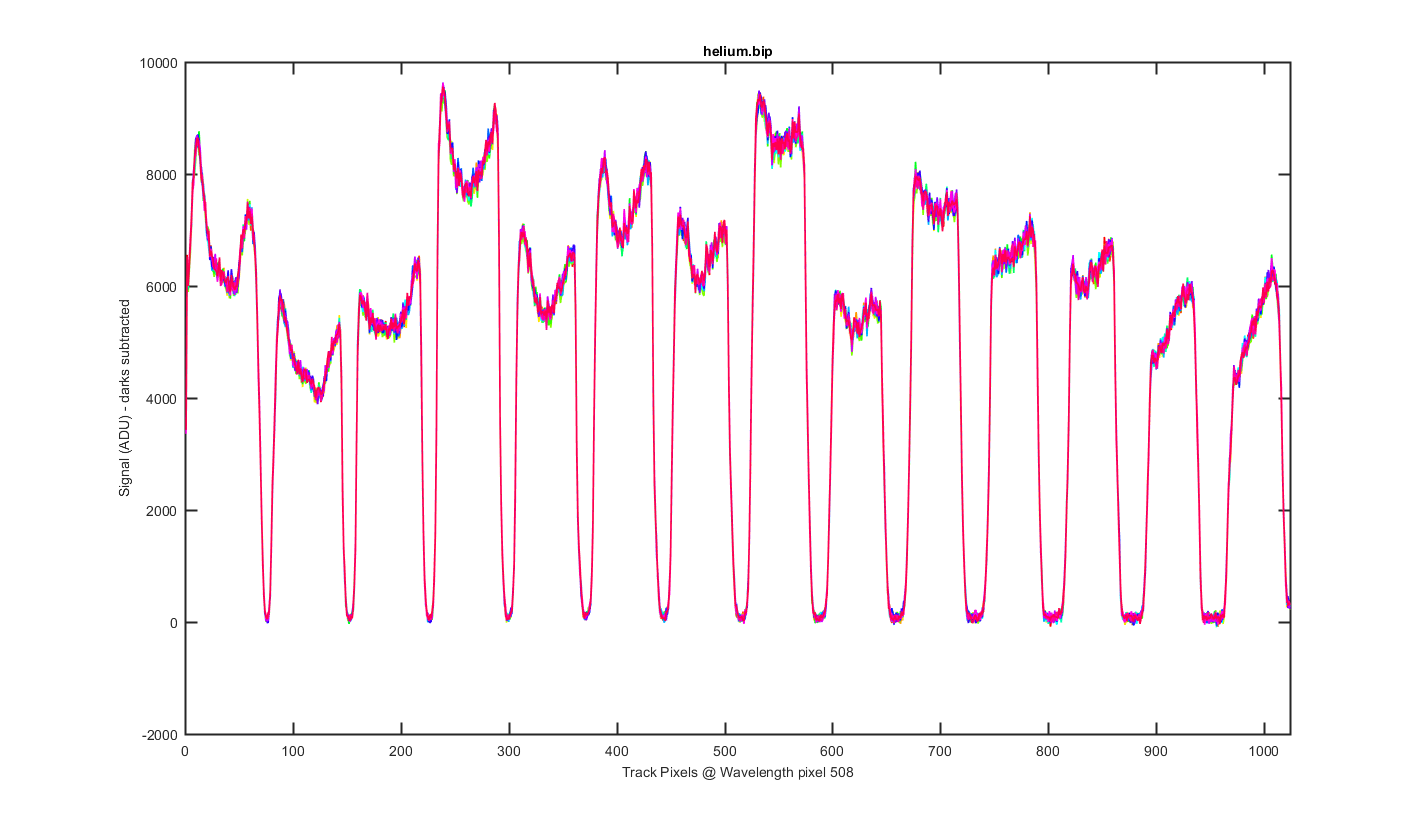
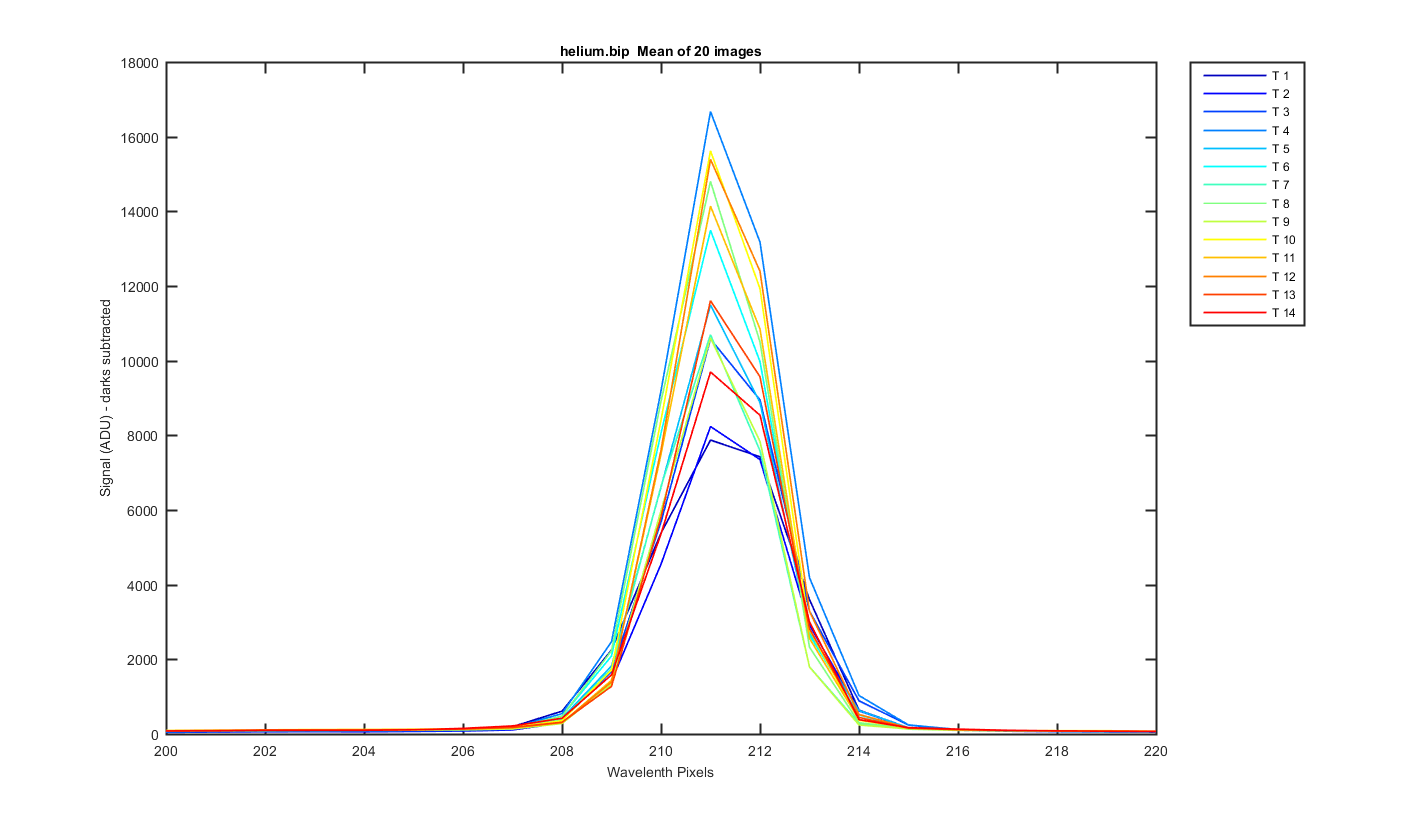
This is a cross section through the tracks at wavelength pixel 508, with one line for each of the 20 images. The tracks and their shapes look really stable. You can see the differences in the width of the spacing between the tracks here too.
Figure 2
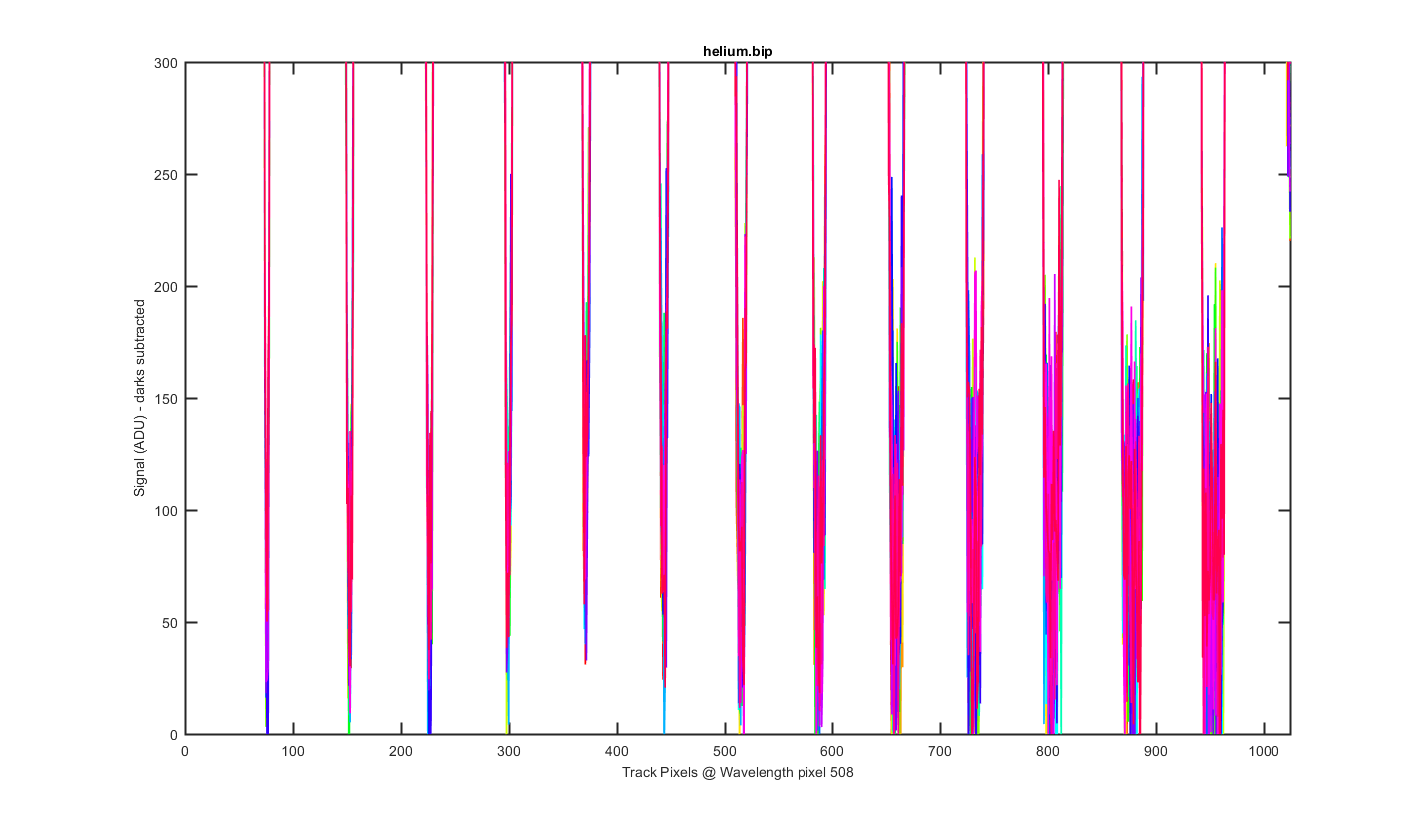
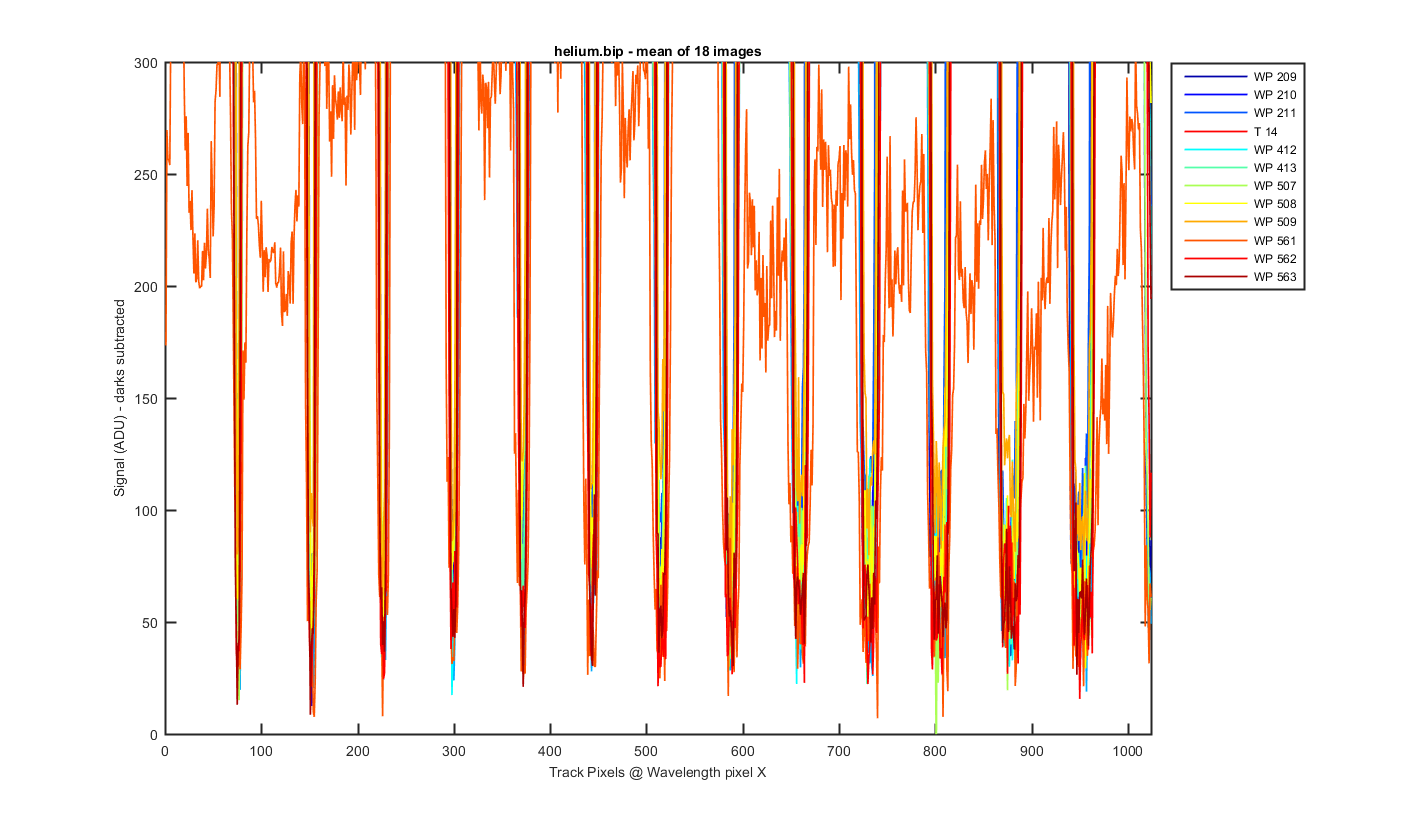
Same as the previous graph but zoomed into the bottom to see the level of the darks between the tracks. For this source the dark tracks go nearly to zero, interesting. I think we saw this before?
Figure 3
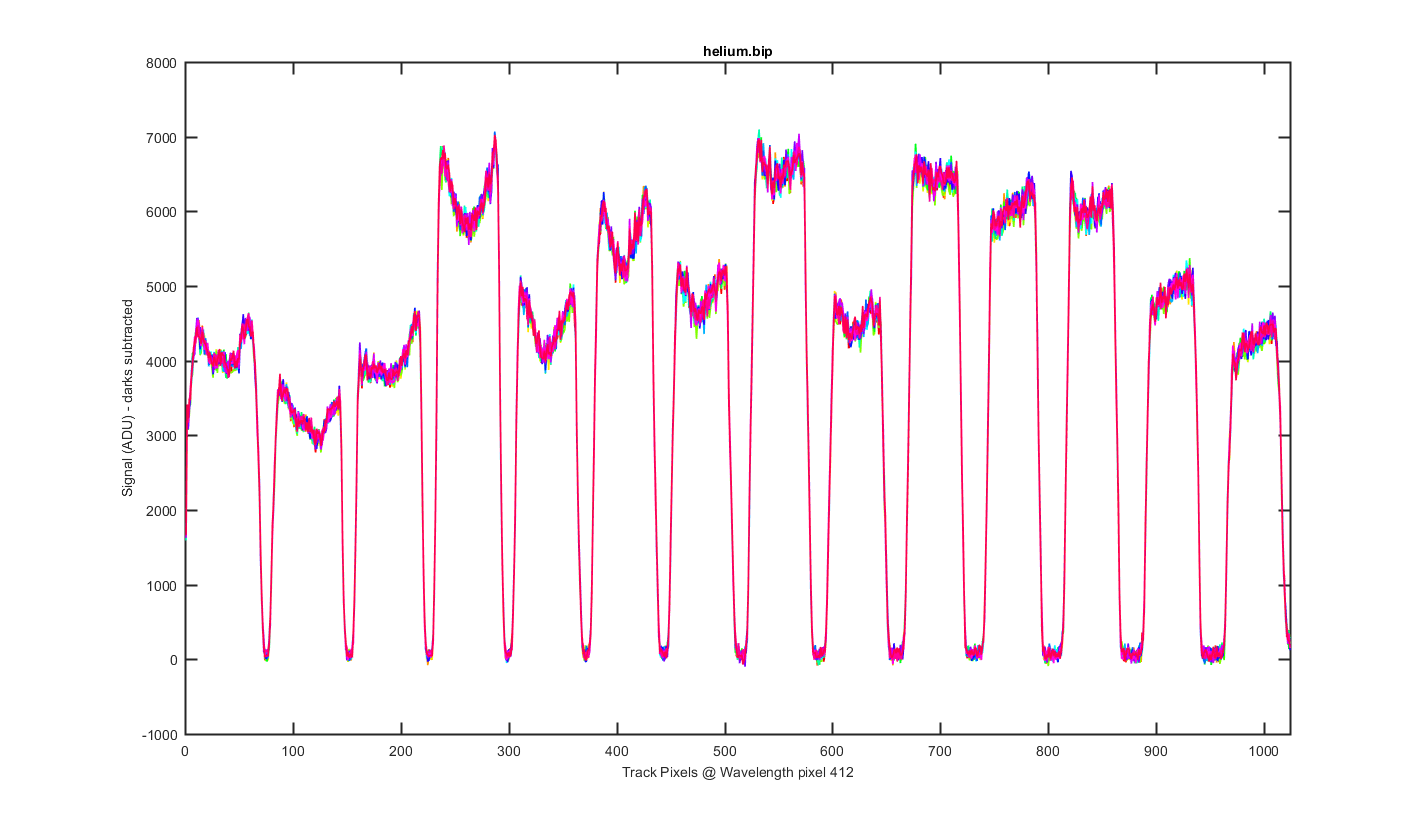
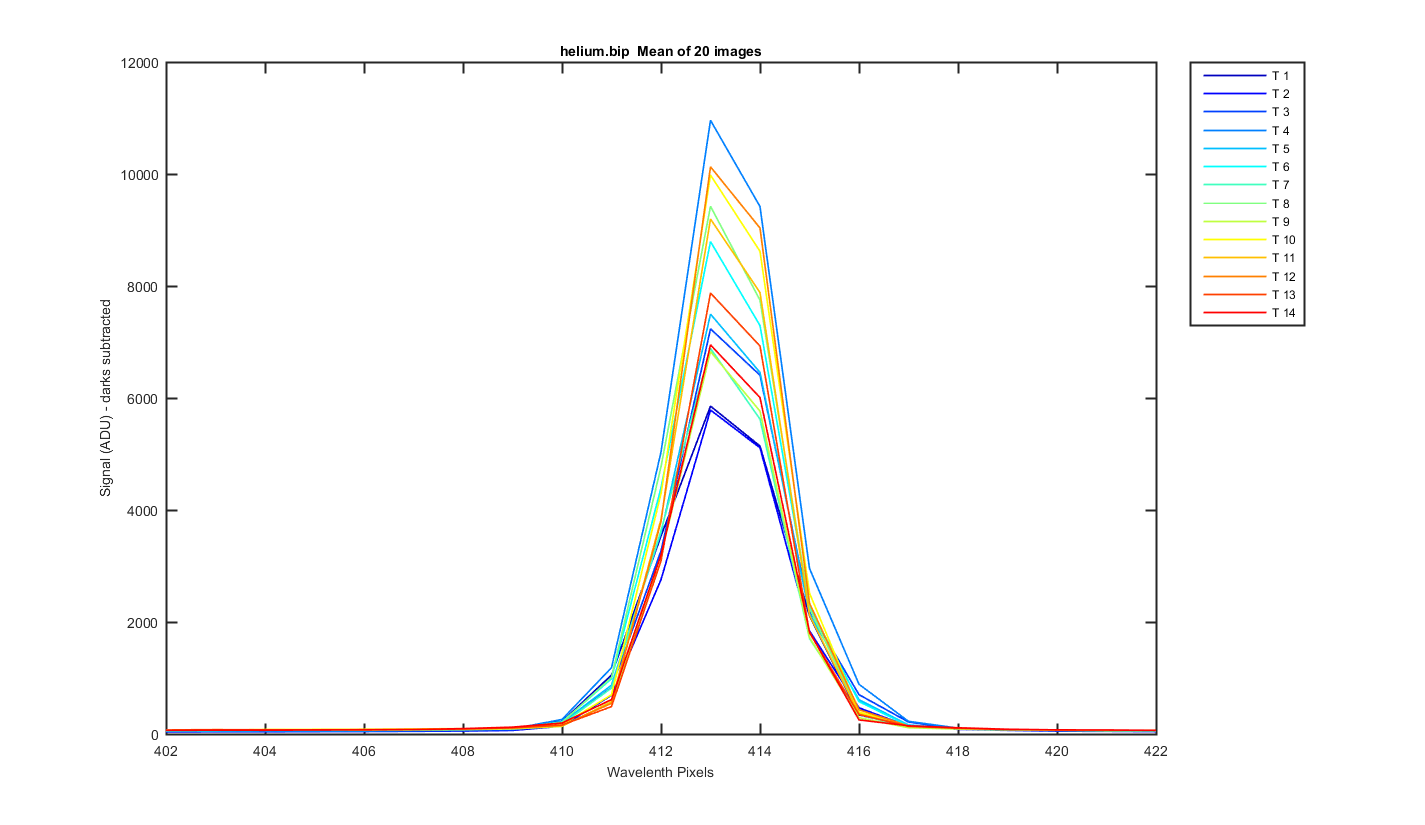
Same as figure 2 but for Wavelength pixel 412.
Figure 4
Again this is the mean image with slices thought the image at different wavelength pixels. The pixels choosen are where the helium peaks are and +- pixel pixel around them.
Figure 5
Same as figure 5 but zoomed to the bottom so you can see the darks between the tracks.
Figure 6
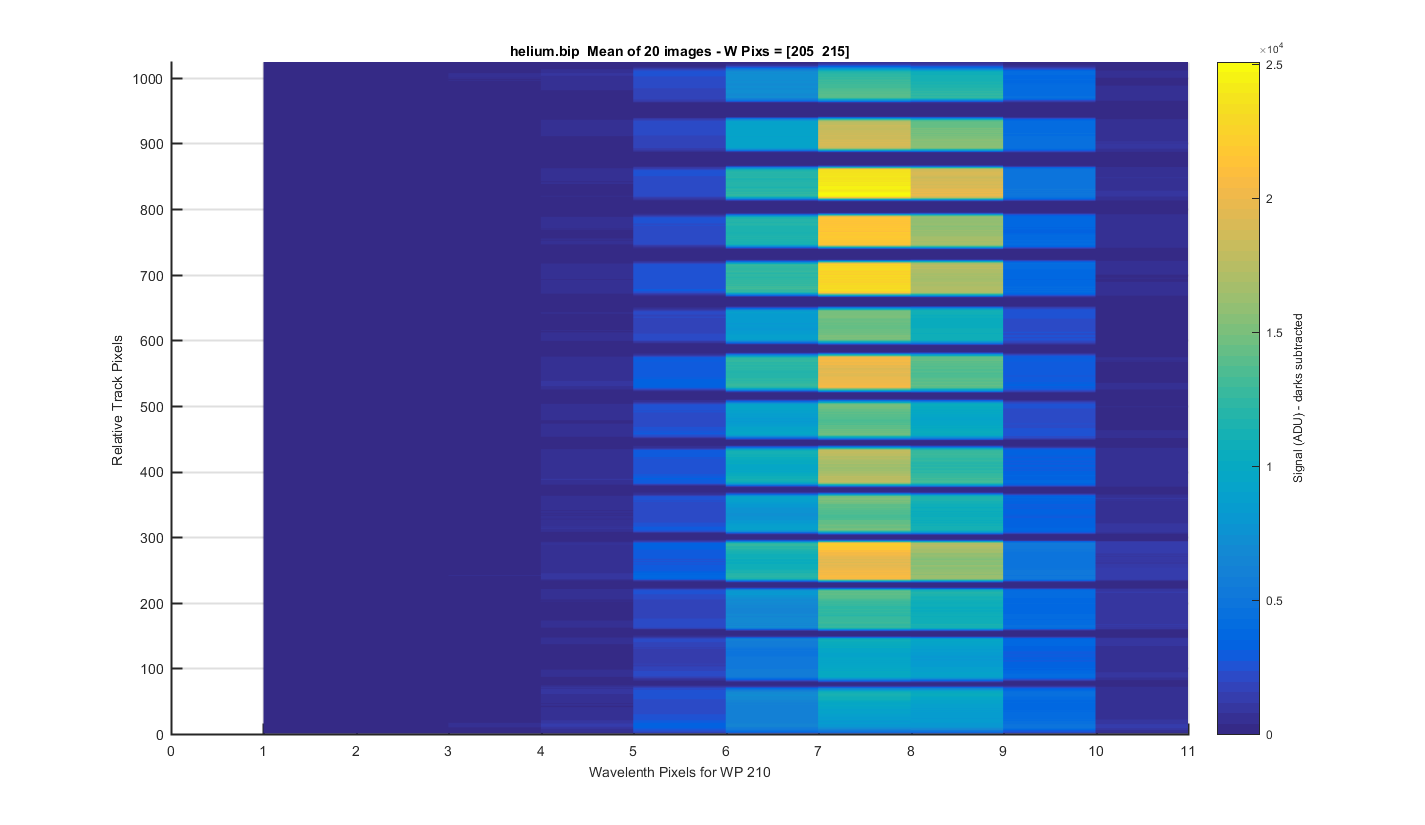
Helimu Peak 1 (at pix 210): The same surface plot but showing how individual helium peaks line up from track to track. Looks pretty good!
Figure 7
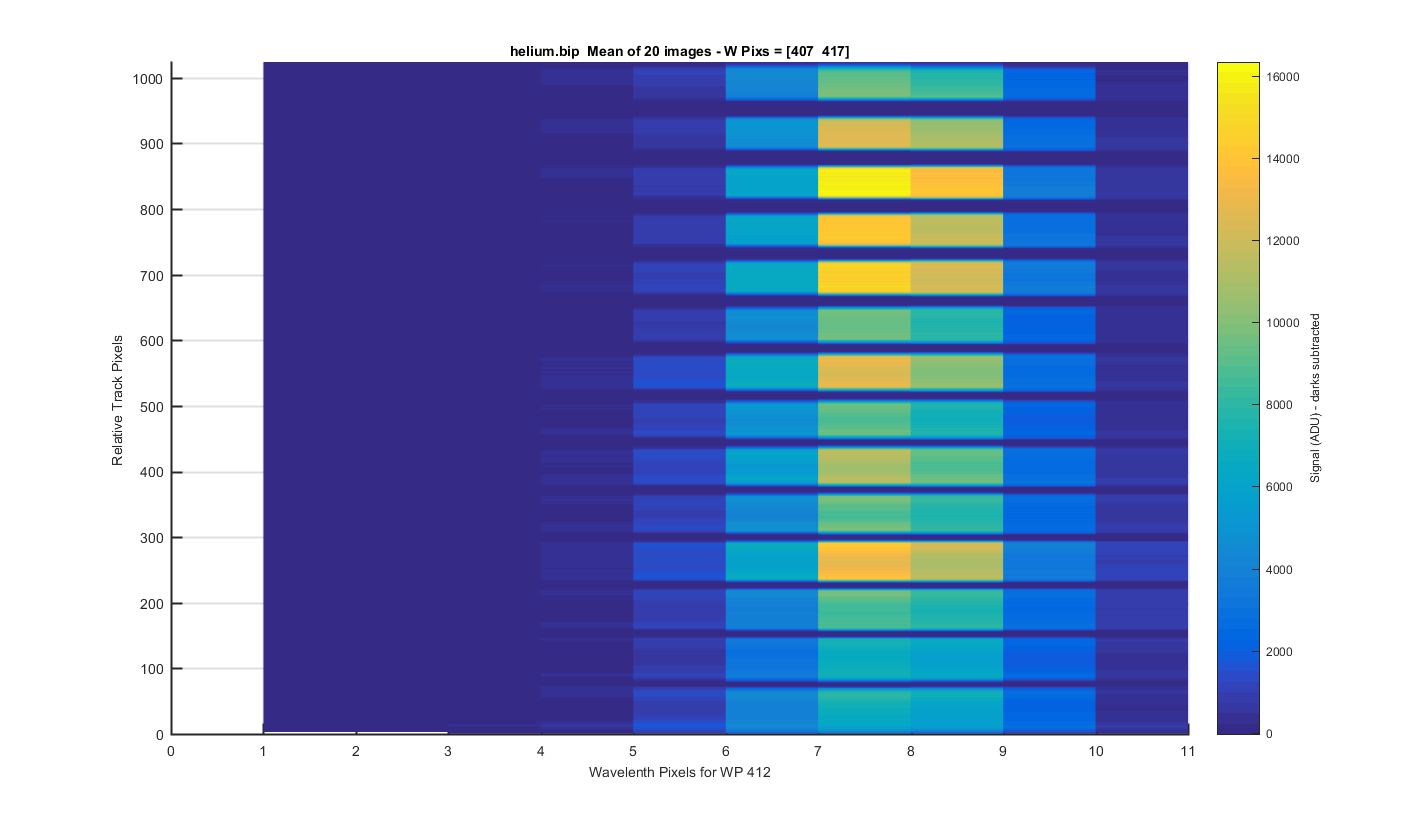
Helimu Peak 2 (at pix 412): The same surface plot but showing how individual helium peaks line up from track to track. Looks pretty good!
Figure 8
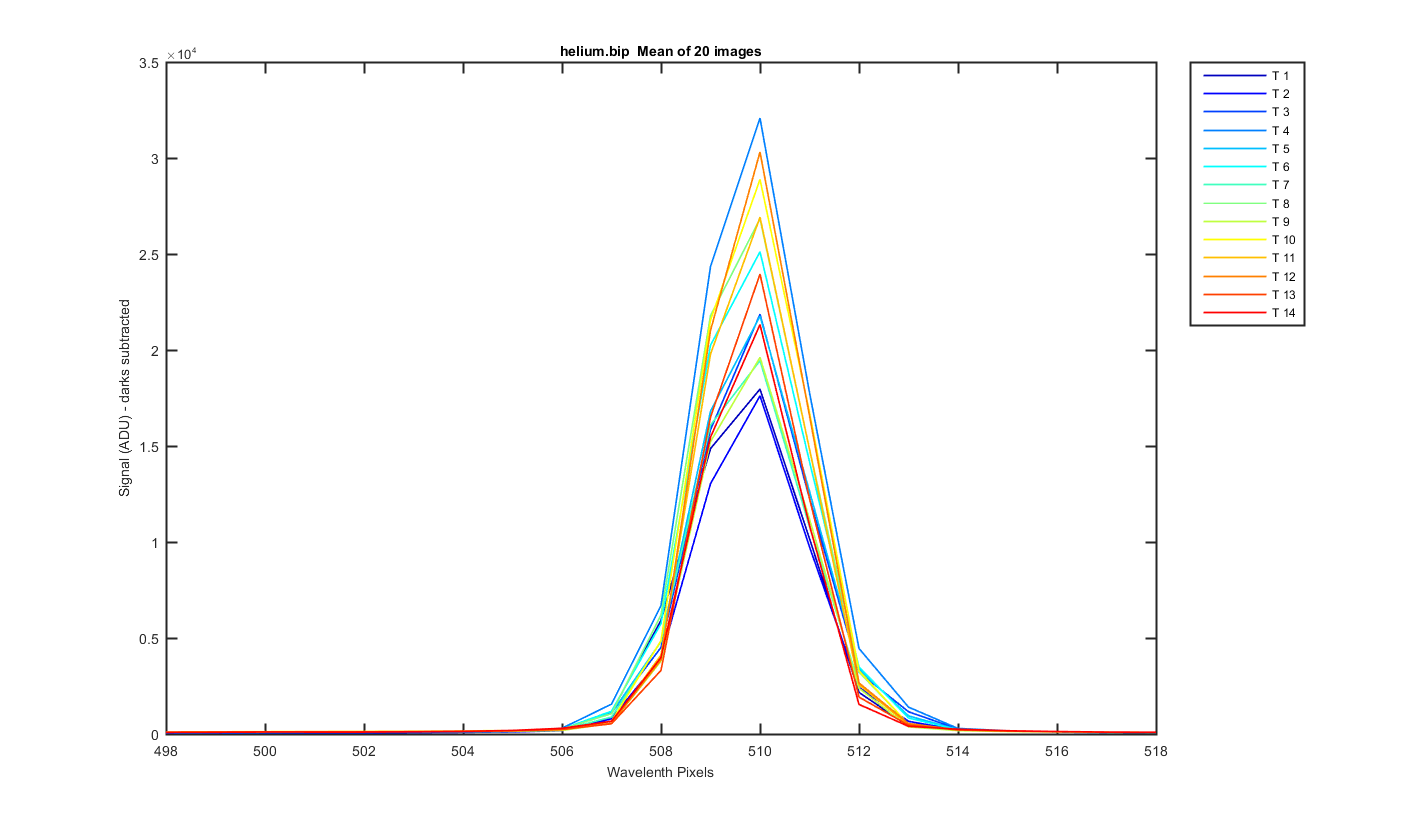
Helimu Peak 3 (at pix 508): The same surface plot but showing how individual helium peaks line up from track to track. Looks pretty good!
Figure 9
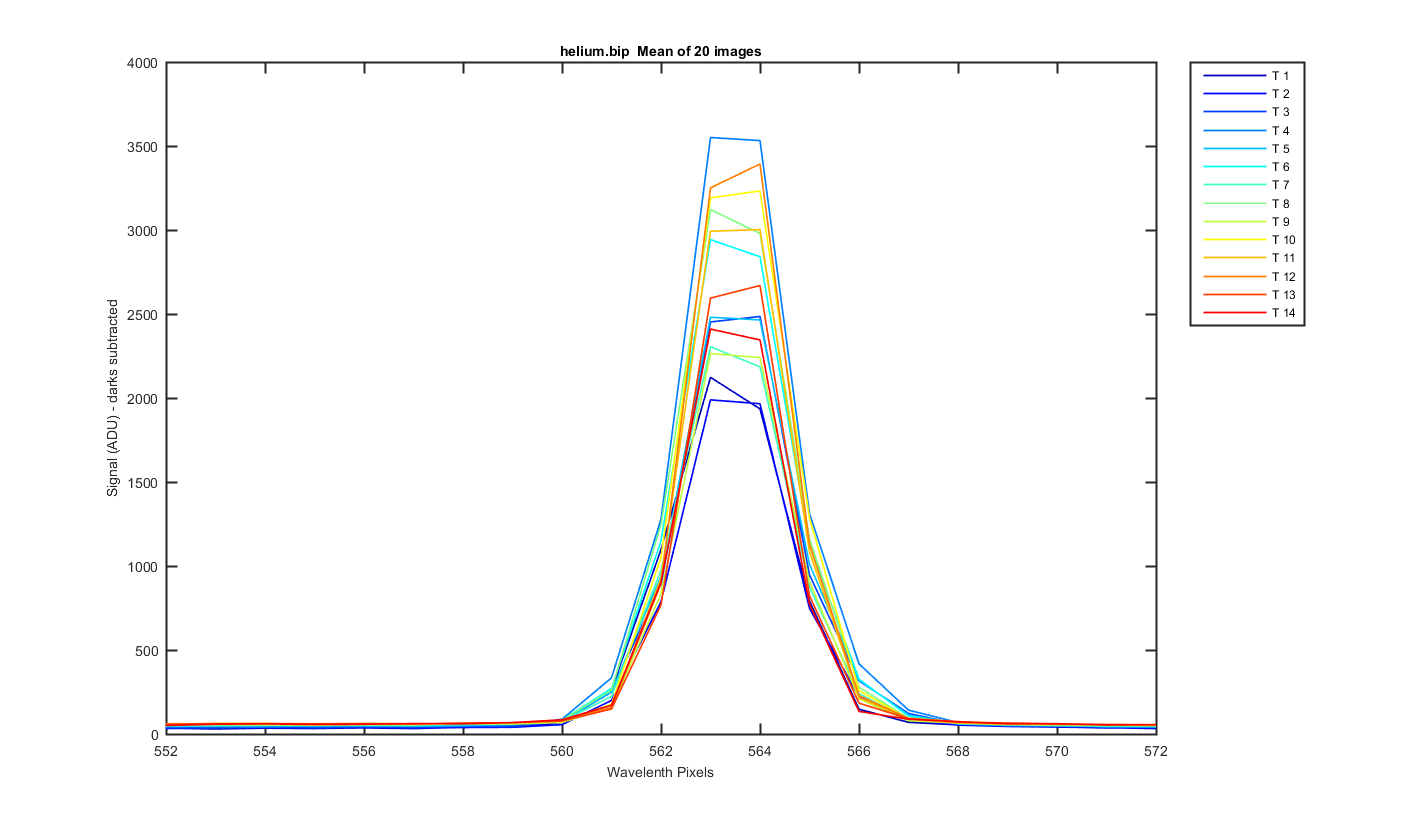
Helimu Peak 4 (at pix 562): The same surface plot but showing how individual helium peaks line up from track to track. Looks pretty good!
Figure 10

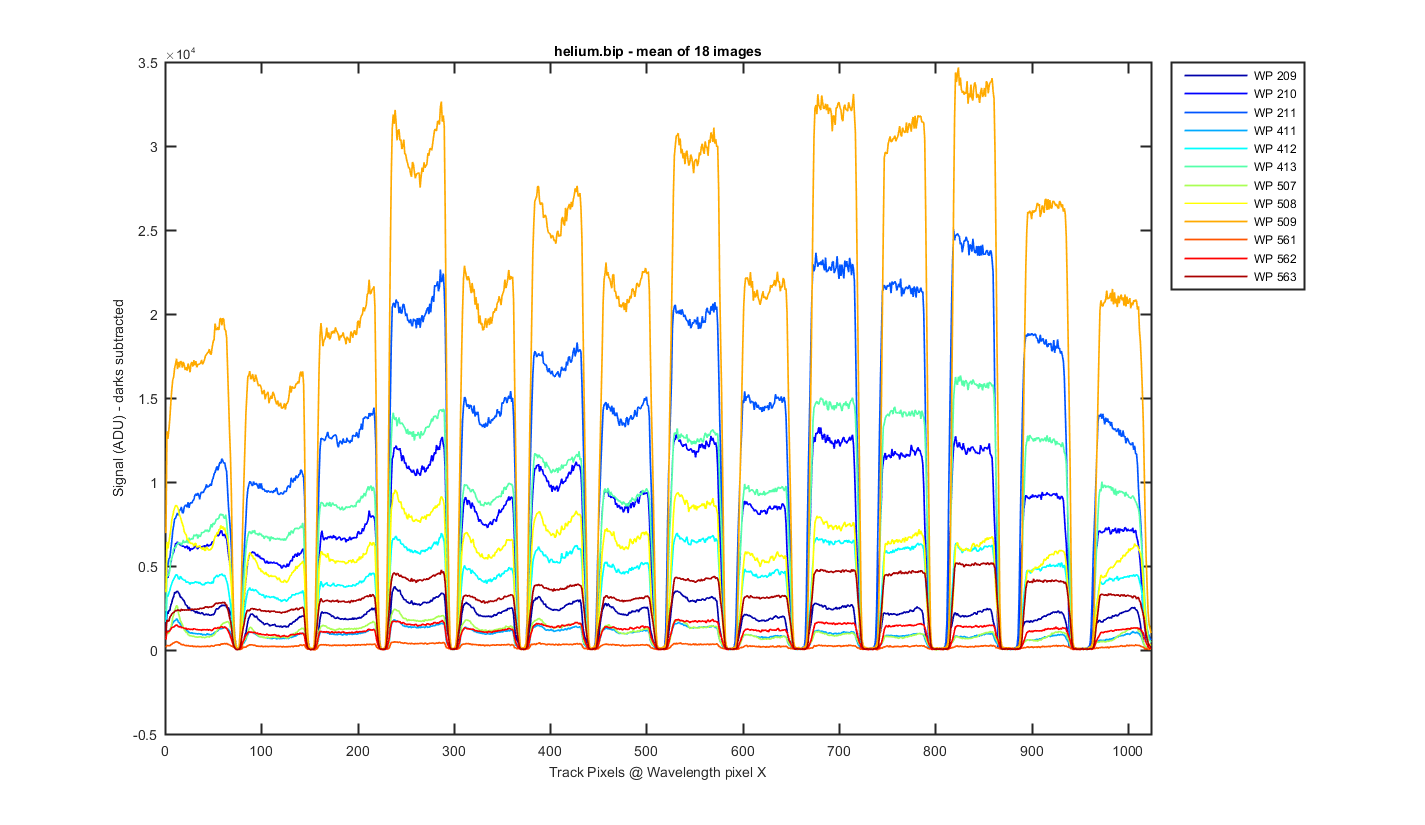
Mean image binned by track, the x-axis is wavelength pixels.
Figure 11
Close up of one of the helium peaks
Figure 12
Close up of one of the helium peaks
Figure 13
Close up of one of the helium peaks
Figure 14
Close up of one of the helium peaks
Figure 15
MY VERY ROUGH GUESS AT A WAVELENGTH CAL!!! THIS ASSUMES I GUESS CORRECTLY WHICH PEAKS WHERE WHICH HELIUM LINES. Originally I had ~ 506.51, 921.42, but after Mikes email I drop the peak at 683 and changed from 2nd order to linear. Mikes says "pix #1 = 504.70, pix #1024 = 911.97, with pixel separation = 0.40 nm" And Casey says "The spectral range of the system is 503.7 nm to 911.4 nm"
Track, Min,    Max,     diff
    1, 503.56, 911.77,  0.40
    2, 503.54, 911.70,  0.40
    3, 503.57, 911.65,  0.40
    4, 503.62, 911.62,  0.40
    5, 503.65, 911.58,  0.40
    6, 503.66, 911.60,  0.40
    7, 503.68, 911.60,  0.40
    8, 503.68, 911.59,  0.40
    9, 503.65, 911.59,  0.40
   10, 503.63, 911.58,  0.40
   11, 503.62, 911.60,  0.40
   12, 503.61, 911.59,  0.40
   13, 503.59, 911.64,  0.40
   14, 503.56, 911.70,  0.40
Figure 16
  Track = The Resonon Track number
Lwave = Laser Wavelength
Lpix1 = Laser Pixel found using the max value of the track
Lpix2 = Laser Pixel found using mygaussfit to fit the laser peak
| Track | Lwave | Lpix1 | Lpix2 |
|---|---|---|---|
| 1 | 587.5621 | 211 | 211.24 |
| 1 | 667.8151 | 413 | 413.26 |
| 1 | 706.519 | 510 | 509.74 |
| 1 | 728.1349 | 563 | 563.36 |
| 2 | 587.5621 | 211 | 211.31 |
| 2 | 667.8151 | 413 | 413.35 |
| 2 | 706.519 | 510 | 509.84 |
| 2 | 728.1349 | 563 | 563.48 |
| 3 | 587.5621 | 211 | 211.28 |
| 3 | 667.8151 | 413 | 413.36 |
| 3 | 706.519 | 510 | 509.86 |
| 3 | 728.1349 | 564 | 563.52 |
| 4 | 587.5621 | 211 | 211.20 |
| 4 | 667.8151 | 413 | 413.32 |
| 4 | 706.519 | 510 | 509.84 |
| 4 | 728.1349 | 563 | 563.51 |
| 5 | 587.5621 | 211 | 211.16 |
| 5 | 667.8151 | 413 | 413.31 |
| 5 | 706.519 | 510 | 509.85 |
| 5 | 728.1349 | 563 | 563.52 |
| 6 | 587.5621 | 211 | 211.13 |
| 6 | 667.8151 | 413 | 413.27 |
| 6 | 706.519 | 510 | 509.82 |
| 6 | 728.1349 | 563 | 563.49 |
| 7 | 587.5621 | 211 | 211.08 |
| 7 | 667.8151 | 413 | 413.23 |
| 7 | 706.519 | 510 | 509.79 |
| 7 | 728.1349 | 563 | 563.46 |
| 8 | 587.5621 | 211 | 211.10 |
| 8 | 667.8151 | 413 | 413.24 |
| 8 | 706.519 | 510 | 509.81 |
| 8 | 728.1349 | 563 | 563.47 |
| 9 | 587.5621 | 211 | 211.15 |
| 9 | 667.8151 | 413 | 413.30 |
| 9 | 706.519 | 510 | 509.81 |
| 9 | 728.1349 | 563 | 563.52 |
| 10 | 587.5621 | 211 | 211.20 |
| 10 | 667.8151 | 413 | 413.33 |
| 10 | 706.519 | 510 | 509.85 |
| 10 | 728.1349 | 564 | 563.56 |
| 11 | 587.5621 | 211 | 211.21 |
| 11 | 667.8151 | 413 | 413.32 |
| 11 | 706.519 | 510 | 509.84 |
| 11 | 728.1349 | 564 | 563.54 |
| 12 | 587.5621 | 211 | 211.23 |
| 12 | 667.8151 | 413 | 413.37 |
| 12 | 706.519 | 510 | 509.88 |
| 12 | 728.1349 | 564 | 563.56 |
| 13 | 587.5621 | 211 | 211.25 |
| 13 | 667.8151 | 413 | 413.35 |
| 13 | 706.519 | 510 | 509.86 |
| 13 | 728.1349 | 564 | 563.52 |
| 14 | 587.5621 | 211 | 211.27 |
| 14 | 667.8151 | 413 | 413.31 |
| 14 | 706.519 | 510 | 509.82 |
| 14 | 728.1349 | 563 | 563.45 |