REVISION DATE: 07-Dec-2015 13:00:19
Email from Casey on 4 Dec 2015 11:09 am:

Hi Everyone,

New data is up.

All files were taken without dark noise removed.  You will find the dark noise cube in the folder that is valid for all of
the cubes.  I have also subtracted the temporal mean of the dark noise cube and included those corrected files as well.
The Radiometric Response should be the response of the system in microflicks/DN, but I have not had time to error check this yet.

Integration times of the system are in the header files as "shutter".  This reflects the electronic integration time of the CCD,
as the mechanical shutter is open slightly longer that the CCD is integrating for (as I understand this camera anyway).

The "radiance" file has all of the fibers looking into the integrating sphere.

The data is in calibrated wavelengths.  The spectral range of the system is 503.7 nm to 911.4 nm, although as Mike pointed
out the cut-on wavelength is closer to 540 nm due to the high pass filter coating.

Please let me know if you have questions or have specific data you would like collected.

Thanks,
Casey


Hi Steph,

    I apologize, I neglected to tell you that one more factor is necessary for your calculation.  The lamp is too bright for the MOBY system, so
    it had to be shuttered down with a mechanical iris between the lamp and the integrating sphere.  The calibration data I previously sent is
    done at a total luminance of 1.586E3 foot-lamberts, and the iris was adjusted to 1.2467E2 foot-lamberts, so I believe your response calculation
    needs to be multiplied by 12.72.  Does that seem correct?

cs
Files sent: RadiometricResponse_Microflicks.bip, channel8_radiance.bip, helium.bip allfibers_radiance.bip, channel8_radiance_darkremoved.bip, helium_darkremoved.bip allfibers_radiance_darkremoved.bip, dark_100ms.bip
Below are my graphs of the RadiometricResponse_Microflicks.bip file. The Radiometric Response should be the response of the system in microflicks/DN, but I have not had time to error check this yet. Note that figures 1 - 9 are the system response calculated by Resonon (asumming this is really Casey). Looks like they did the math on the entire image. I.E. they subtracted the dark image from light image and then applied the lamp data. I asked Casey for their lamp data to do the math myself and get the units in something I am familiary with. So figures 11 on show the Resonon lamp data and my math to calc a system response. Two differences: 1) I did my math on the data after being converted to tracks and 2) my units take into account the integration time so the units of the system response are comparable to MOBY resps.
According to wikipedia "One flick corresponds to a spectral radiance of 1 watt per steradian per square centimeter of surface per micrometer of span in wavelength (W·sr?1·cm?2·?m?1)." Converts mean that 1 microflick = 10^6 µW/cm^2/sr/nm (I think).
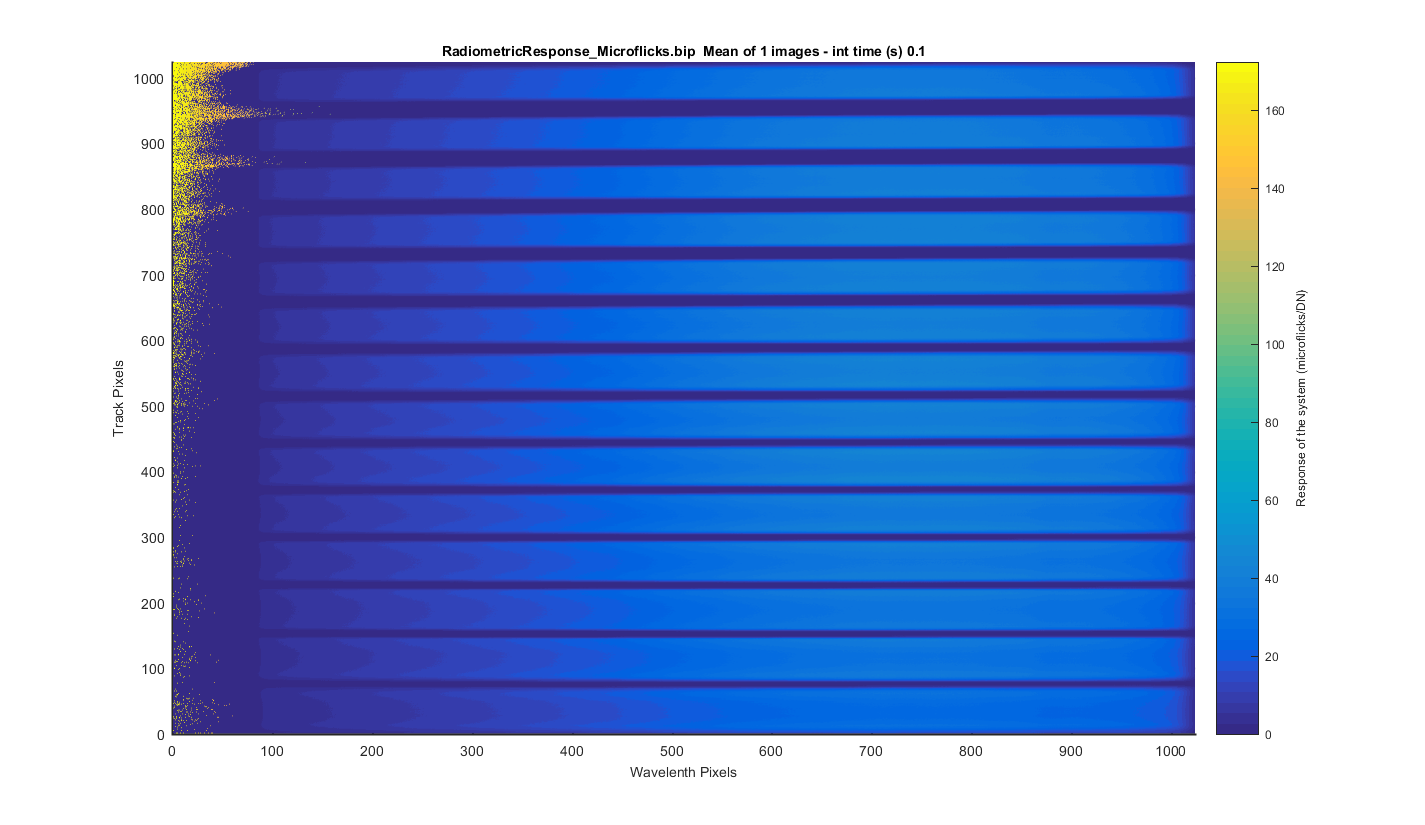
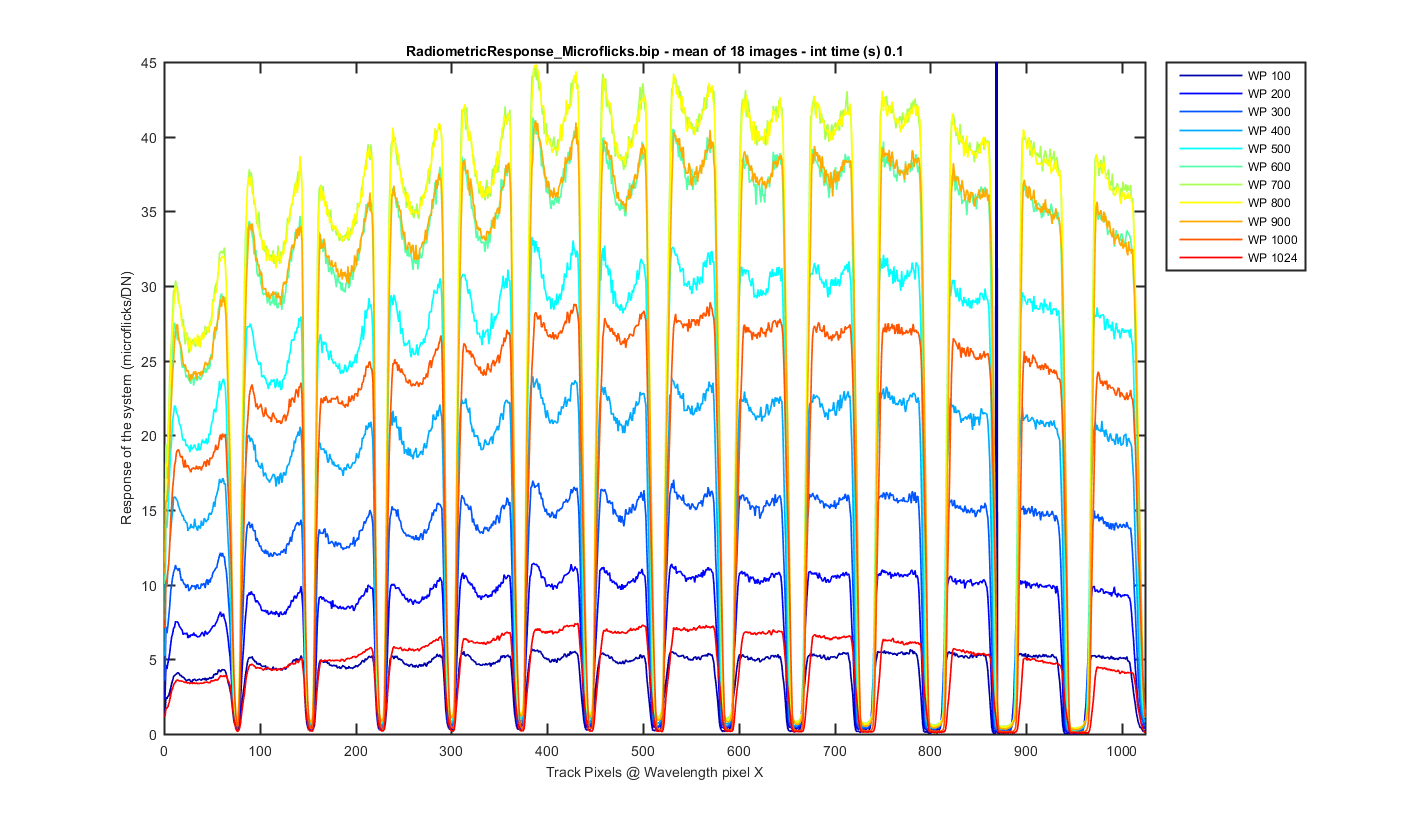
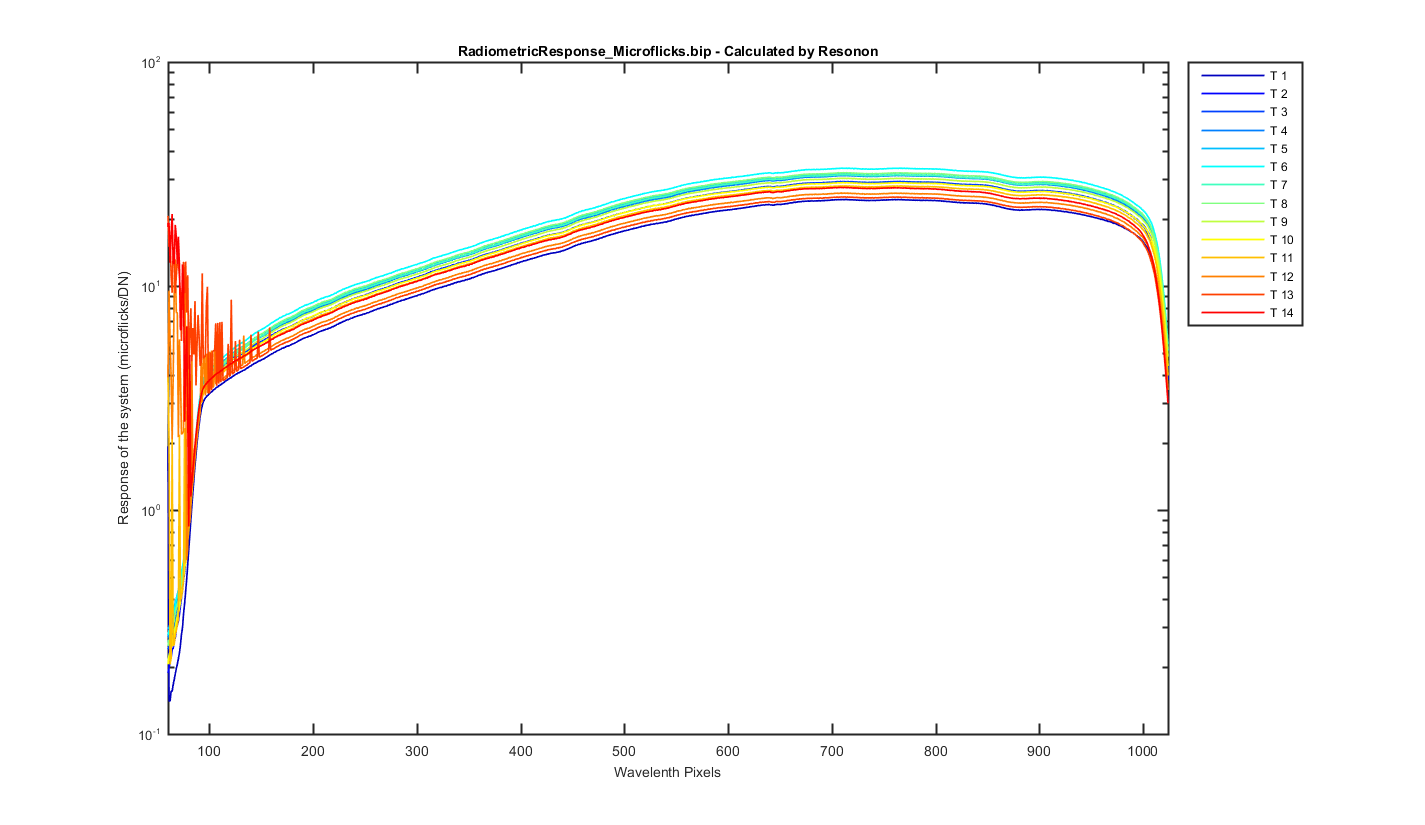
Image send by Casey (values are float). Units are microflicks/DN.
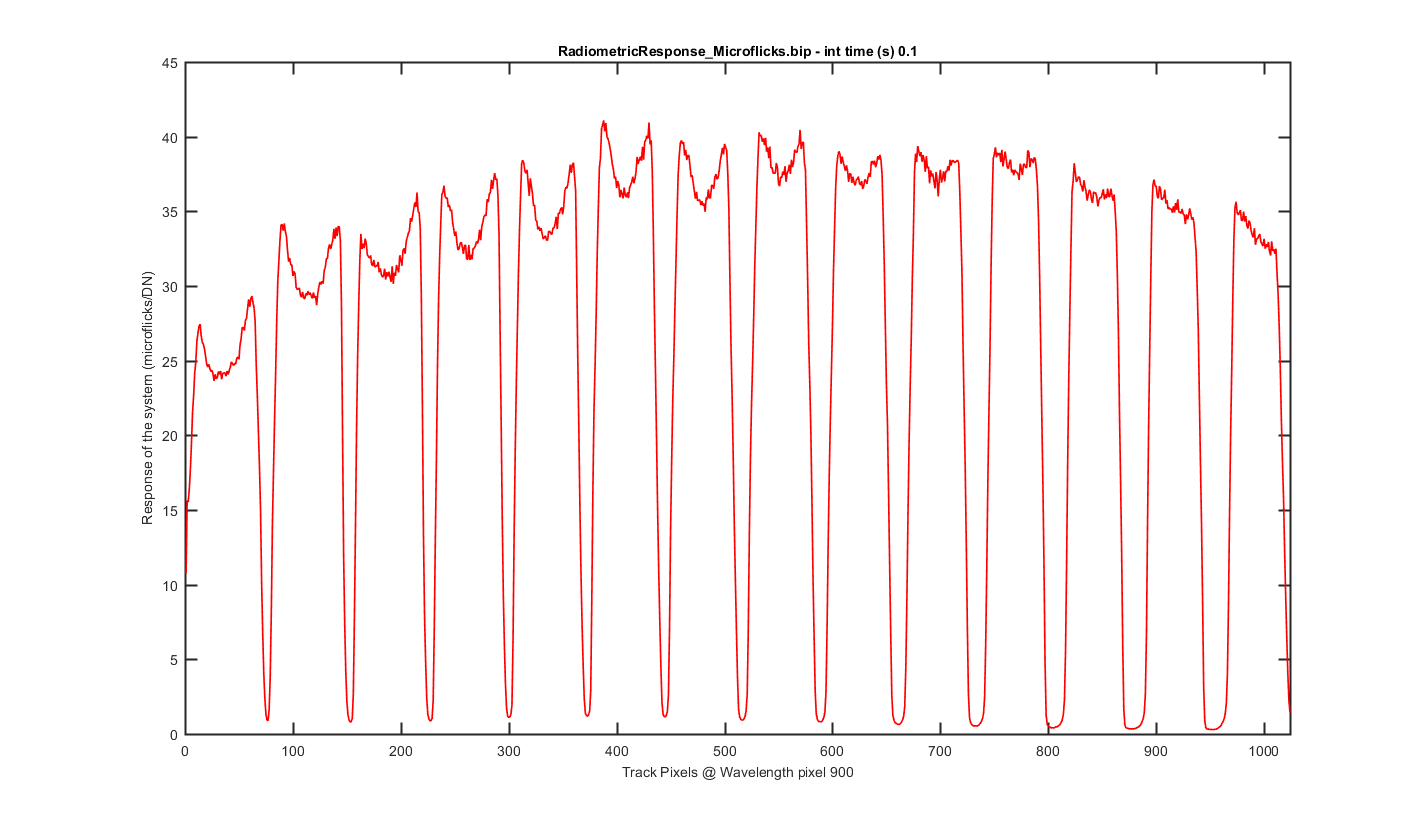
Figure 1
This is a cross section through the tracks at wavelength pixel 900. You can see the differences in the width of the spacing between the tracks here too.
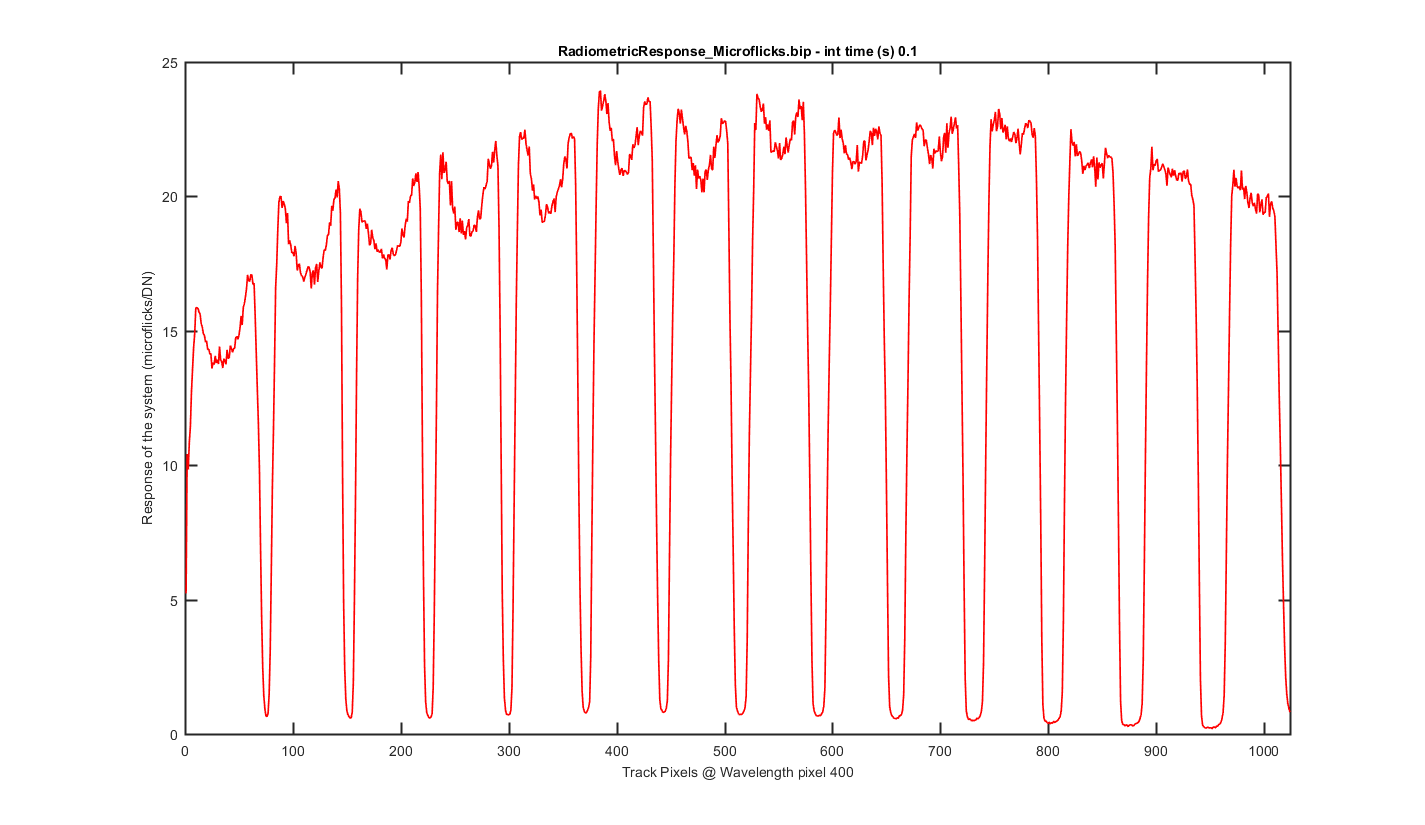
Figure 2
Same as figure 2 but for Wavelength pixel 400.
Figure 3
Again this is the image with slices thought the image at different wavelength pixels.
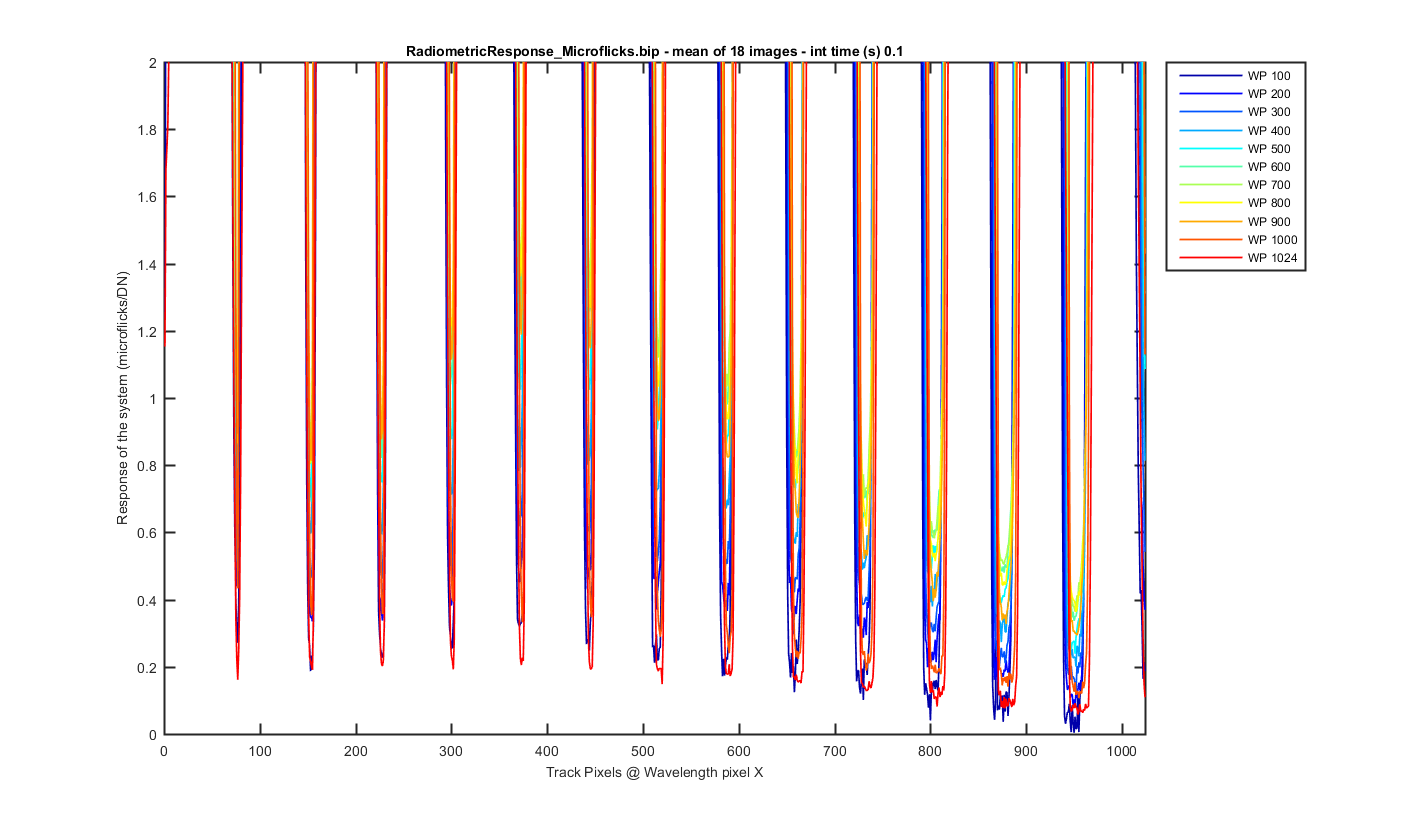
Figure 4
Same as figure 4 but zoomed to the bottom so you can see the darks between the tracks (darks are subtracted).
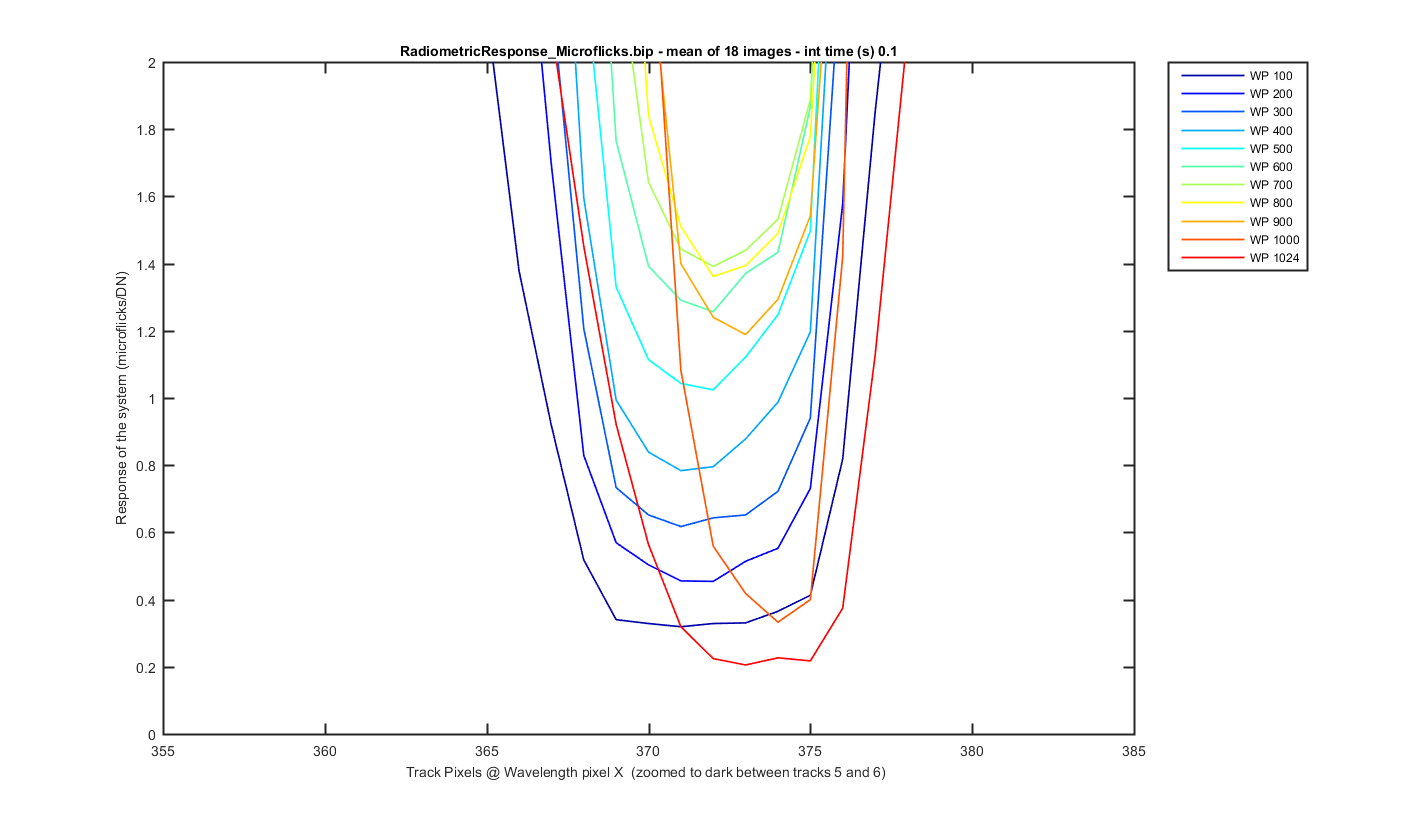
Figure 5
Same as figure 5 but zoomed into the dark area between tracks 5 and 6 so you can see the amount of light getting between the tracks. It varies by wavelength.
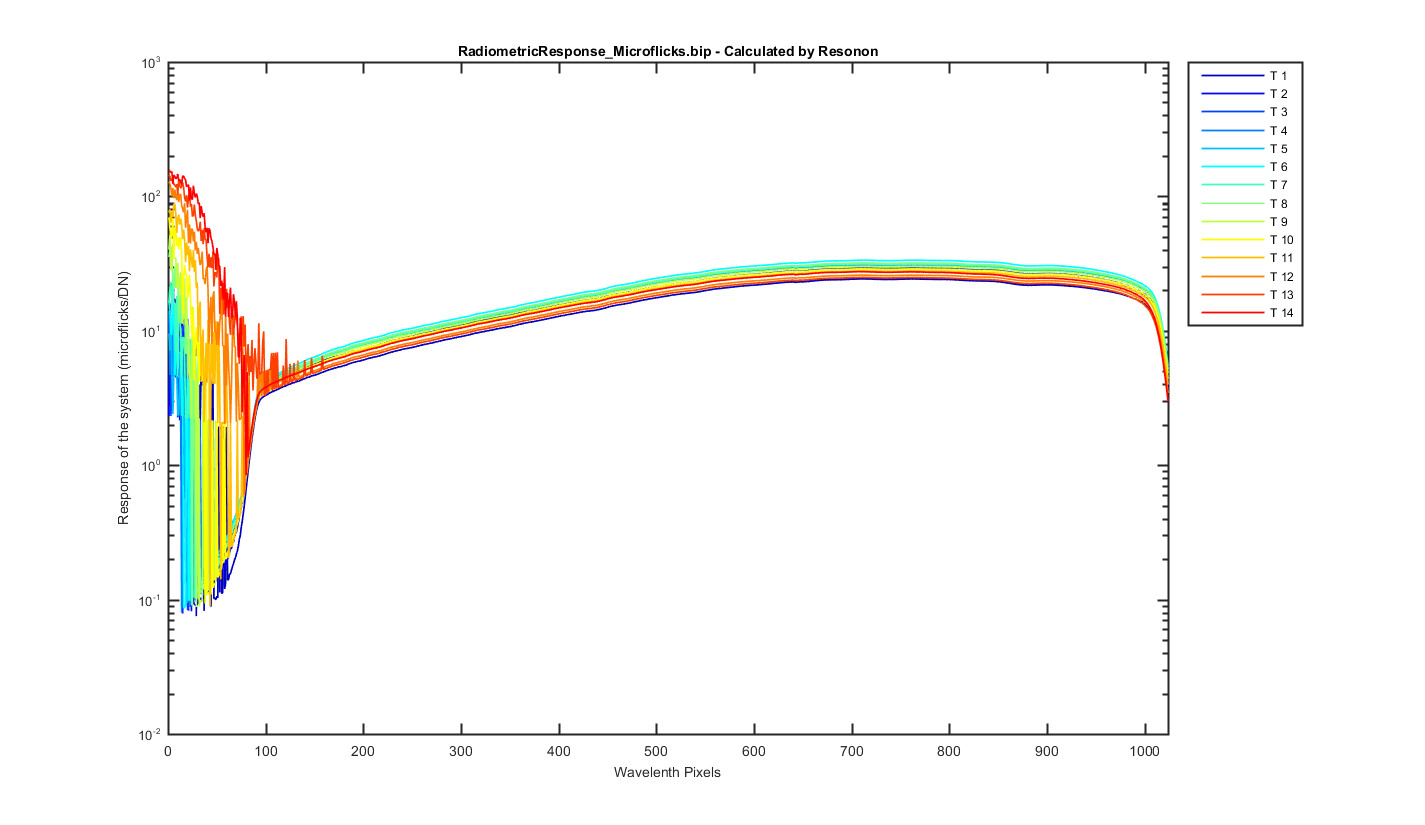
Figure 6
I created track data for the response image provided. This shows all pixels for all 14 tracks.
Figure 7
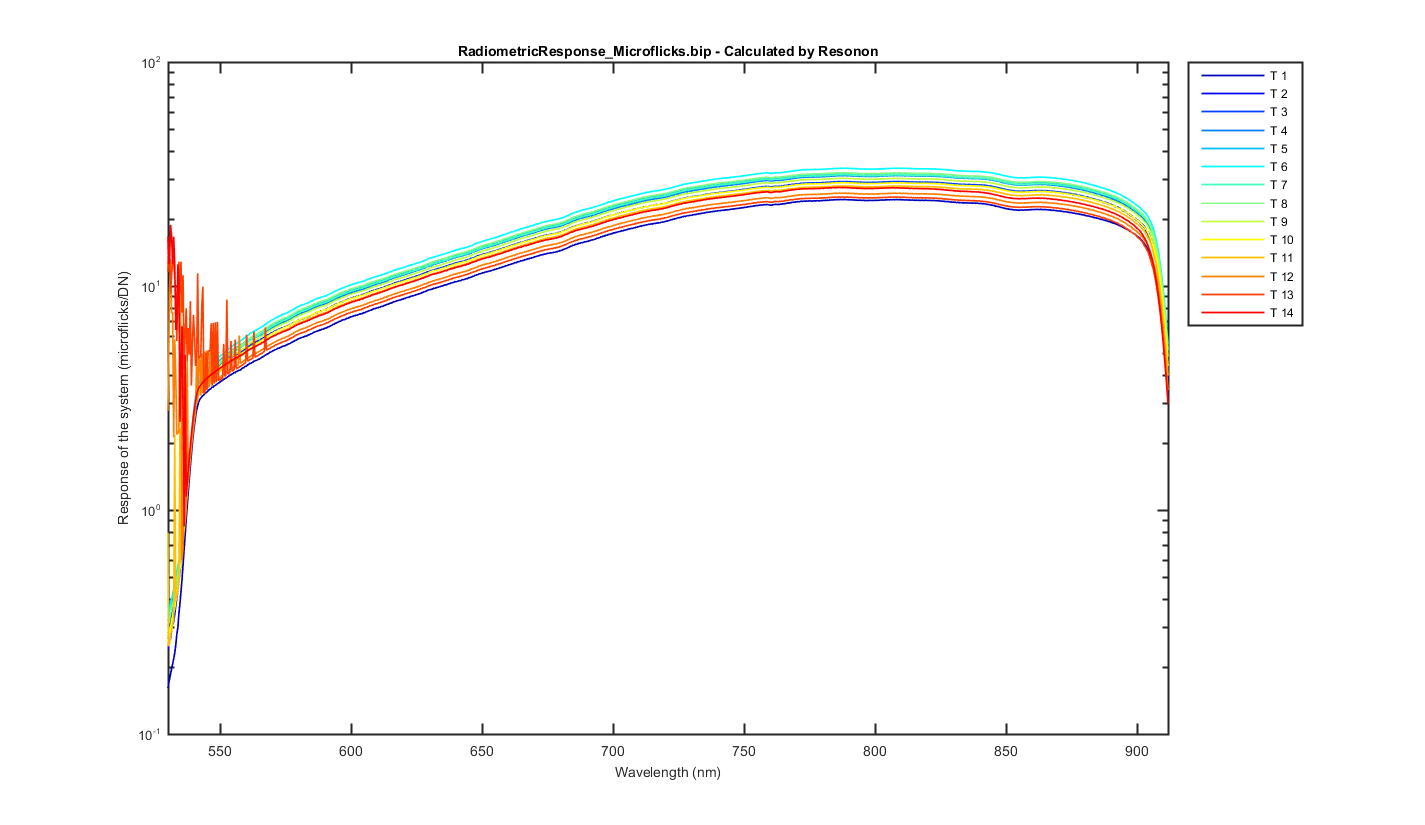
Same a previous figure but with the first 60 pixels cut off.
Figure 8
Same a previous figure put plotted verse wavelength (MikeFs line regression).
Figure 9
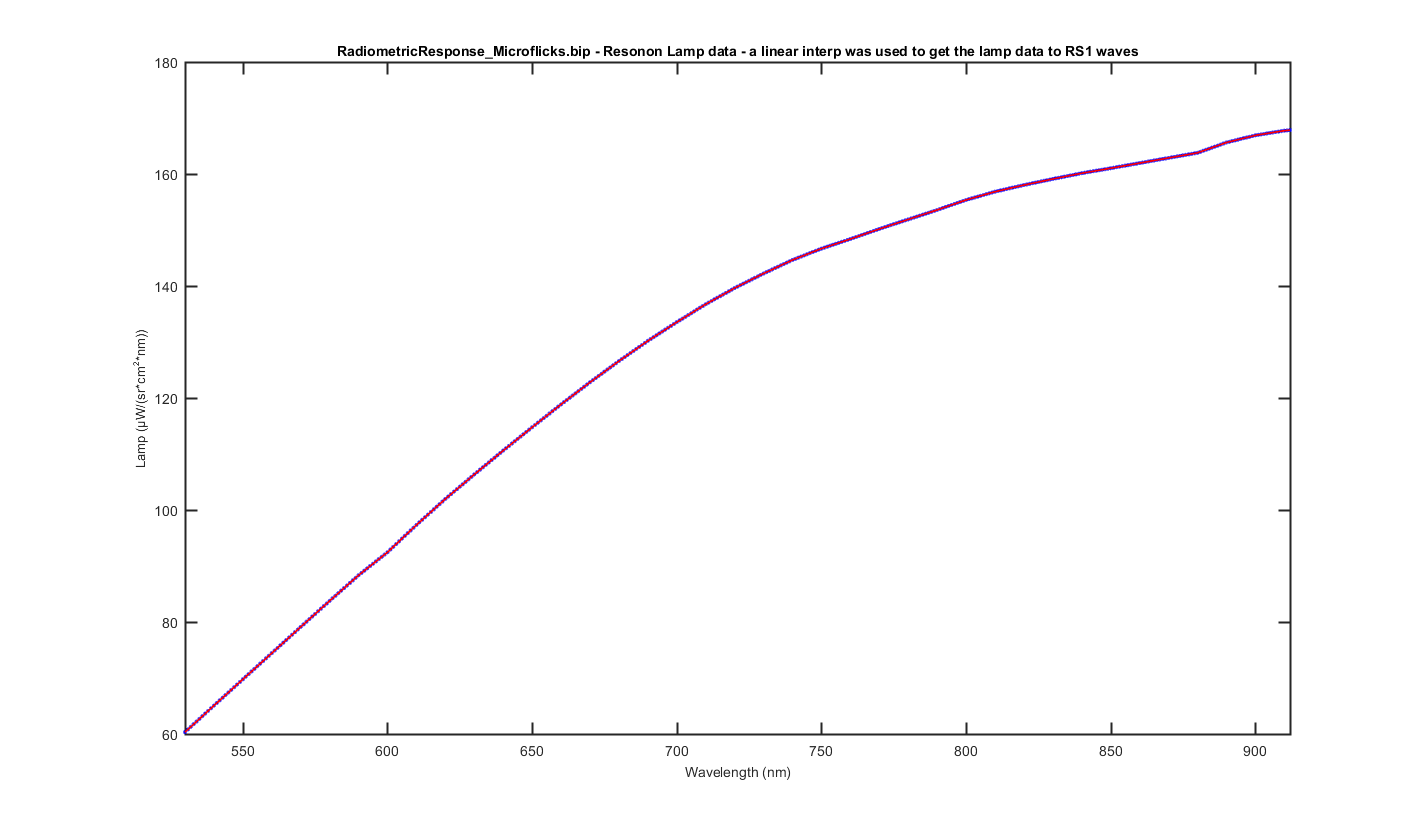
Plot of lamp data Casey sent me. I used a linear interpolation to get the lmap data into the specs wavelength calibration
Figure 10
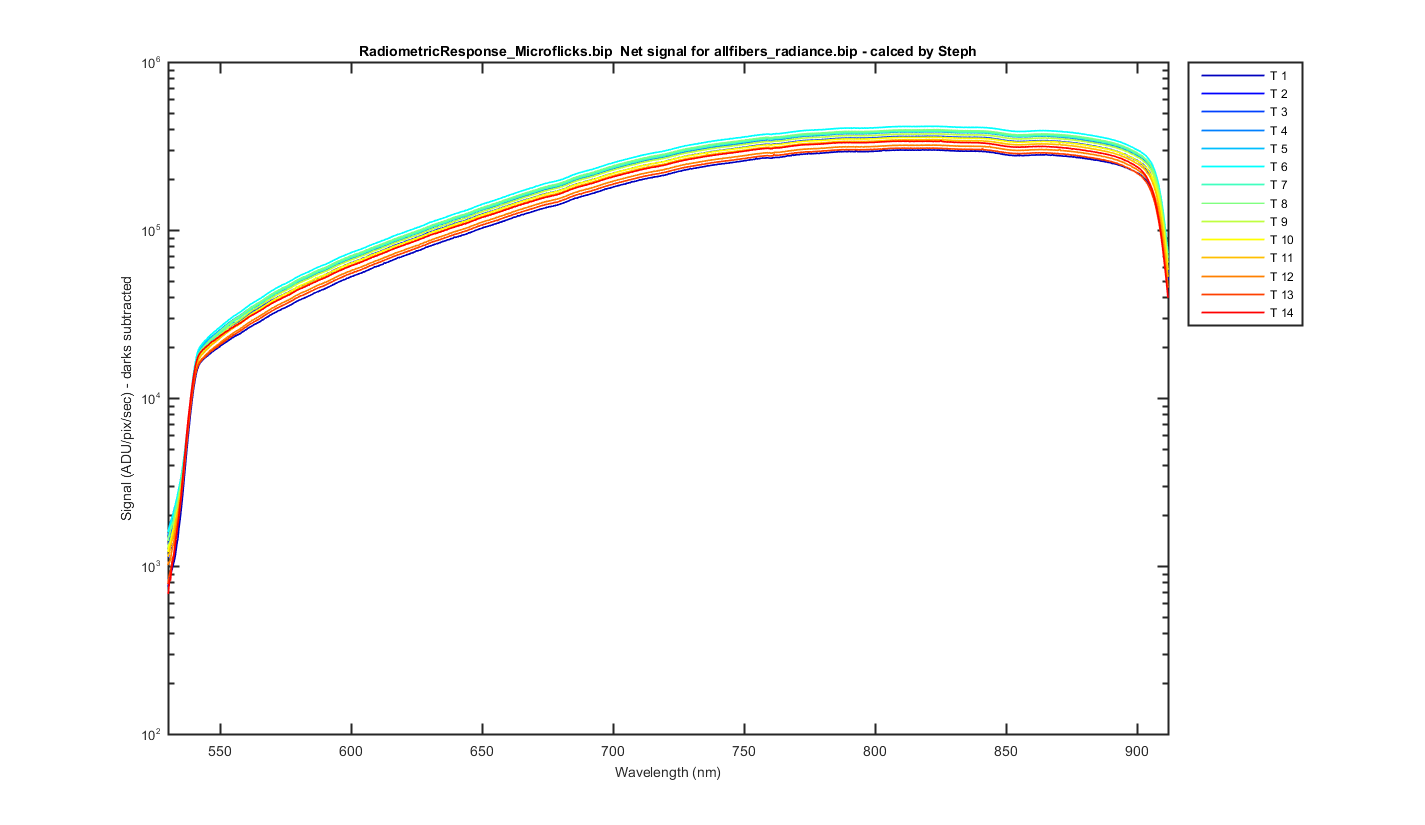
The allfibers_radiance.bip track data (dark subtrated) and divided by integration time and pixels meaned to get ADU/pix/sec.
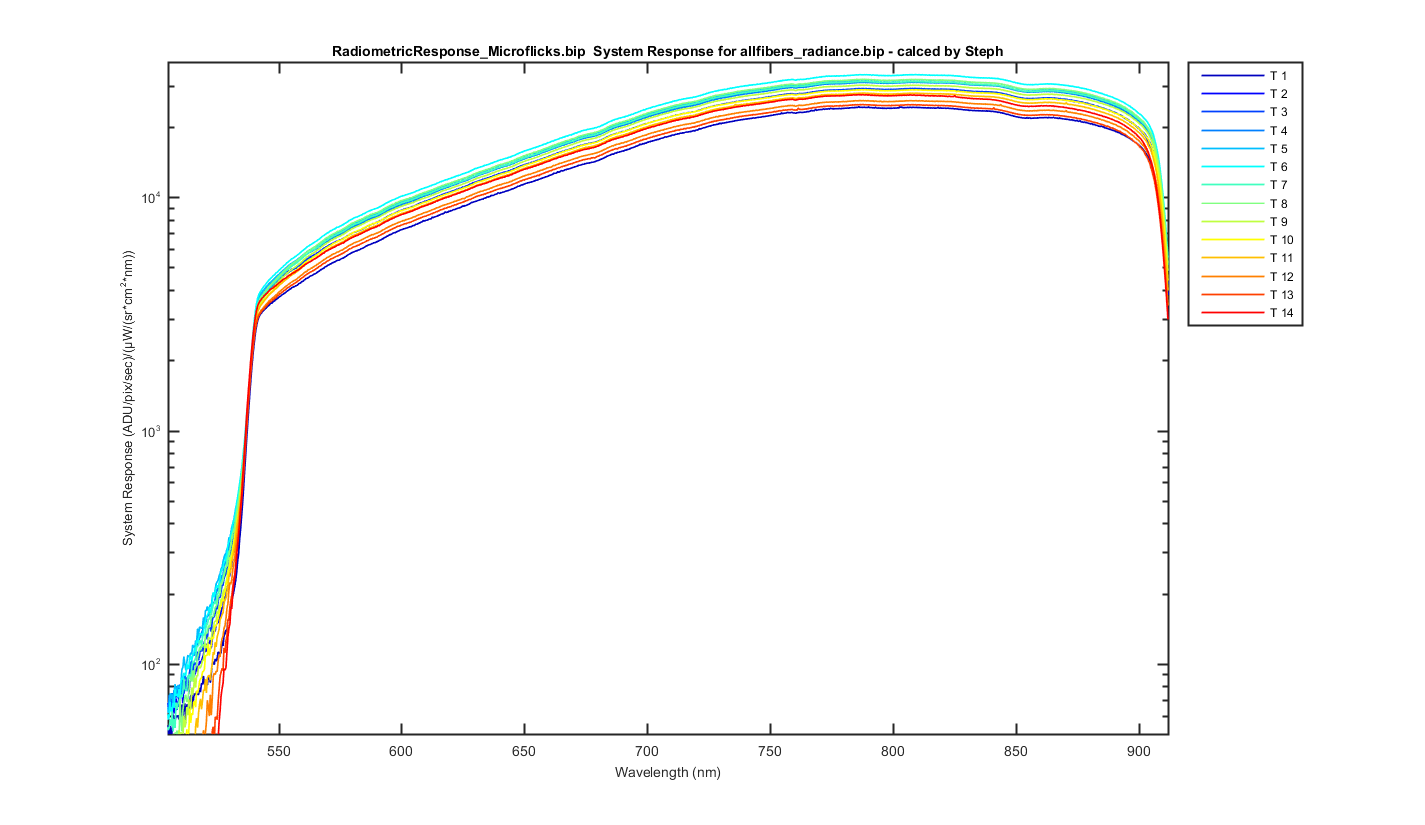
Figure 11
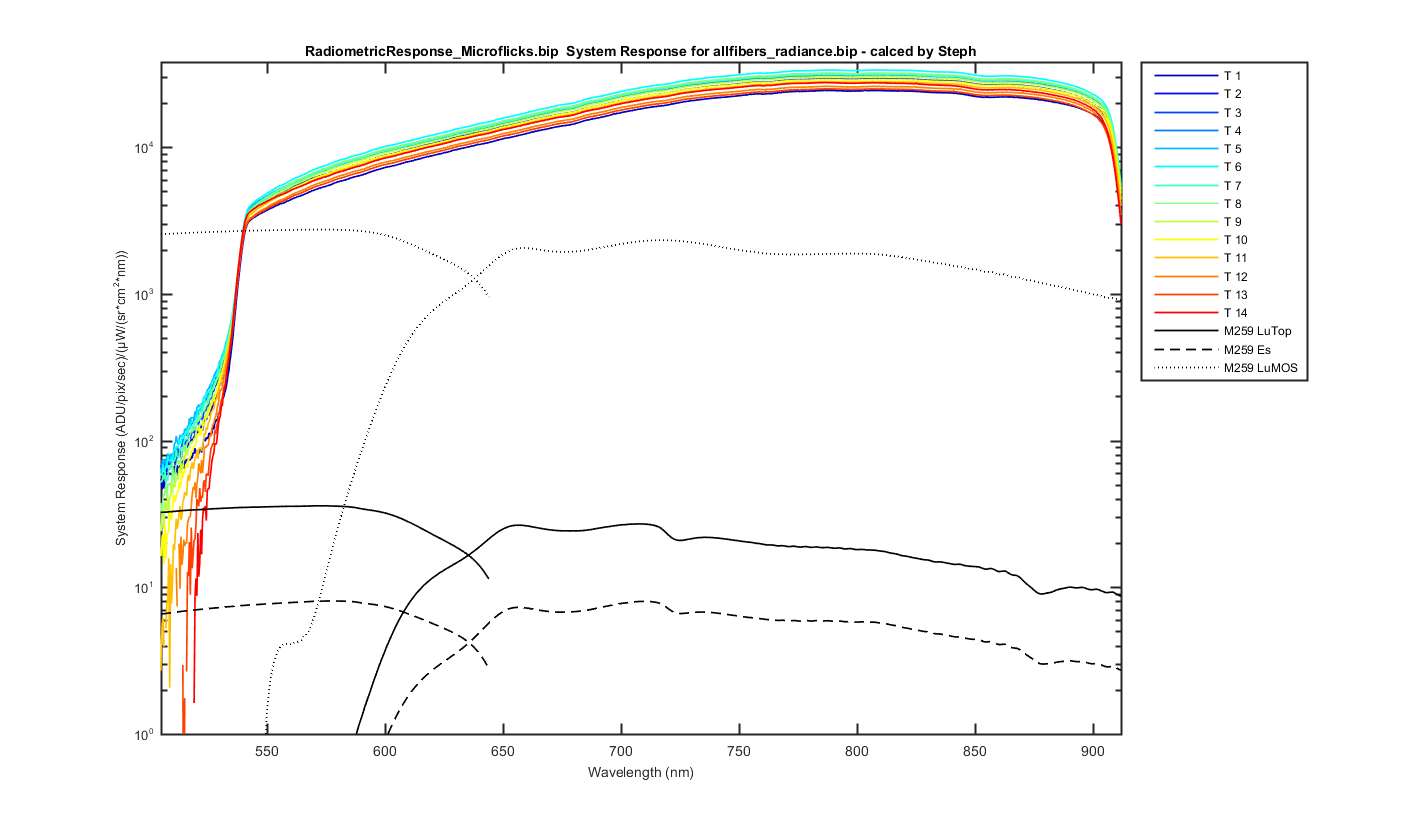
System response in (ADU/pix/sec)/(µW/(sr*cm^2*nm)).
Figure 12
System response in (ADU/pix/sec)/(µW/(sr*cm^2*nm)) with the MOBY LuTop, Es and LuMOS system response plotted for comparison. When I plotted the Resonon and my sysem response they where similar (main difference was the difference in scales and dividing my int time)
Figure 13