REVISION DATE: 08-Apr-2016 10:38:47
Email from Mike Kehoe on 4 Dec 2015 11:09 am:

Greetings All,

Casey has finished his testing of RS1.  Please find the pre-delivery report attached.  Test data is available at the usual site:

-Mike
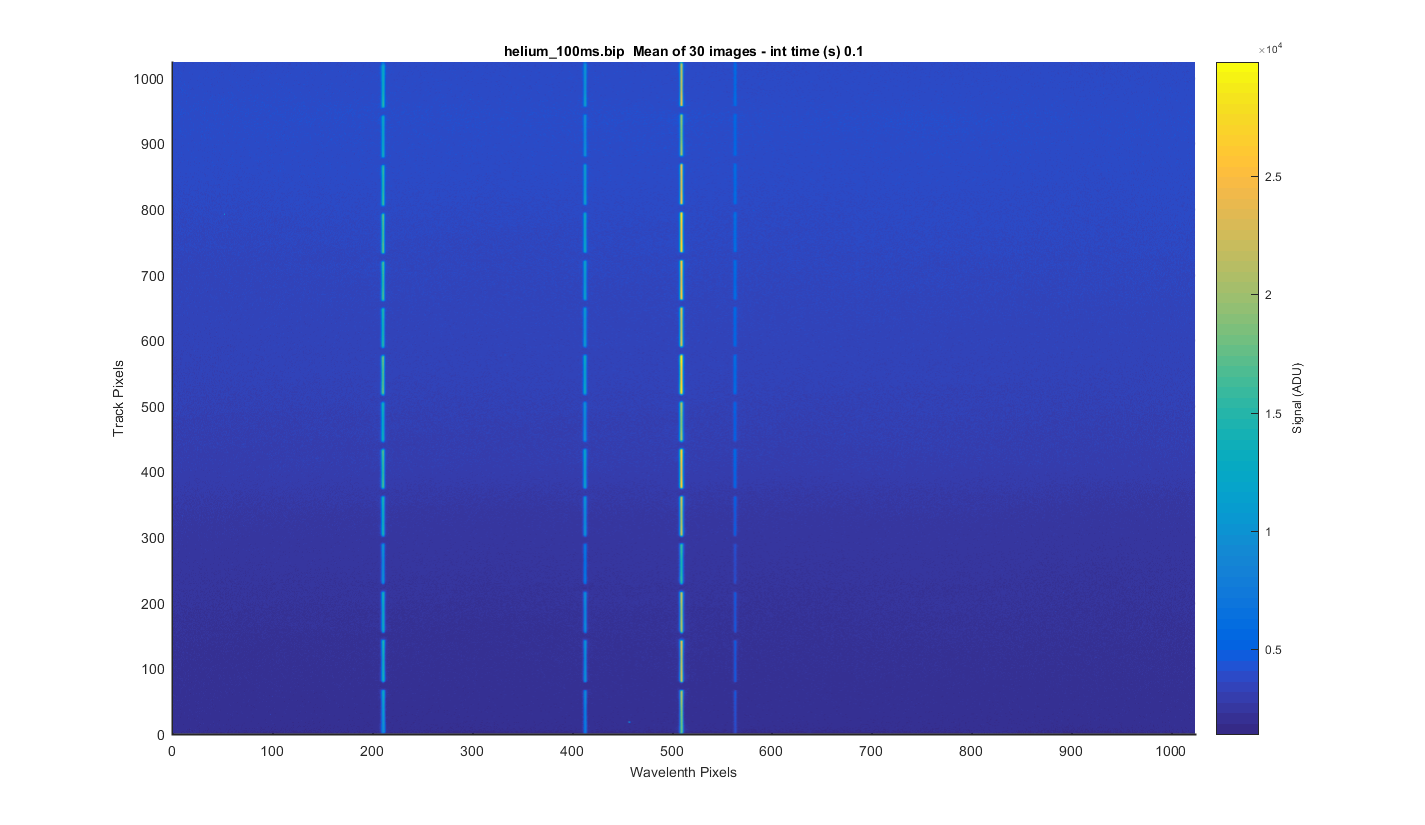
Below are my graphs of the helium.bip file. The file contains 30 dark images at 0.1 sec Note some graphs are dark corrected and some are not so check the axis labels to know what you are looking at.
I took the 30 images and meaned them to get the surface plot below.
Figure 1
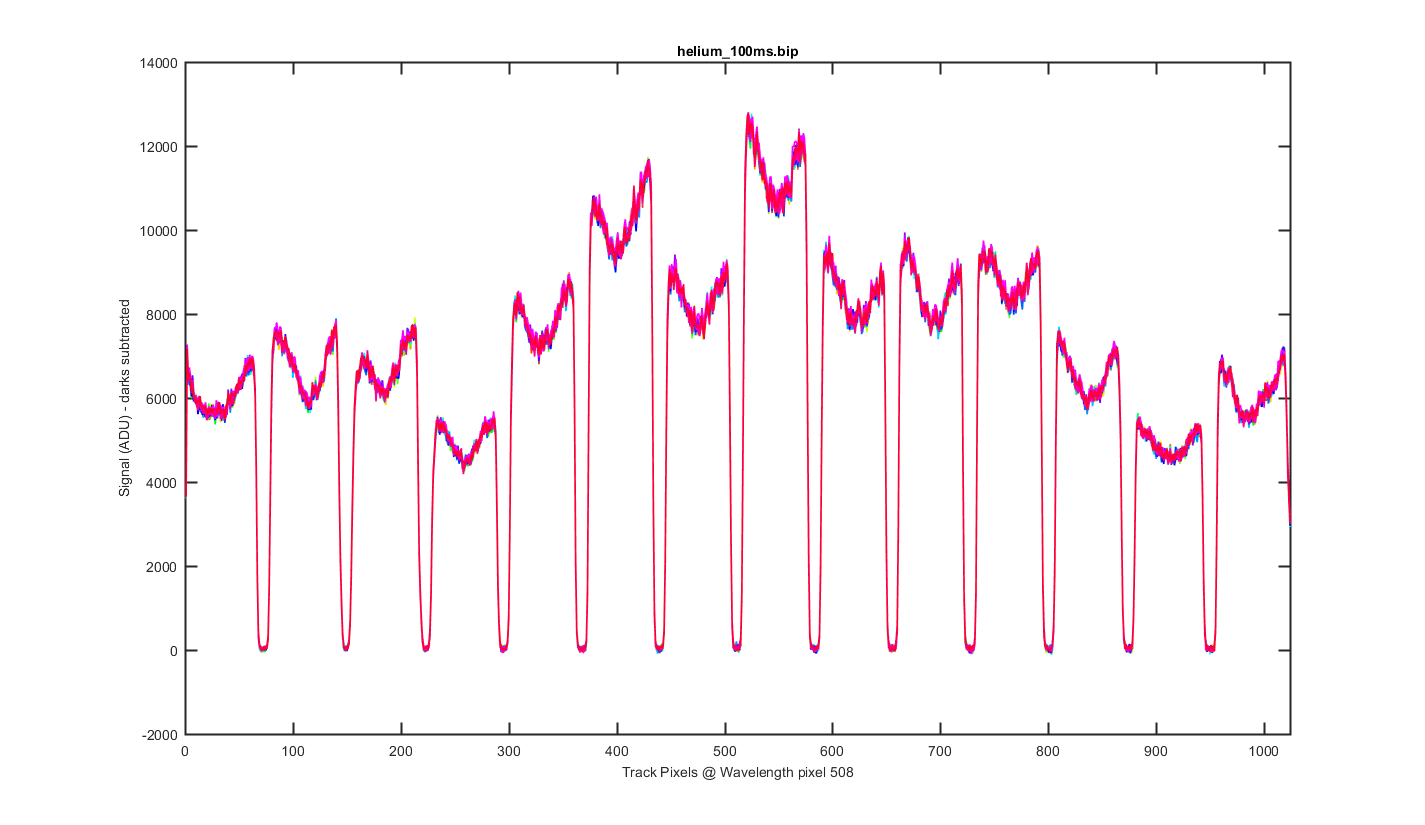
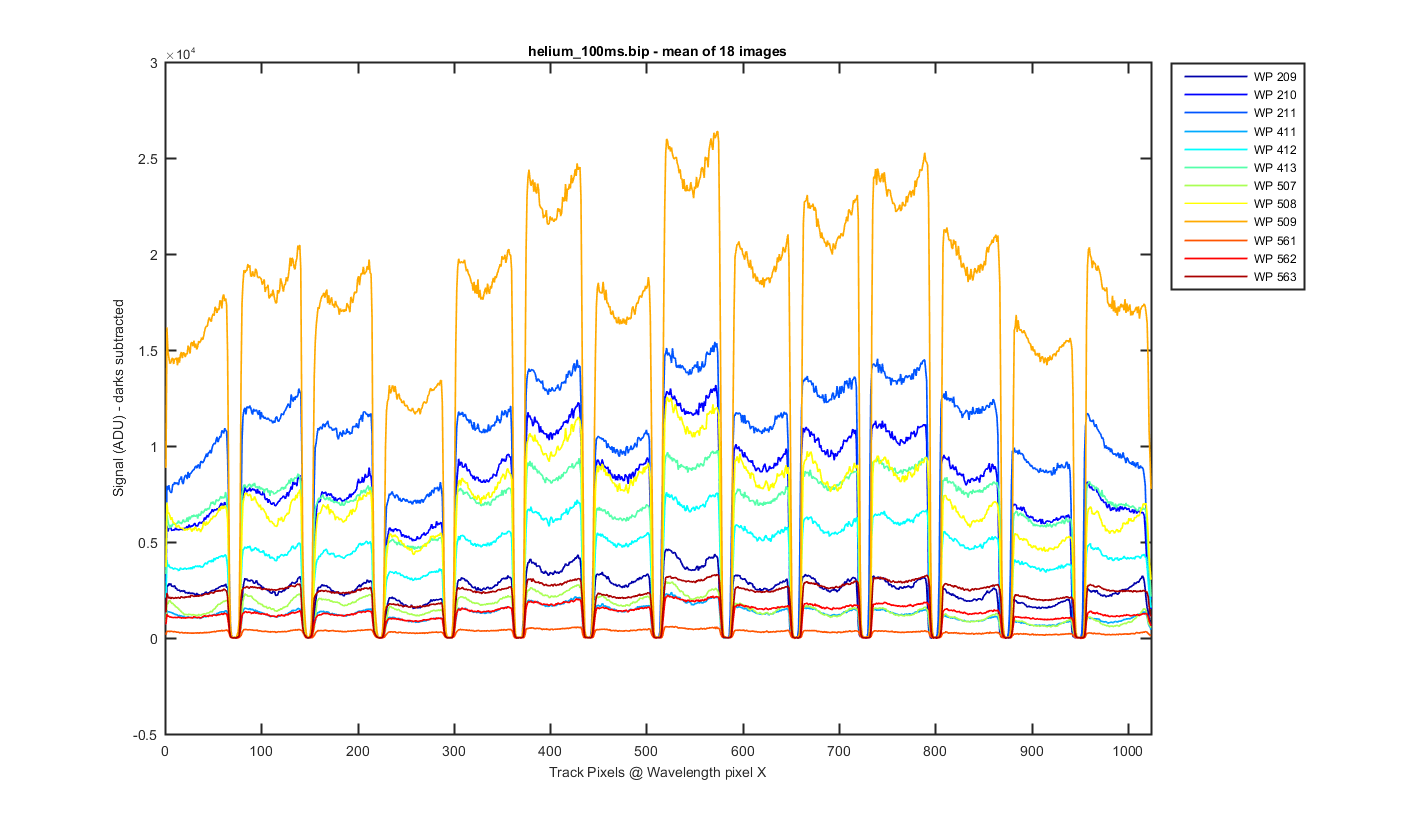
This is a cross section through the tracks at wavelength pixel 508, with one line for each of the 30 images. The tracks and their shapes look really stable.
Figure 2
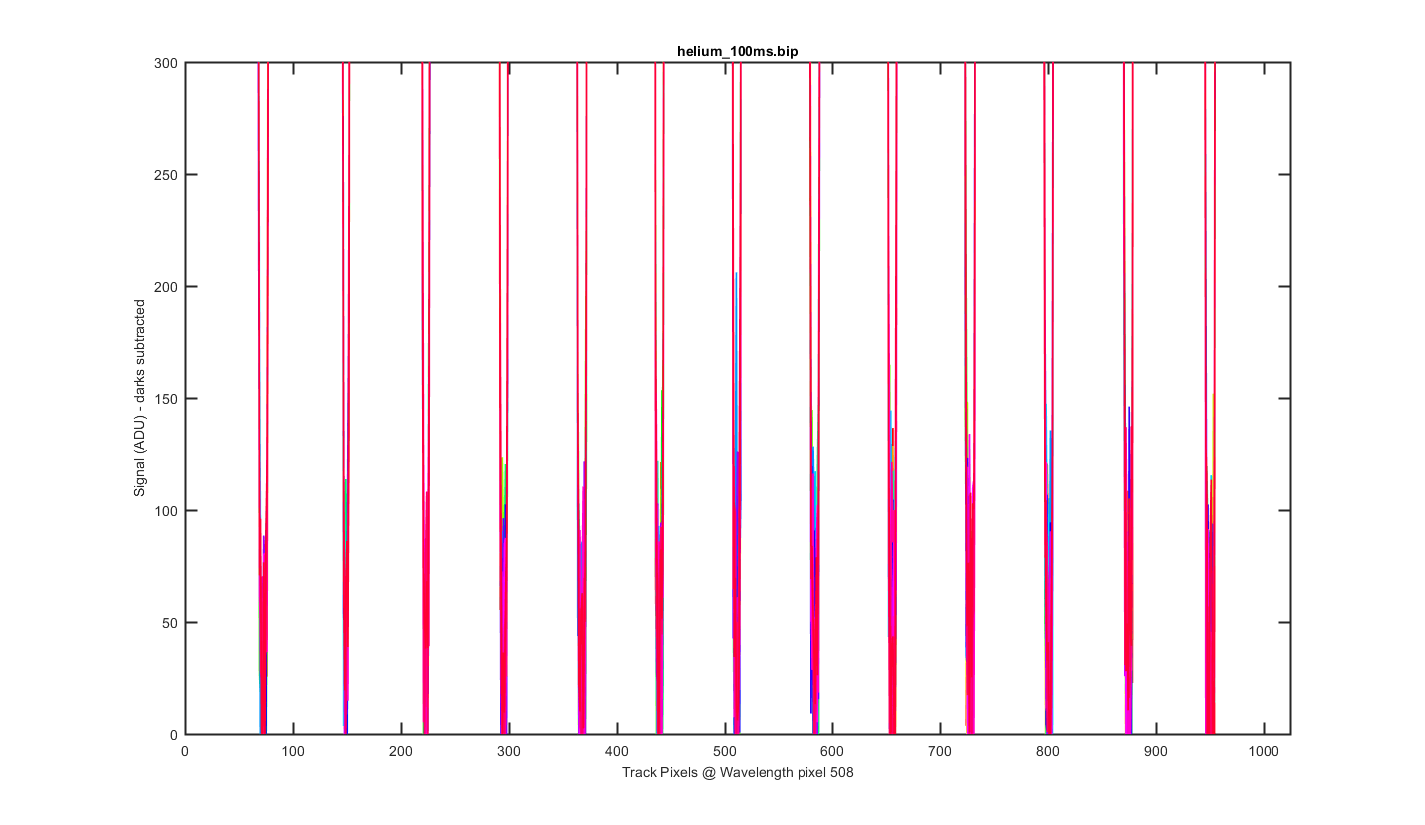
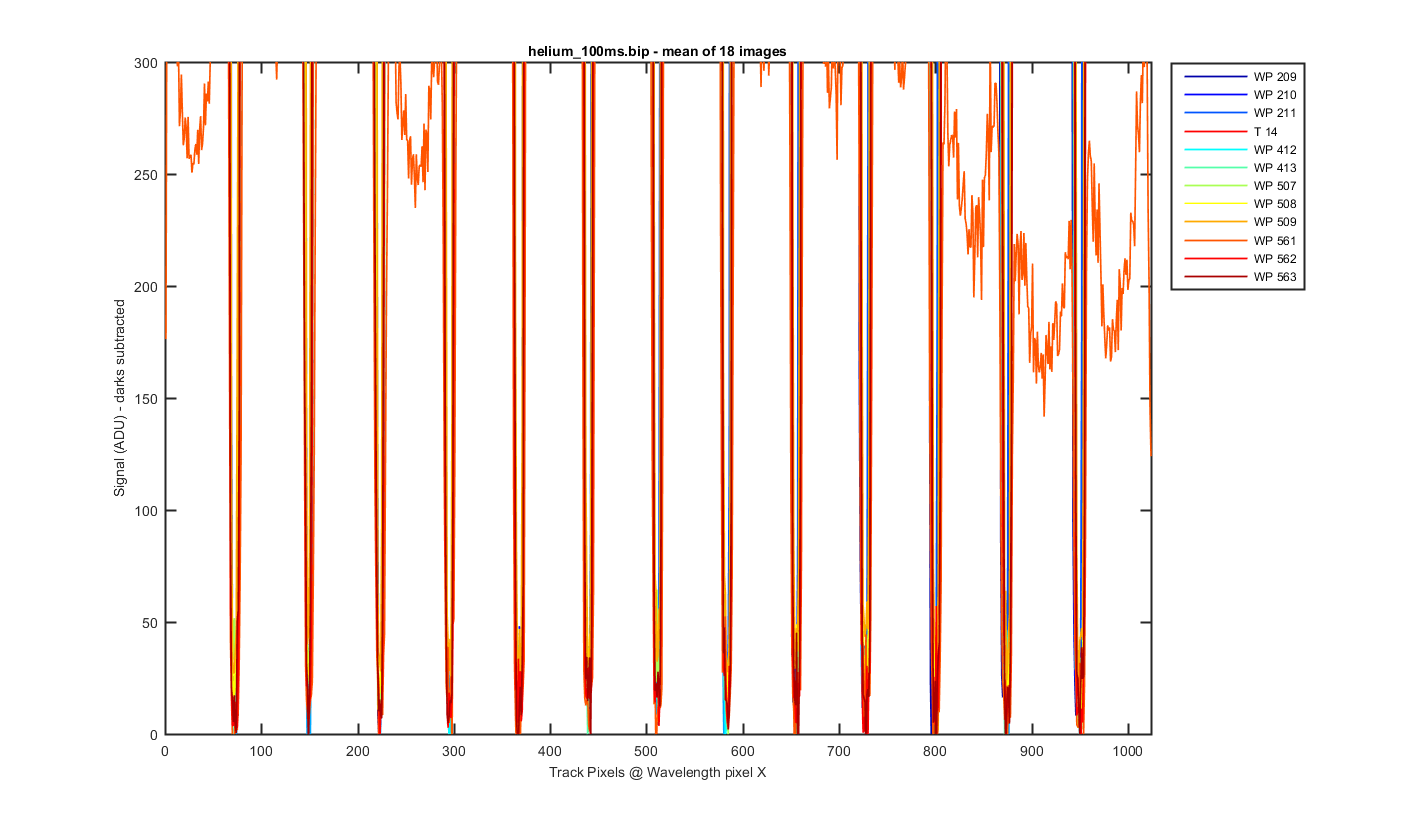
Same as the previous graph but zoomed into the bottom to see the level of the darks between the tracks.
Figure 3
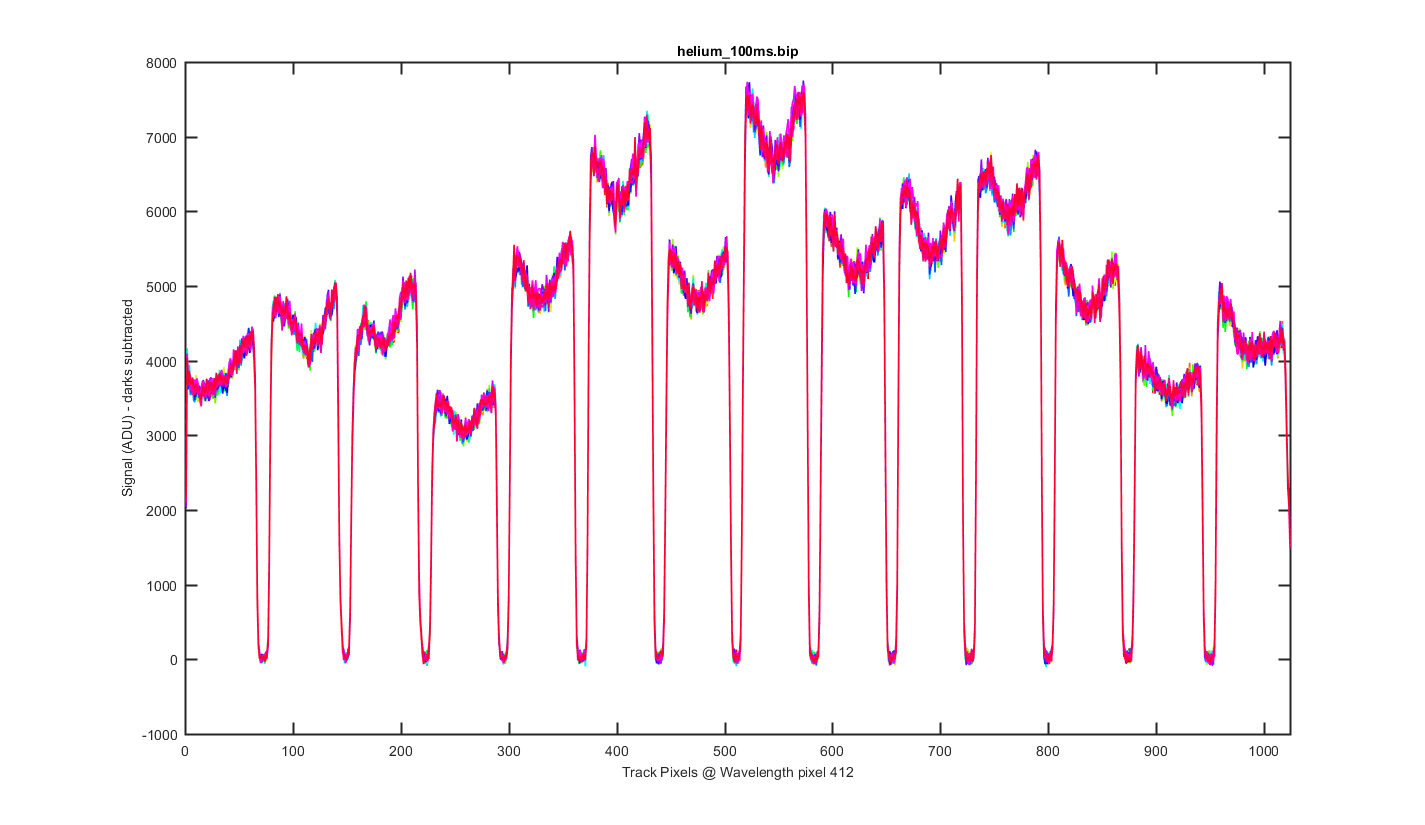
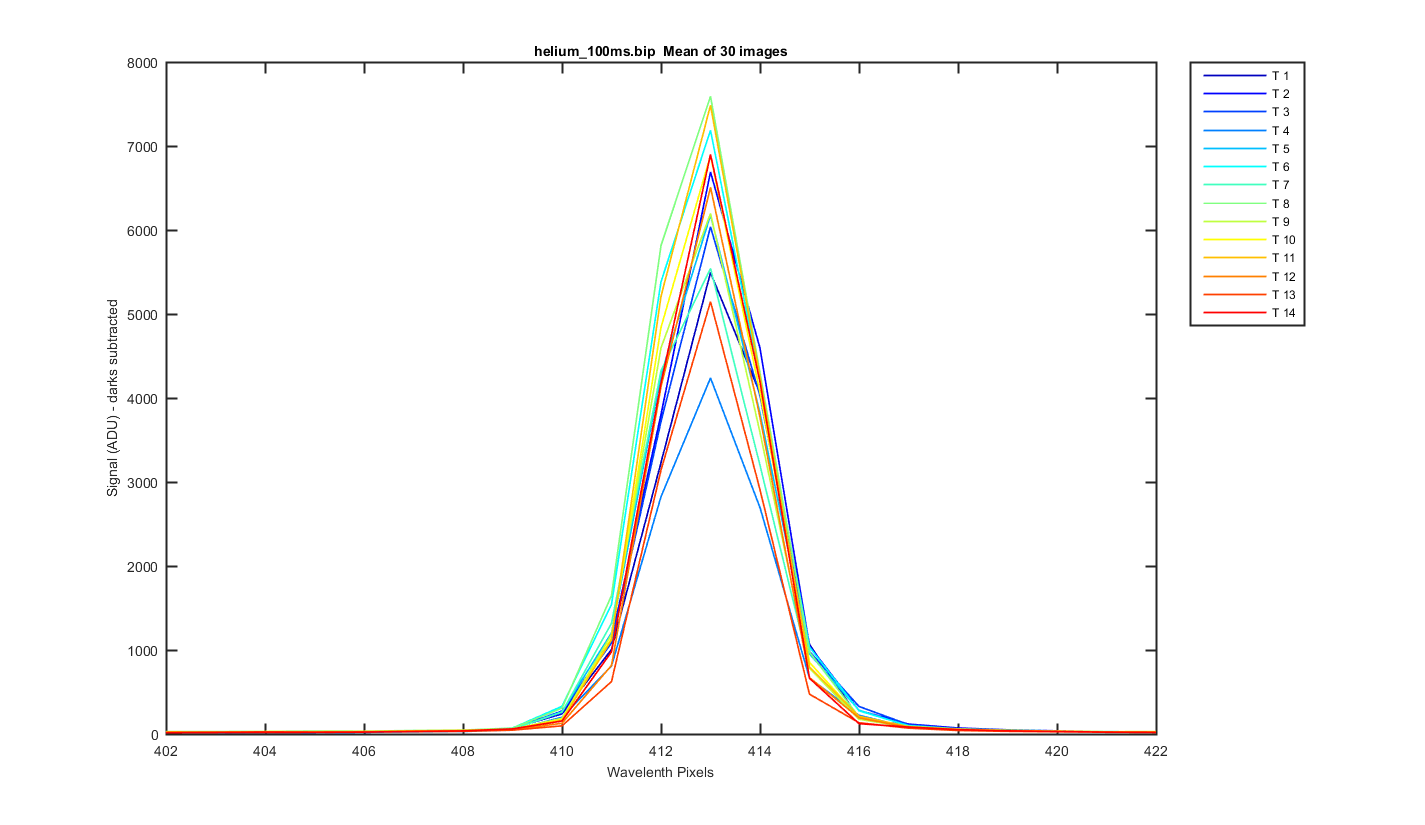
Same as figure 2 but for Wavelength pixel 412.
Figure 4
Again this is the mean image with slices thought the image at different wavelength pixels. The pixels choosen are where the helium peaks are and +- pixel pixel around them.
Figure 5
Same as figure 5 but zoomed to the bottom so you can see the darks between the tracks.
Figure 6
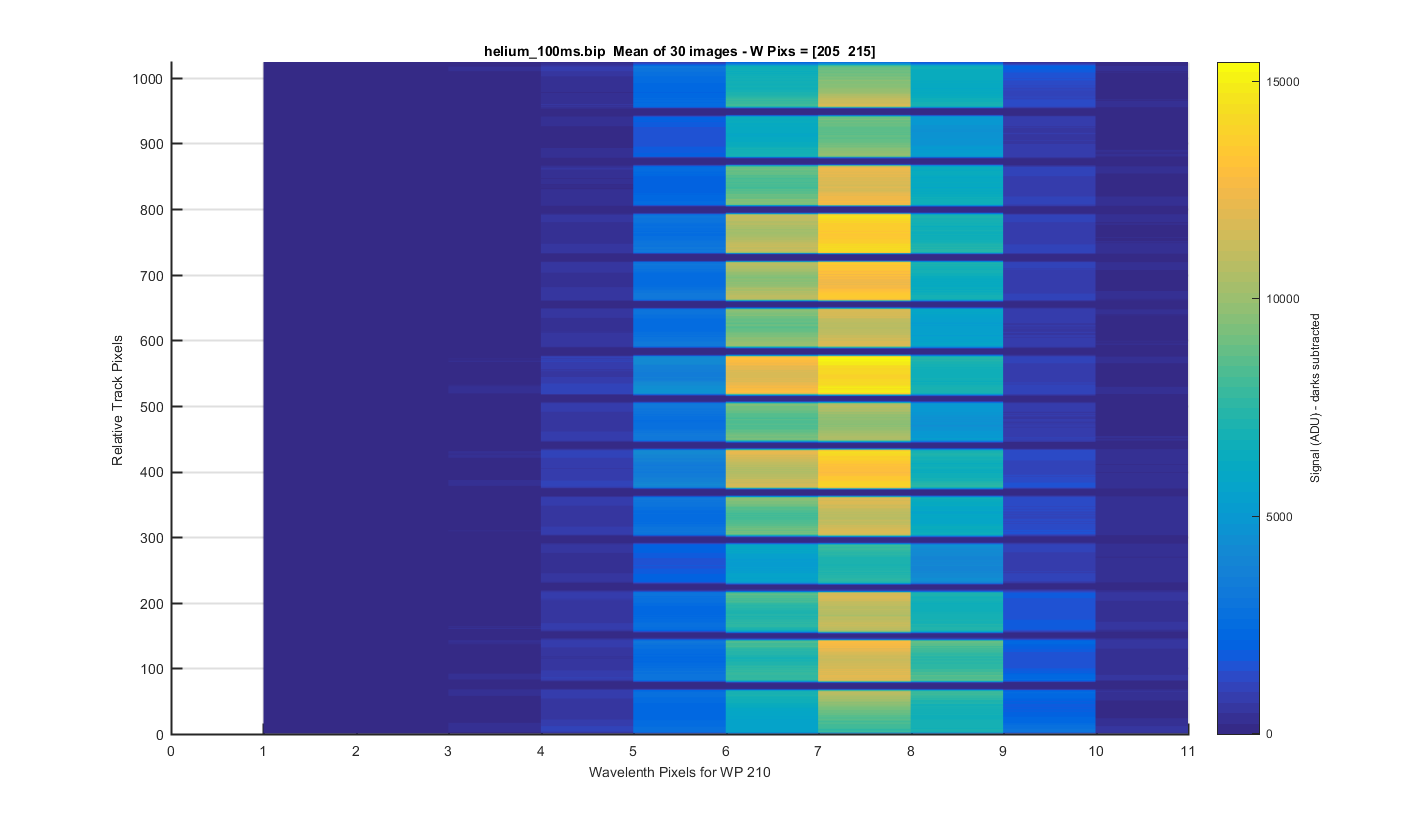
Helimu Peak 1 (at pix 210): The same surface plot but showing how individual helium peaks line up from track to track. Looks pretty good!
Figure 7
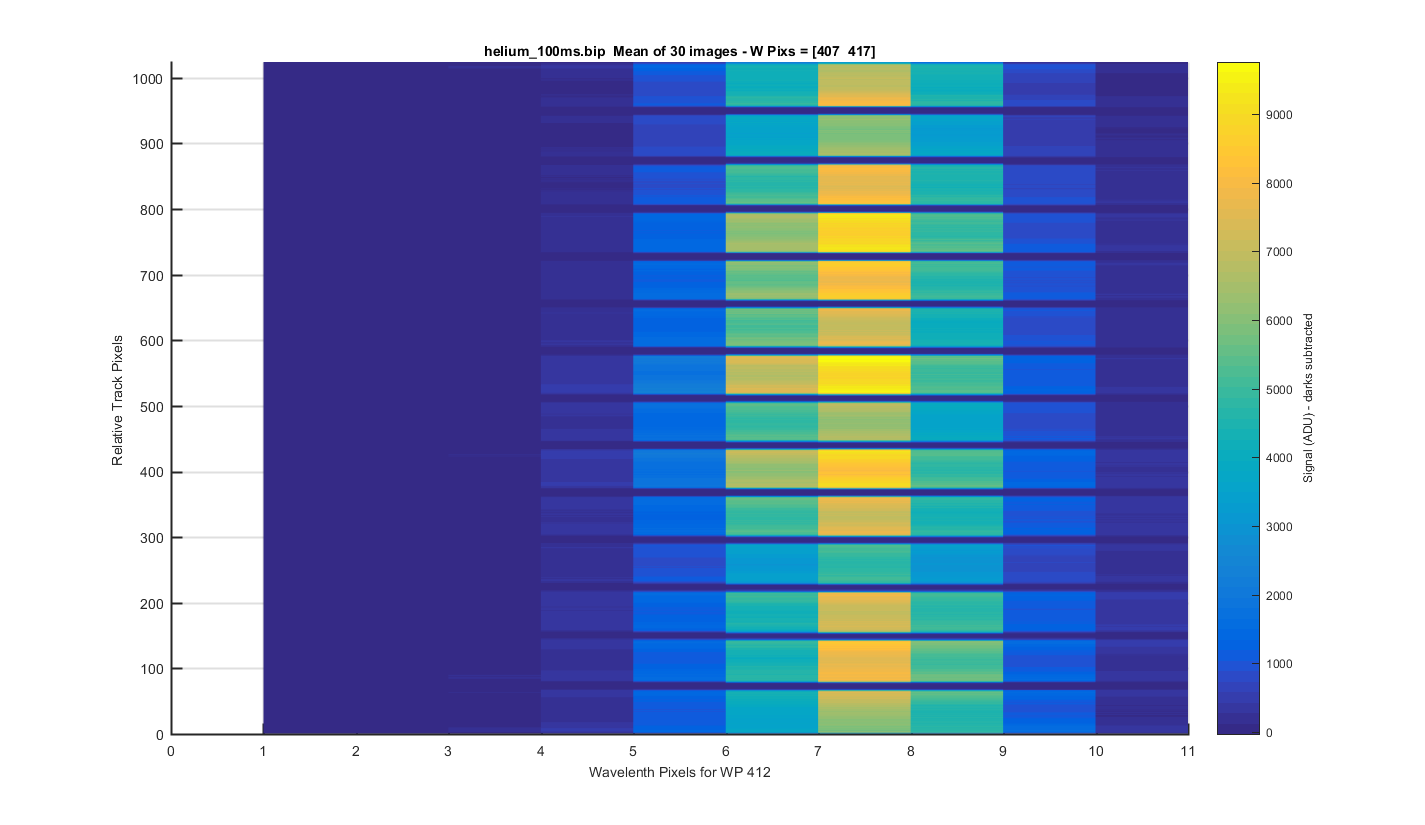
Helimu Peak 2 (at pix 412): The same surface plot but showing how individual helium peaks line up from track to track. Looks pretty good!
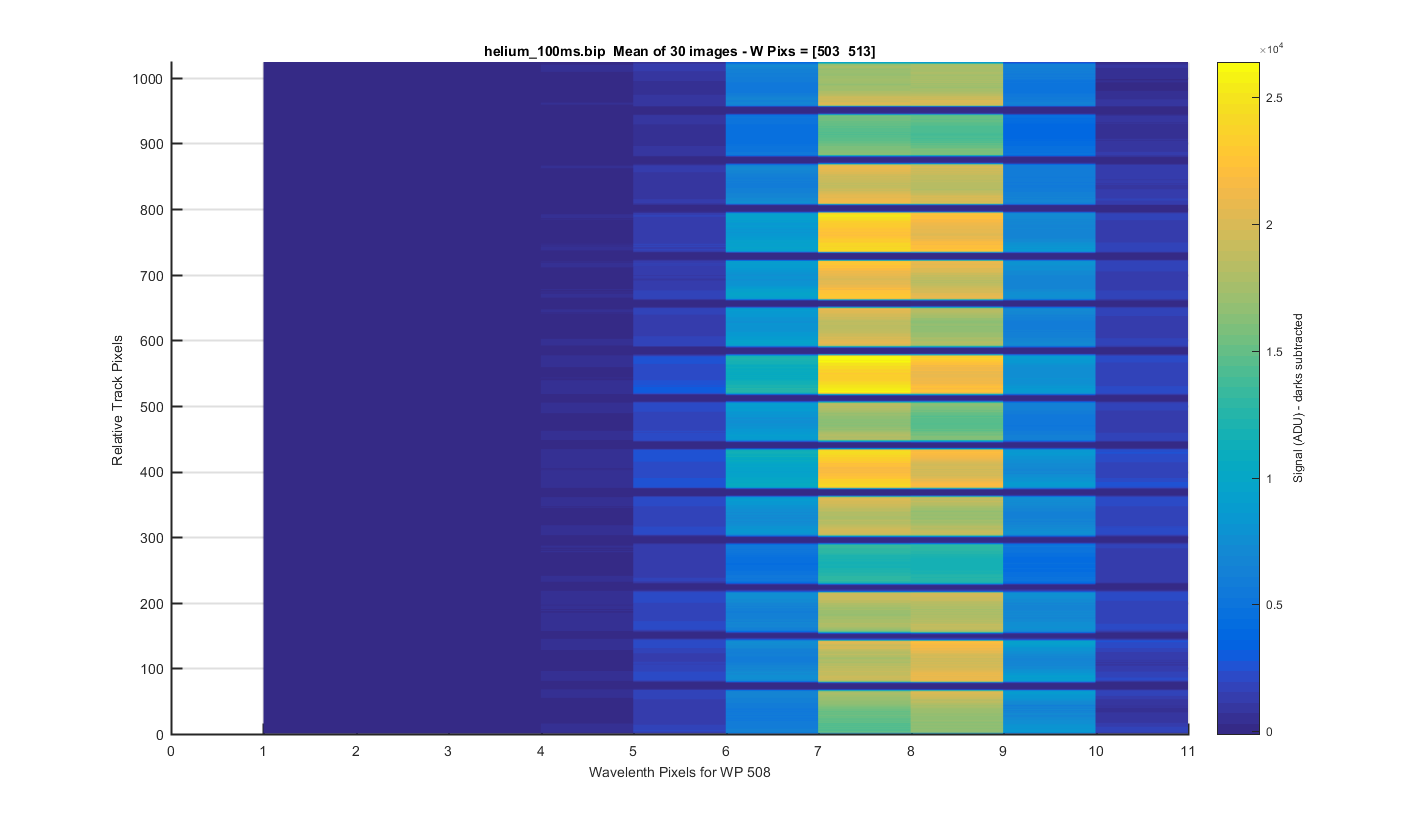
Figure 8
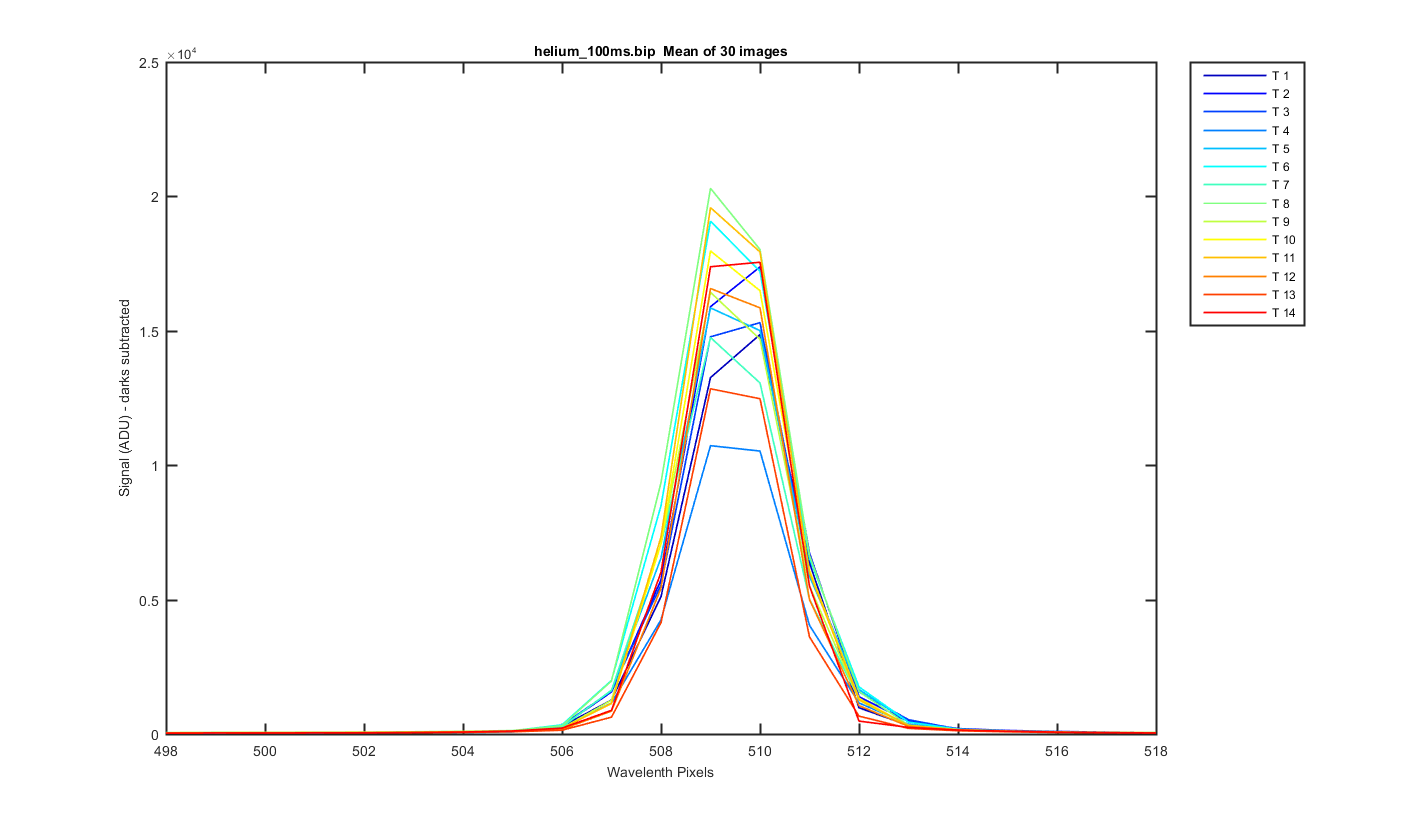
Helimu Peak 3 (at pix 508): The same surface plot but showing how individual helium peaks line up from track to track. Looks pretty good!
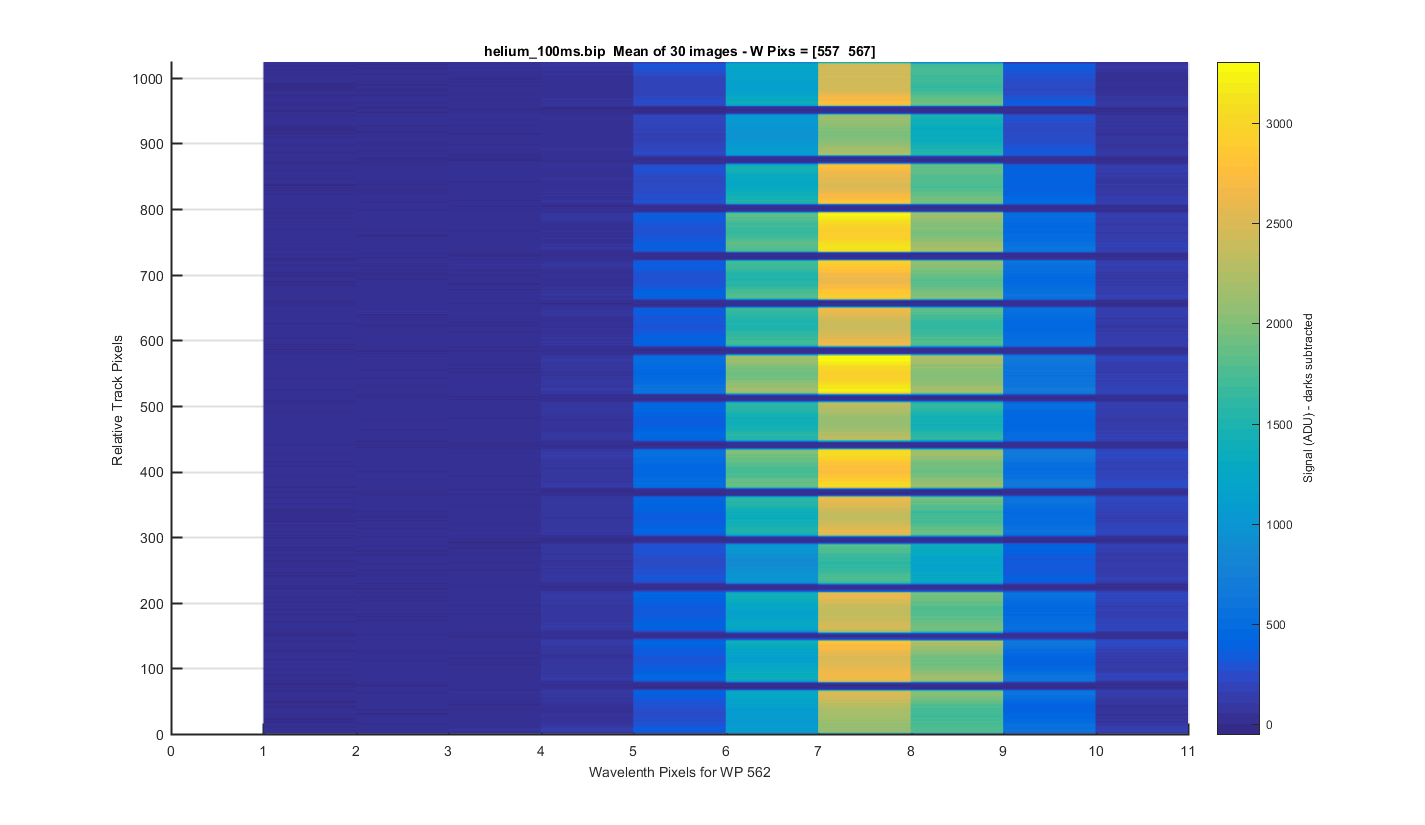
Figure 9
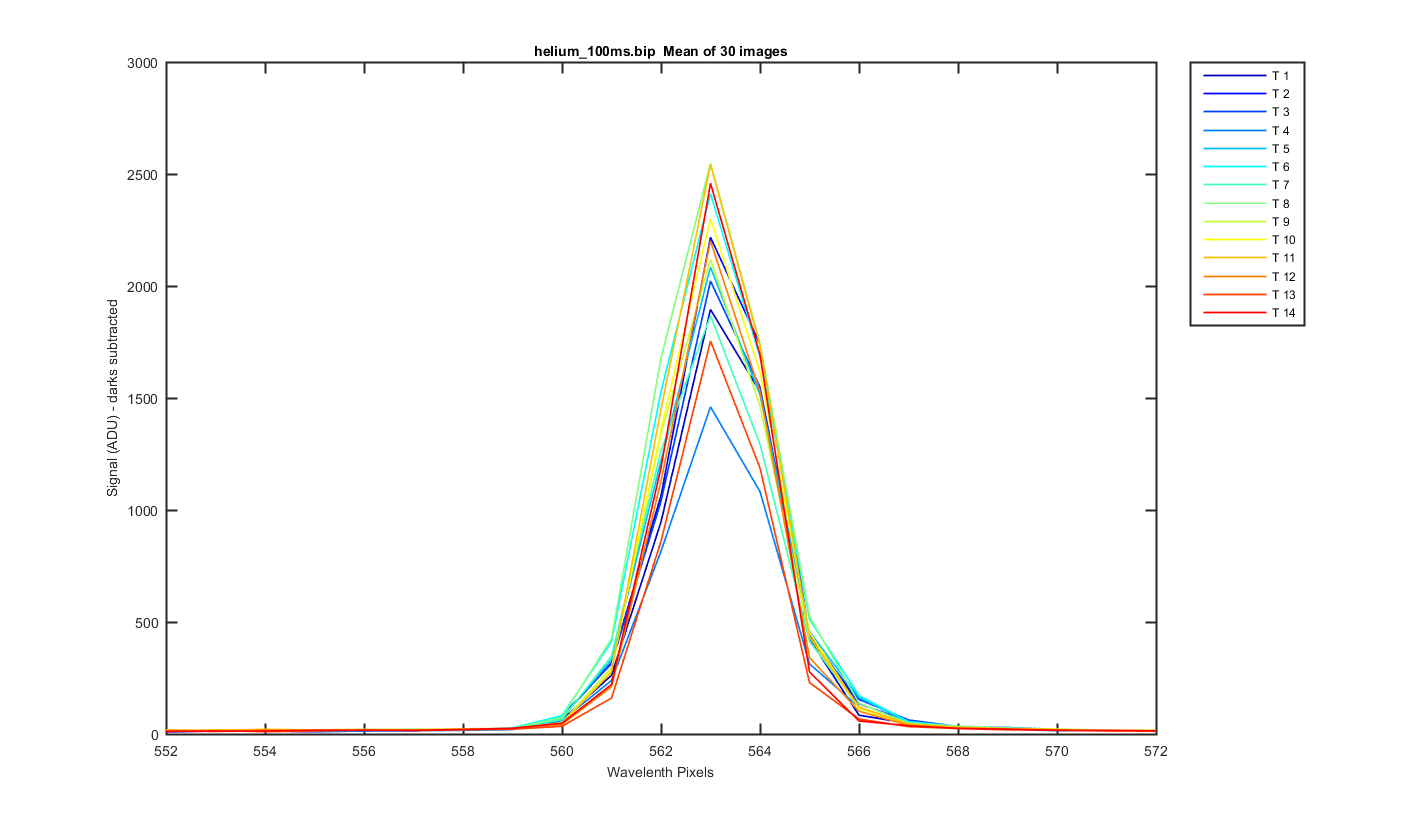
Helimu Peak 4 (at pix 562): The same surface plot but showing how individual helium peaks line up from track to track. Looks pretty good!
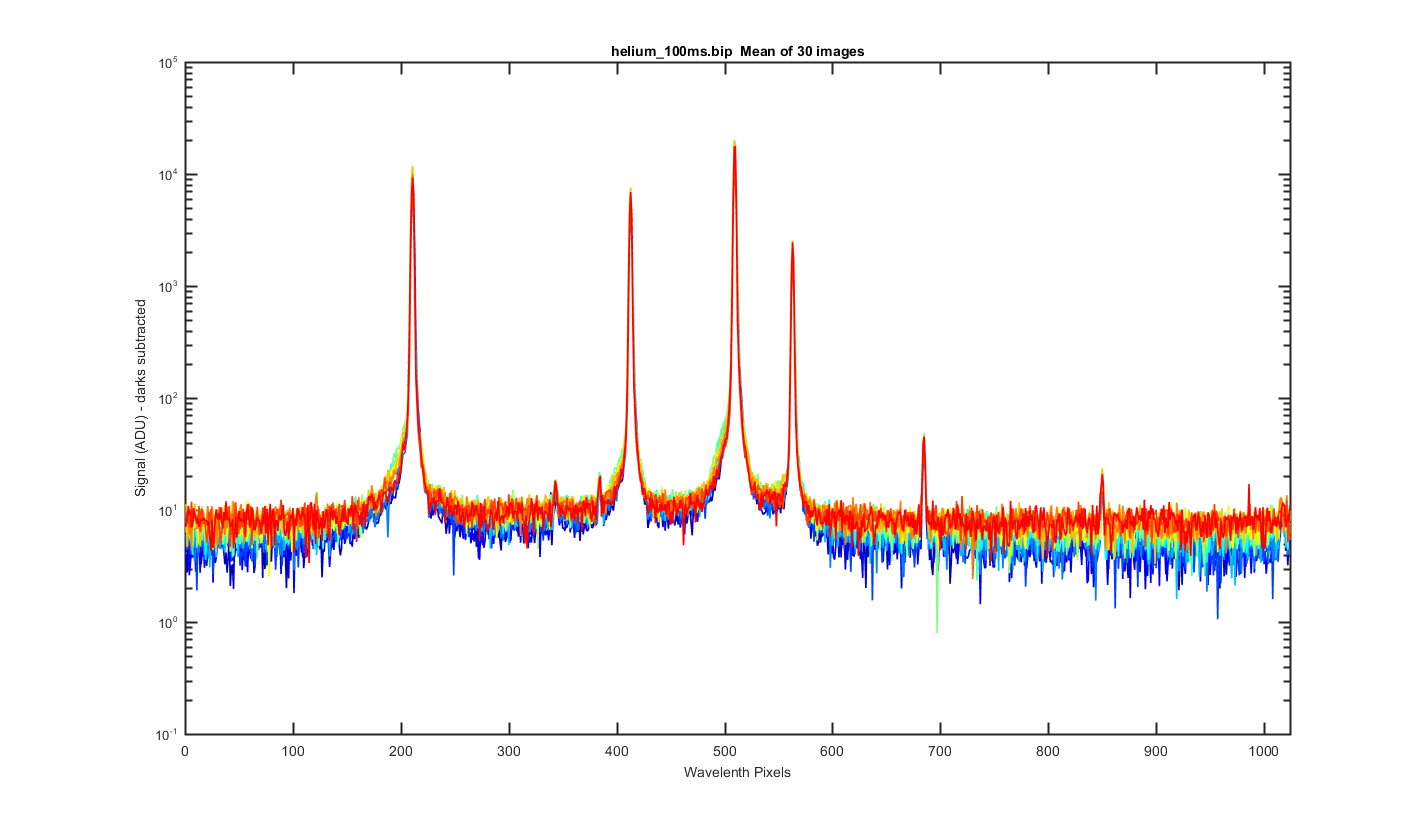
Figure 10
Mean image binned by track, the x-axis is wavelength pixels.
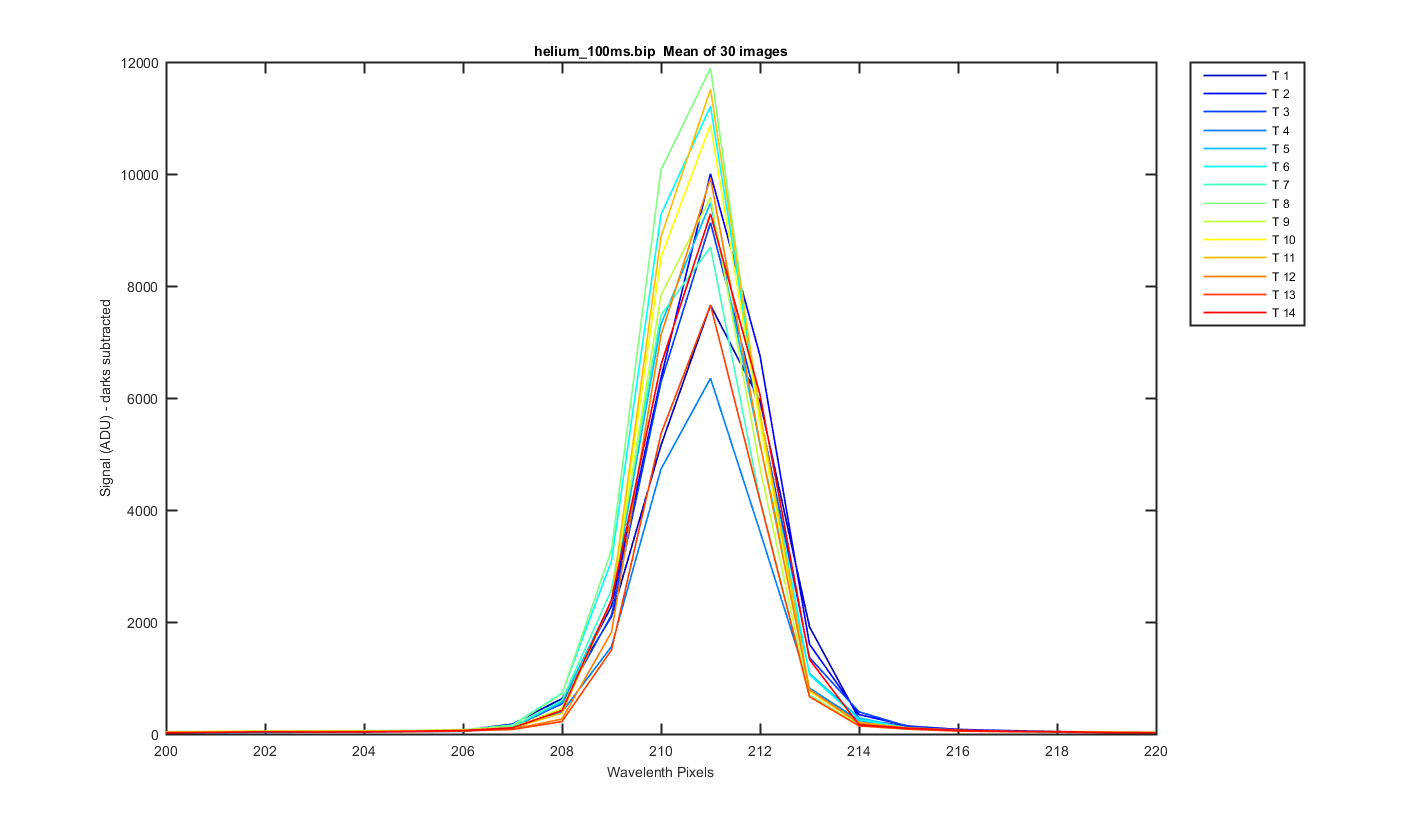
Figure 11
Close up of one of the helium peaks
Figure 12
Close up of one of the helium peaks
Figure 13
Close up of one of the helium peaks
Figure 14
Close up of one of the helium peaks
Figure 15
MY VERY ROUGH GUESS AT A WAVELENGTH CAL!!! THIS ASSUMES I GUESS CORRECTLY WHICH PEAKS WHERE WHICH HELIUM LINES. Originally I had ~ 506.51, 921.42, but after Mikes email I drop the peak at 683 and changed from 2nd order to linear. Mikes says "pix #1 = 504.70, pix #1024 = 911.97, with pixel separation = 0.40 nm" And Casey says "The spectral range of the system is 503.7 nm to 911.4 nm"
Track, Min,    Max,     diff,    P
    1, 503.68, 911.76,  0.40   0.398903 503.278023
    2, 503.66, 911.79,  0.40   0.398954 503.260534
    3, 503.71, 911.76,  0.40   0.398876 503.314264
    4, 503.76, 911.76,  0.40   0.398820 503.363898
    5, 503.78, 911.76,  0.40   0.398808 503.382015
    6, 503.81, 911.78,  0.40   0.398794 503.413502
    7, 503.83, 911.79,  0.40   0.398787 503.432892
    8, 503.83, 911.79,  0.40   0.398793 503.426762
    9, 503.80, 911.79,  0.40   0.398814 503.405725
   10, 503.79, 911.77,  0.40   0.398815 503.387363
   11, 503.78, 911.78,  0.40   0.398825 503.385346
   12, 503.76, 911.76,  0.40   0.398830 503.362759
   13, 503.74, 911.79,  0.40   0.398872 503.341854
   14, 503.70, 911.81,  0.40   0.398933 503.303070
Figure 16
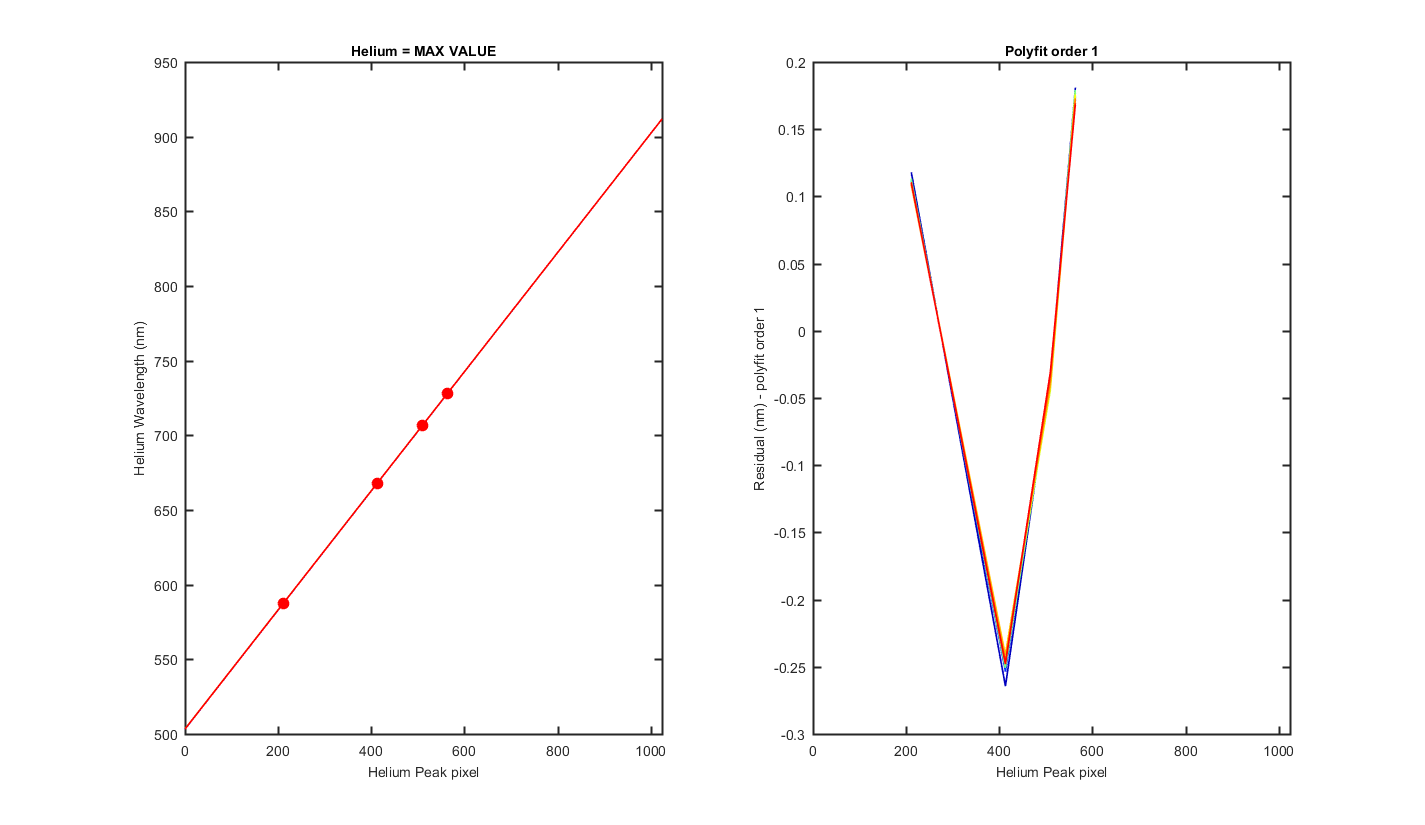
  Track = The Resonon Track number
Lwave = Laser Wavelength
Lpix1 = Laser Pixel found using the max value of the track
Lpix2 = Laser Pixel found using mygaussfit to fit the laser peak
| Track | Lwave | Lpix1 | Lpix2 |
|---|---|---|---|
| 1 | 587.5621 | 211 | 210.99 |
| 1 | 667.8151 | 413 | 413.14 |
| 1 | 706.519 | 510 | 509.59 |
| 1 | 728.1349 | 563 | 563.23 |
| 2 | 587.5621 | 211 | 211.02 |
| 2 | 667.8151 | 413 | 413.10 |
| 2 | 706.519 | 510 | 509.56 |
| 2 | 728.1349 | 563 | 563.23 |
| 3 | 587.5621 | 211 | 210.93 |
| 3 | 667.8151 | 413 | 413.04 |
| 3 | 706.519 | 510 | 509.53 |
| 3 | 728.1349 | 563 | 563.20 |
| 4 | 587.5621 | 211 | 210.84 |
| 4 | 667.8151 | 413 | 412.97 |
| 4 | 706.519 | 509 | 509.48 |
| 4 | 728.1349 | 563 | 563.15 |
| 5 | 587.5621 | 211 | 210.80 |
| 5 | 667.8151 | 413 | 412.93 |
| 5 | 706.519 | 509 | 509.46 |
| 5 | 728.1349 | 563 | 563.12 |
| 6 | 587.5621 | 211 | 210.73 |
| 6 | 667.8151 | 413 | 412.87 |
| 6 | 706.519 | 509 | 509.40 |
| 6 | 728.1349 | 563 | 563.06 |
| 7 | 587.5621 | 211 | 210.68 |
| 7 | 667.8151 | 413 | 412.83 |
| 7 | 706.519 | 509 | 509.36 |
| 7 | 728.1349 | 563 | 563.01 |
| 8 | 587.5621 | 211 | 210.69 |
| 8 | 667.8151 | 413 | 412.84 |
| 8 | 706.519 | 509 | 509.37 |
| 8 | 728.1349 | 563 | 563.02 |
| 9 | 587.5621 | 211 | 210.74 |
| 9 | 667.8151 | 413 | 412.85 |
| 9 | 706.519 | 509 | 509.40 |
| 9 | 728.1349 | 563 | 563.05 |
| 10 | 587.5621 | 211 | 210.79 |
| 10 | 667.8151 | 413 | 412.90 |
| 10 | 706.519 | 509 | 509.44 |
| 10 | 728.1349 | 563 | 563.10 |
| 11 | 587.5621 | 211 | 210.79 |
| 11 | 667.8151 | 413 | 412.89 |
| 11 | 706.519 | 509 | 509.43 |
| 11 | 728.1349 | 563 | 563.10 |
| 12 | 587.5621 | 211 | 210.84 |
| 12 | 667.8151 | 413 | 412.95 |
| 12 | 706.519 | 509 | 509.47 |
| 12 | 728.1349 | 563 | 563.15 |
| 13 | 587.5621 | 211 | 210.87 |
| 13 | 667.8151 | 413 | 412.96 |
| 13 | 706.519 | 509 | 509.46 |
| 13 | 728.1349 | 563 | 563.15 |
| 14 | 587.5621 | 211 | 210.93 |
| 14 | 667.8151 | 413 | 413.00 |
| 14 | 706.519 | 510 | 509.48 |
| 14 | 728.1349 | 563 | 563.16 |