REVISION DATE: 07-Dec-2015 09:41:31
Email from Mike Kehoe on 2 Dec 2015 4:24 pm:
Greetings All,

We received the revised lenses for the MOBY Red system an assembled and tested the first unit.  Initial results are as follows:

1.  14 fibers fit on CCD per attached image, "cross_section_white_light.png."
2.  Smile at center wavelength, 705 nm is essentially zero, per attached image, smile_705nm.png."
3.  FWHM spectral line width is 2.4 pixels at 587 nm and 667 nm and 2.5 pixels at 705 nm.  This corresponds to a spectral resolution of just about 1 nm.

I propose that we run the system on our shaker table over the weekend and check the results on Monday.  If things remain stable, we will then glue
things up and ship next week.  Please let me know if this agenda meets your needs.

-Mike

Additional email from Mike on 12/2/2015 4:43 PM:
The spacing difference looks like some tilt to me.  I would guess that is from tilt of the fiber bundle in its mount since that is the loosest tolerance.
The camera image plane it tilted 1.4 w.r.t. its mount on this one, which is pretty good and wouldnt cause that effect.  The other possibility
is the PGP, although less likely as it seems to sit well in its mount.  The measurement data indicates the lenses are pretty well centered in the barrels,
so theres unlikely to be a problem there.  We will look into this issue some more this week.

Additional email from Casey Smith on 12/2/2015 7:13 PM:
Indeed, this data was taken with a non-uniform light source.  I am mostly looking for feedback before we proceed further, as it takes time to finalize the alingment,
seal up all of the light leaks necessary during alignment, rig mounting to collect careful radiance data, etc.  If these initial measurements look acceptable enough to
proceed, I can fire up our integrating sphere light source on Friday and collected better fiber-fiber data.

MIKES EMAIL-----------------------------------------------------------------------------------------------------
Hi Mark, Hi Steph,

I looked at the NIST Atomic Spectra Database for Helium lines (in-air, nm)
( http://www.nist.gov/pml/data/asd.cfm,  "Lines",  "He I,   500 to 1000 nm"  )

and from the 4x big peaks in helium.bip data from Stephanie, I regressed:
pix=[ 209 411 508 562 ], wav=[ 587.5621 667.8151 706.5190 728.1349 ]
wav_fit(nm) = 504.30 + 0.39813 * pix   (r^2=1.0, SE=0.11, N=4)

This gives pix #1 = 504.70, pix #1024 = 911.97, with pixel separation = 0.40 nm.

 think this is aboot the same as Stephs work (except for her 778 nm point).

The 3x small peaks in helium.bip were somewhat problematic for me:
pix=[ 342 683 848 ], give via the above regression
wav_fit(nm)=[ 640.46 776.22 841.91 ]  -
there is really no NIST He line(s) near 640 nm, and
the nearest NIST to the others are 781.61 & 836.17, which are off by +/- 5 nm.

Cheers, MF

FROM CASEY EMAIL-----------------------------------------------------------------------------------------------------
The spectral range of the system is 503.7 nm to 911.4 nm, although as Mike pointed out the cut-on wavelength is closer to 540 nm due to the high pass filter coating.
Mike included two pngs (cross_section_whitelight.png and smile_705nm.png) and later send two bip files (helium.bip and whitelight.bip).
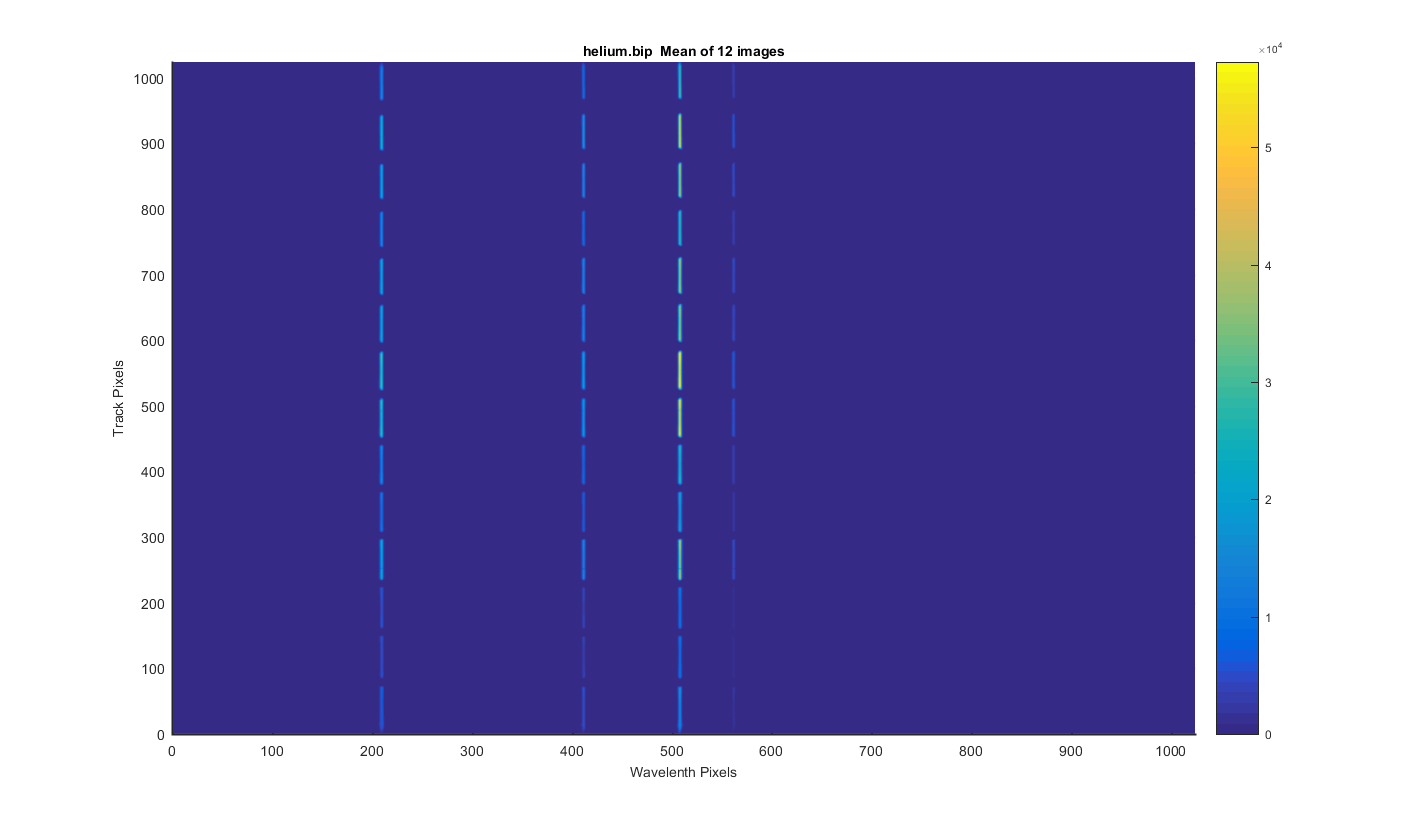
Below are my graphs of the helium.bip file. The file contains 12 images of the helium source. Over all it looks really stable and track definition looks good. See each graph below for more detail.
I took the 12 images and meaned them to get the surface plot below. It is a little harder to see the dark track widths here but the look the same as the white light source.
Figure 1
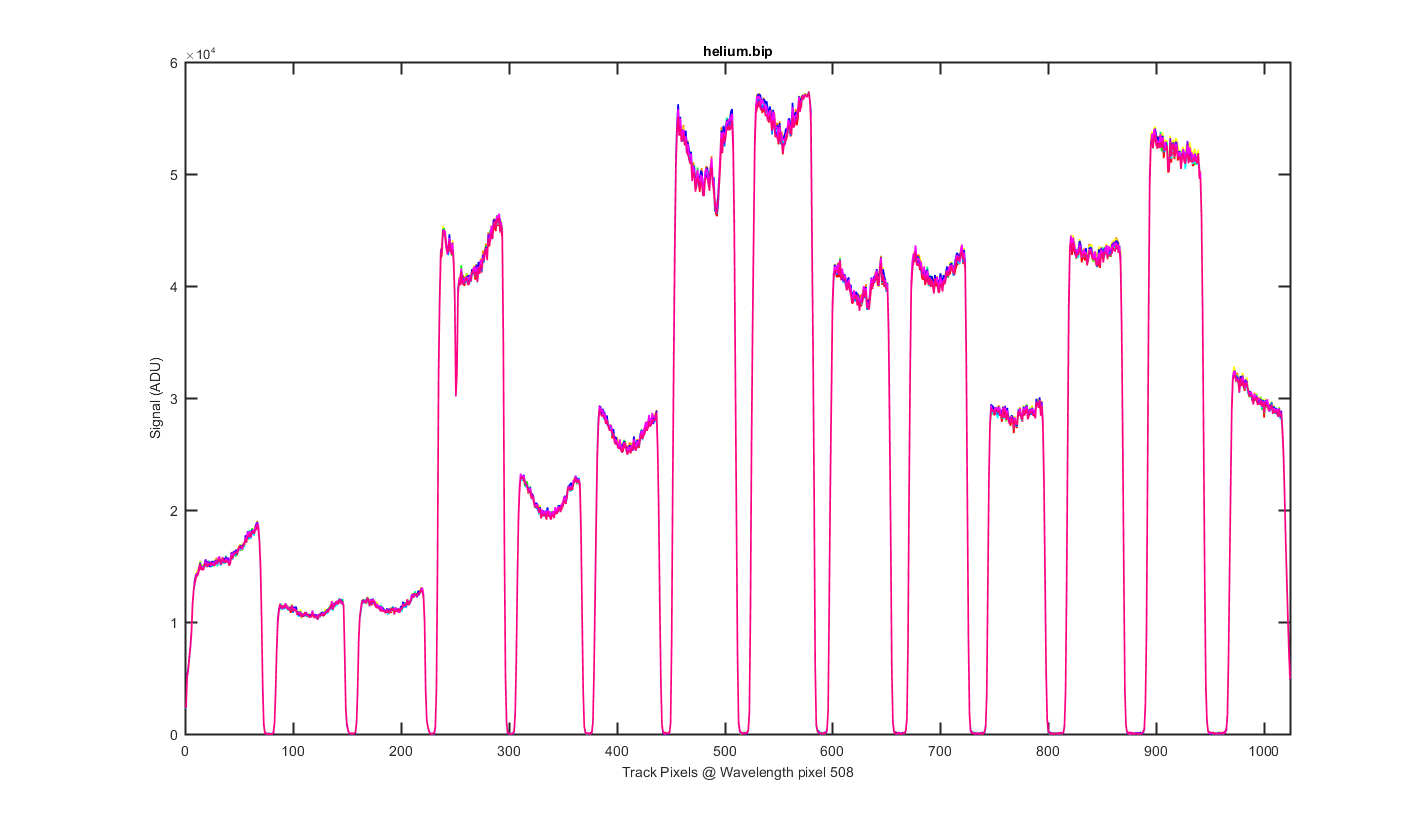
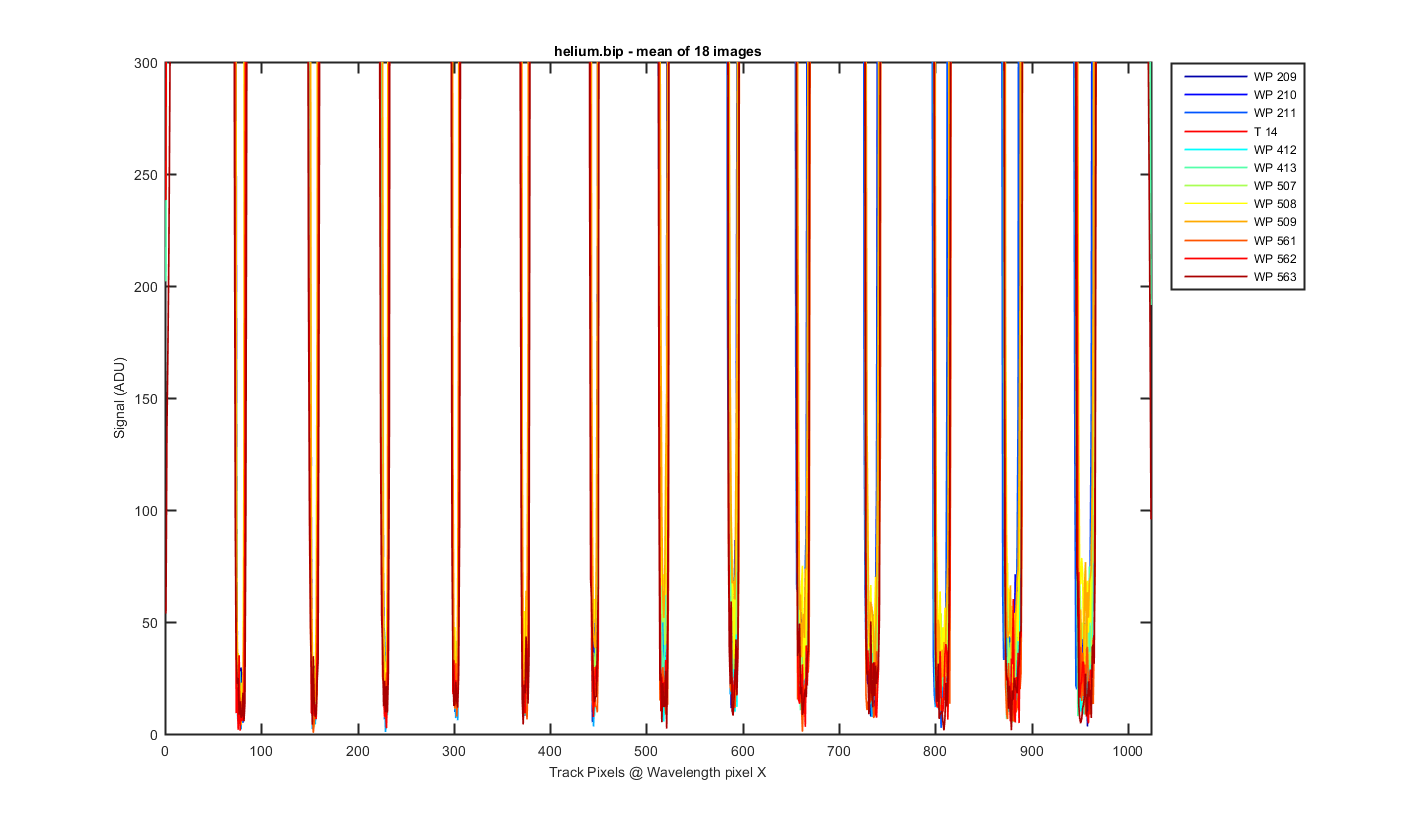
This is a cross section through the tracks at wavelength pixel 508, with one line for each of the 12 images. The tracks and their shapes look really stable. You can see the differences in the width of the spacing between the tracks here too.
Figure 2
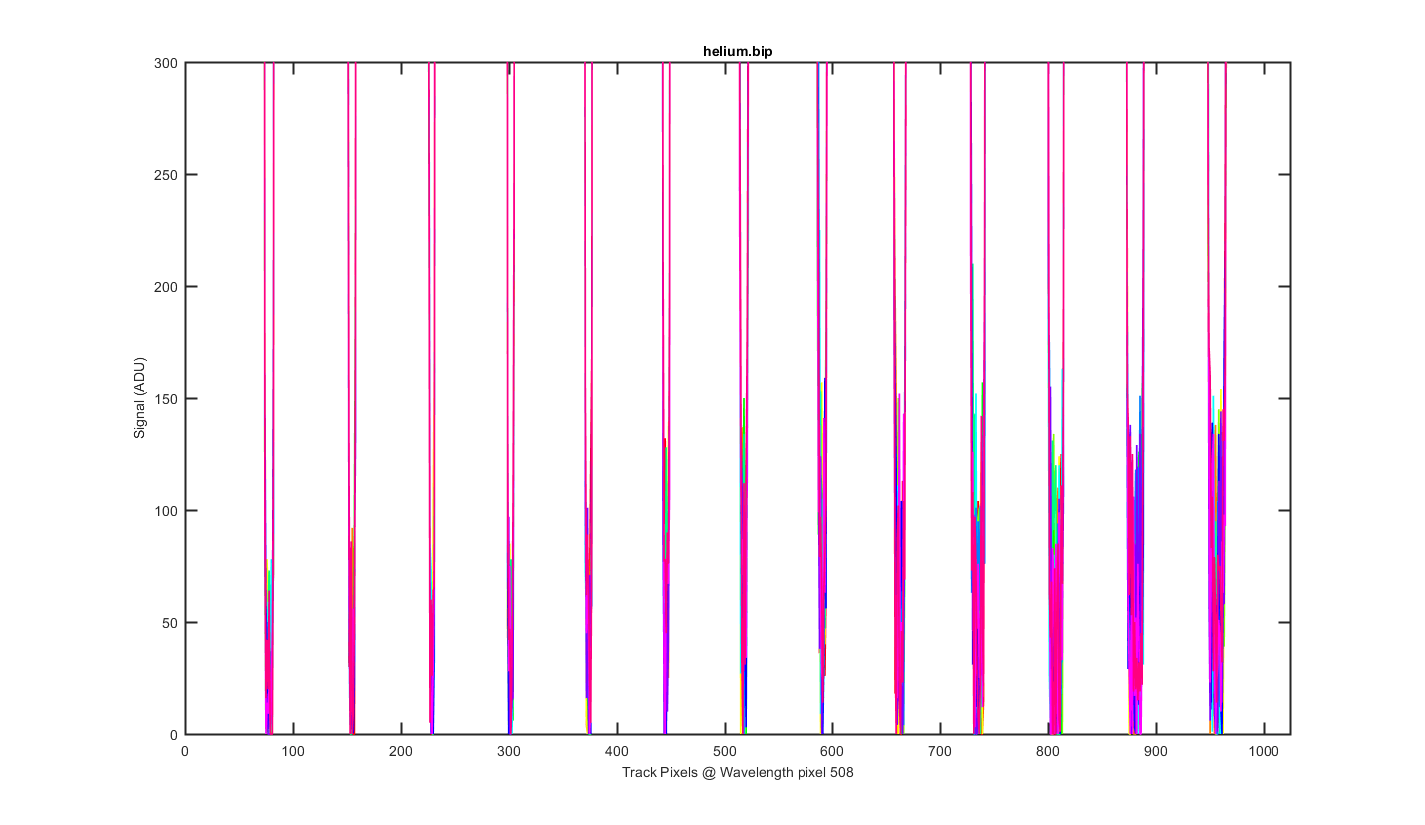
Same as the previous graph but zoomed into the bottom to see the level of the darks between the tracks. For this source the dark tracks go nearly to zero, interesting. I think we saw this before?
Figure 3
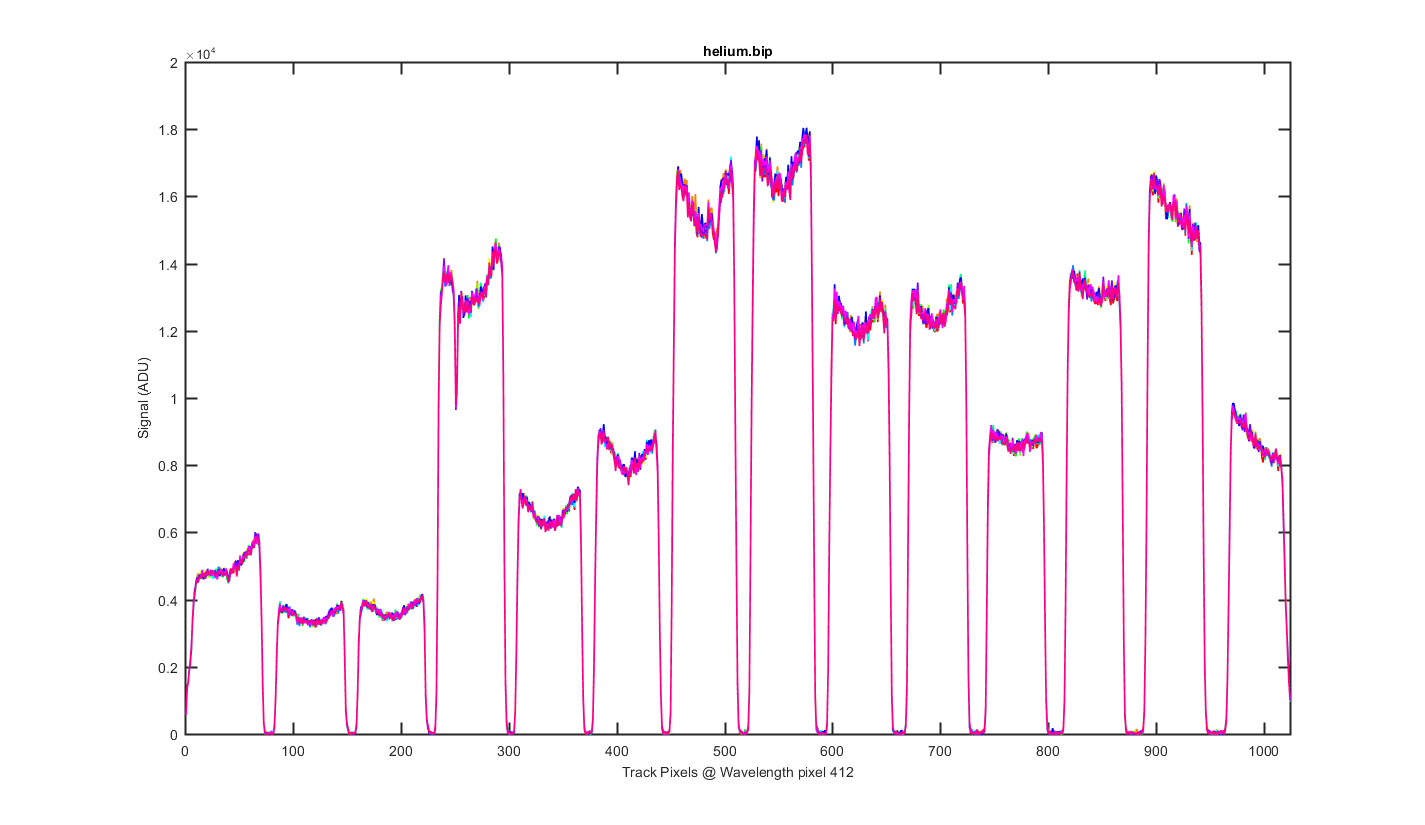
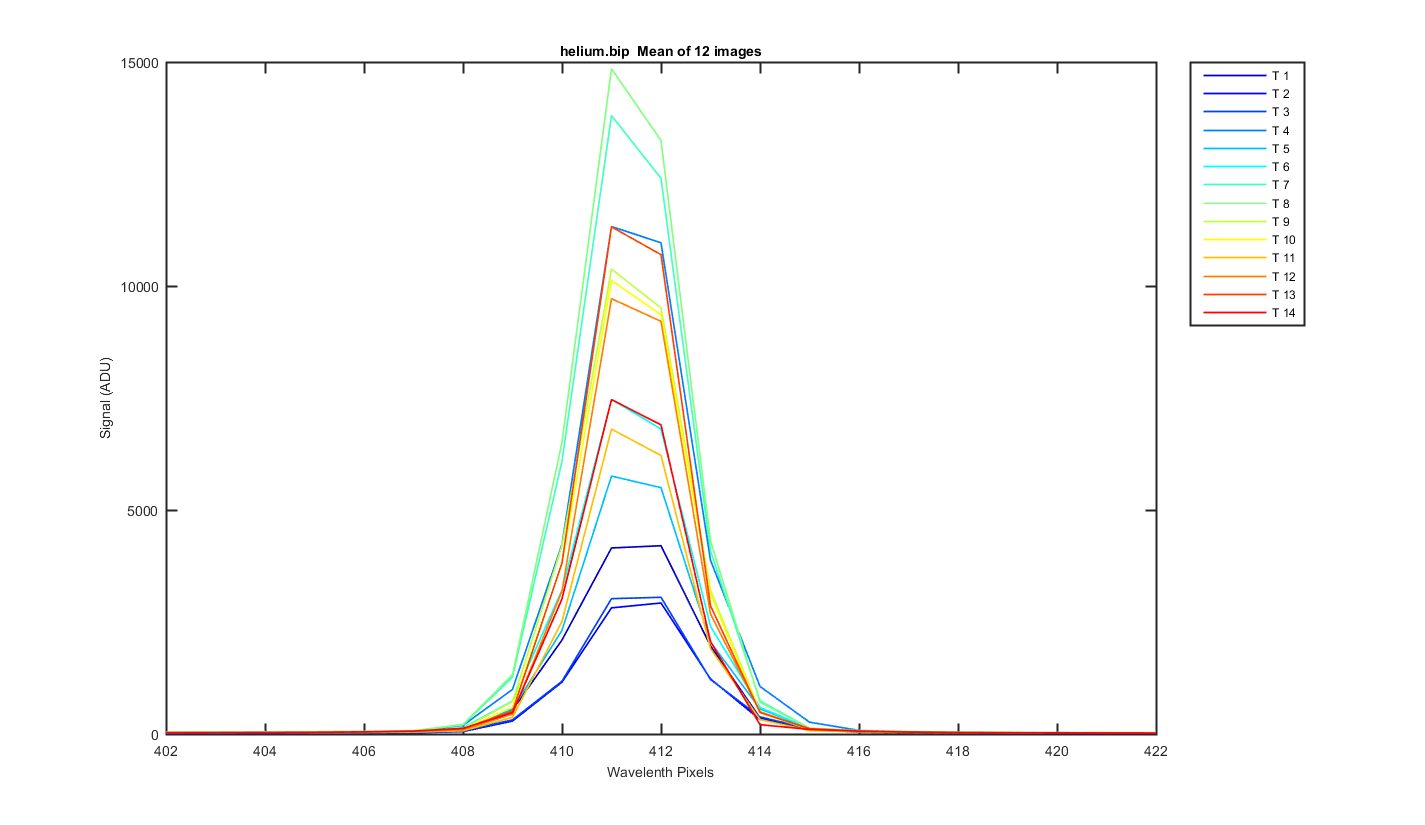
Same as figure 2 but for Wavelength pixel 412.
Figure 4
Again this is the mean image with slices thought the image at different wavelength pixels. The pixels choosen are where the helium peaks are and +- pixel pixel around them.
Figure 5
Same as figure 5 but zoomed to the bottom so you can see the darks between the tracks.
Figure 6
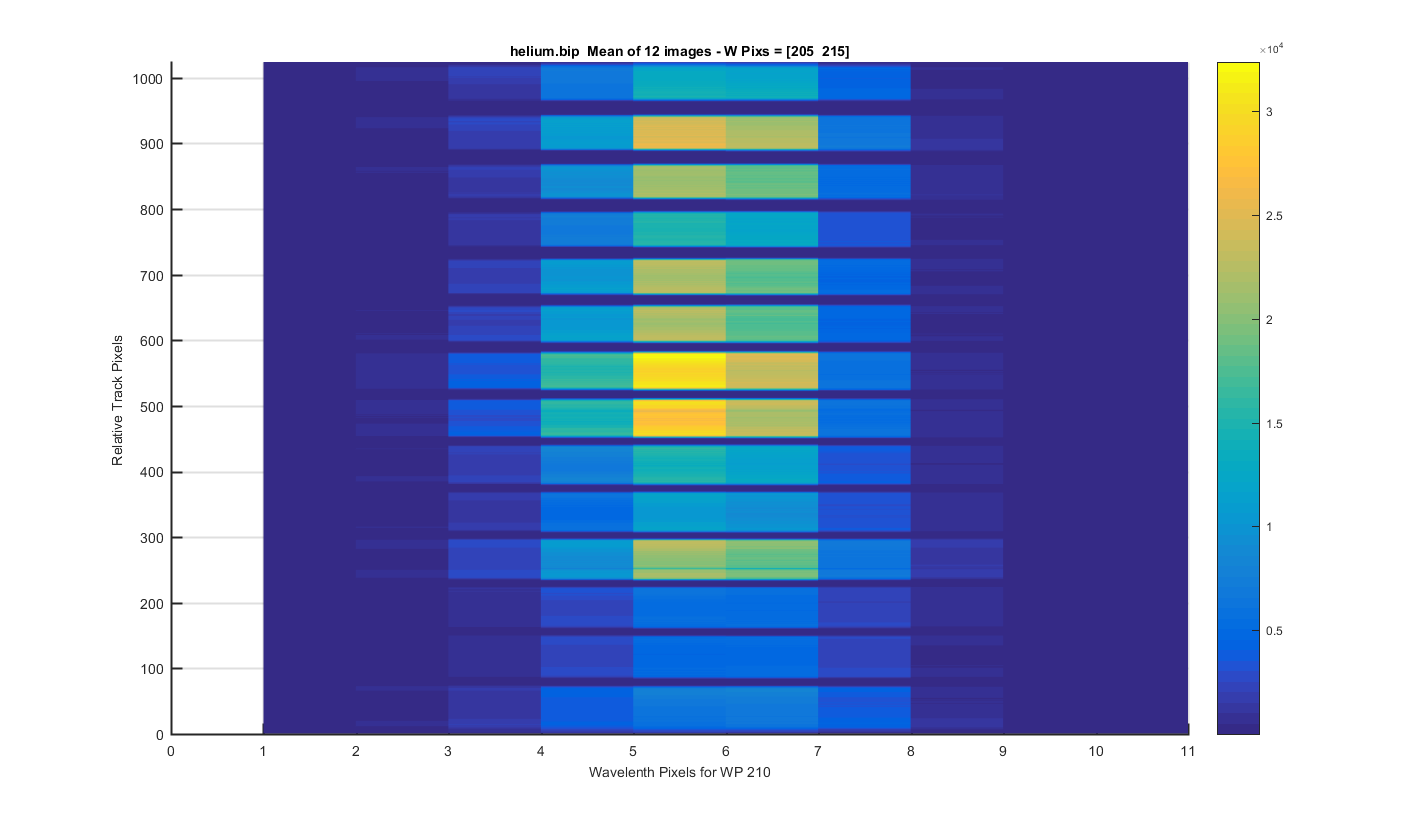
Helimu Peak 1 (at pix 210): The same surface plot but showing how individual helium peaks line up from track to track. Looks pretty good!
Figure 7
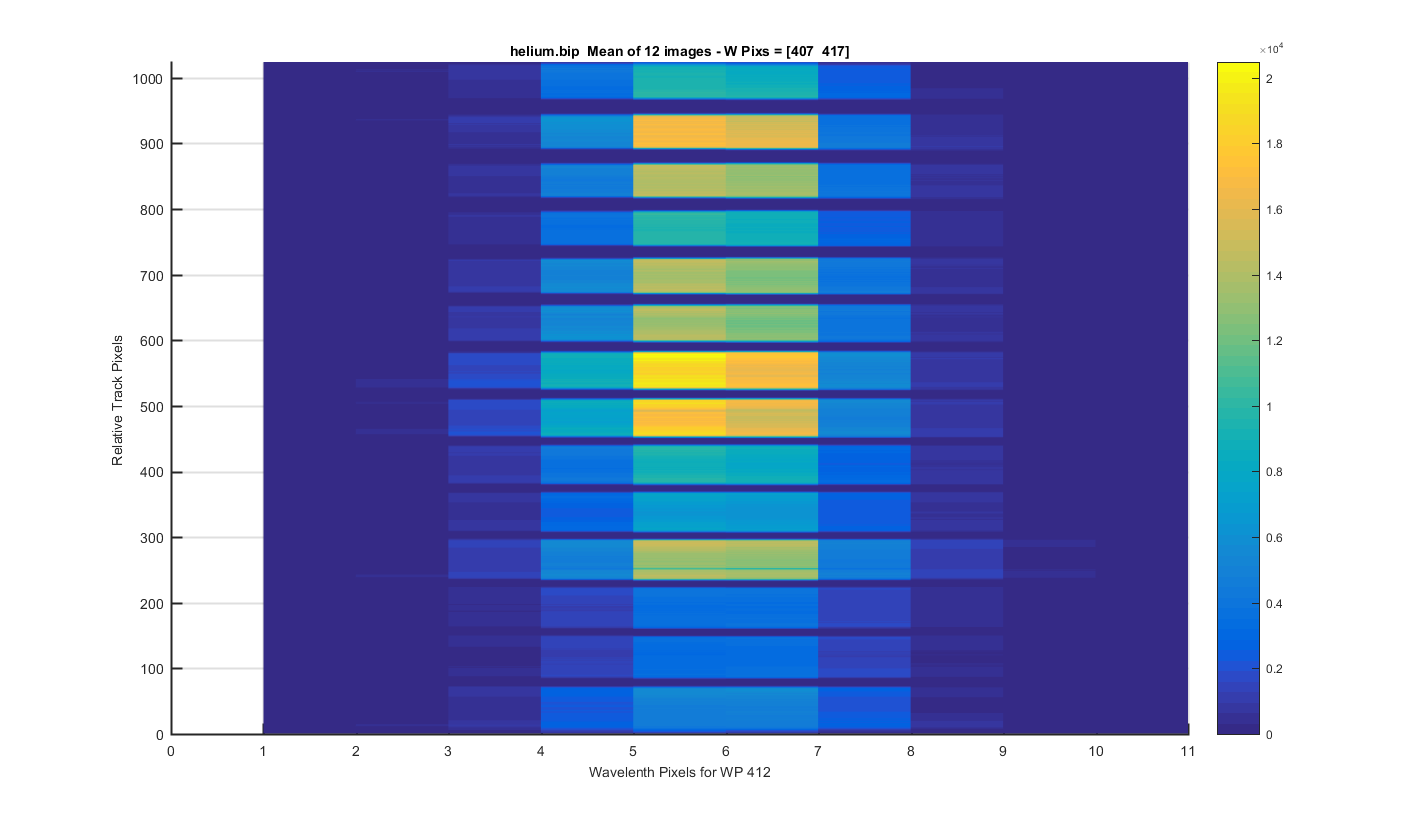
Helimu Peak 2 (at pix 412): The same surface plot but showing how individual helium peaks line up from track to track. Looks pretty good!
Figure 8
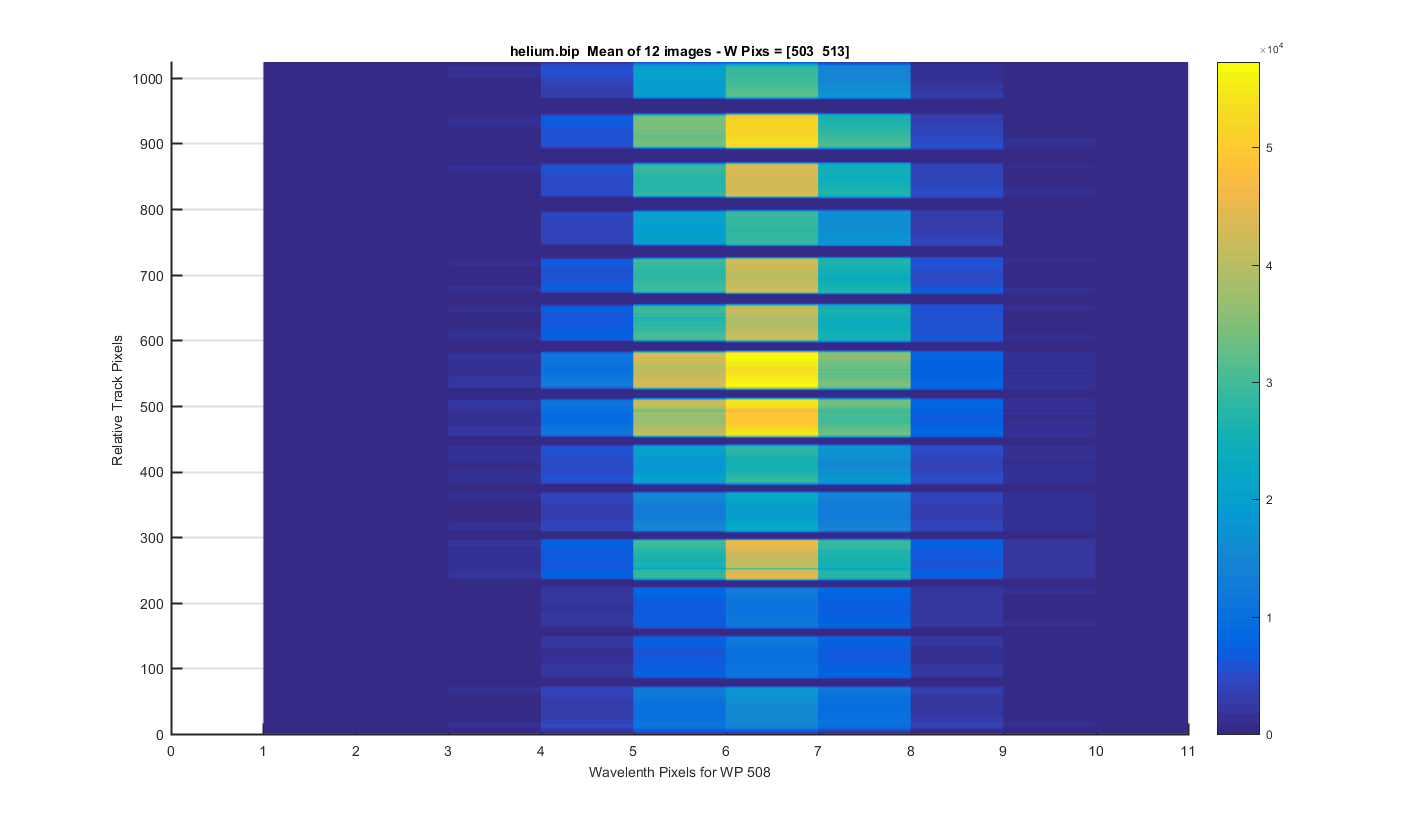
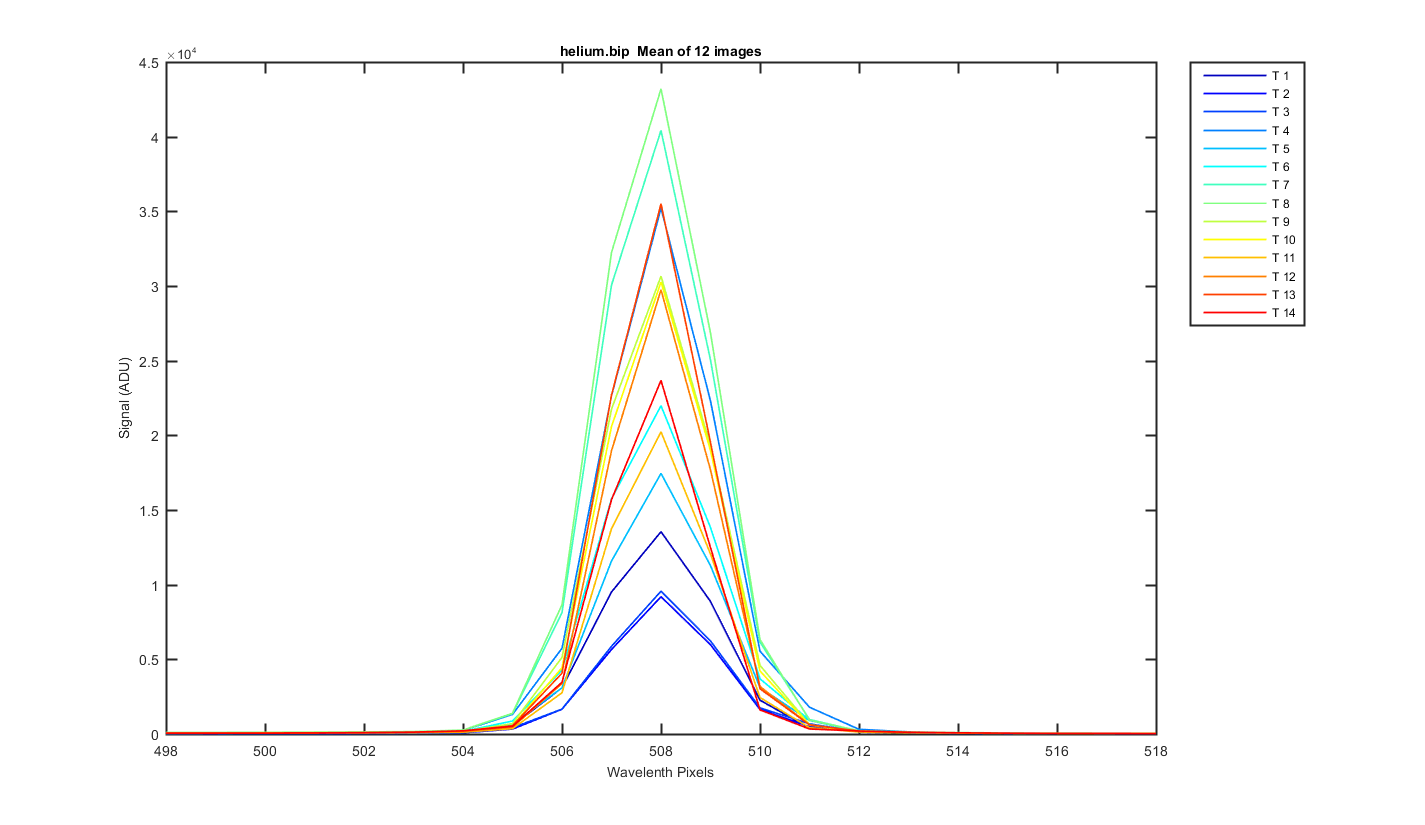
Helimu Peak 3 (at pix 508): The same surface plot but showing how individual helium peaks line up from track to track. Looks pretty good!
Figure 9
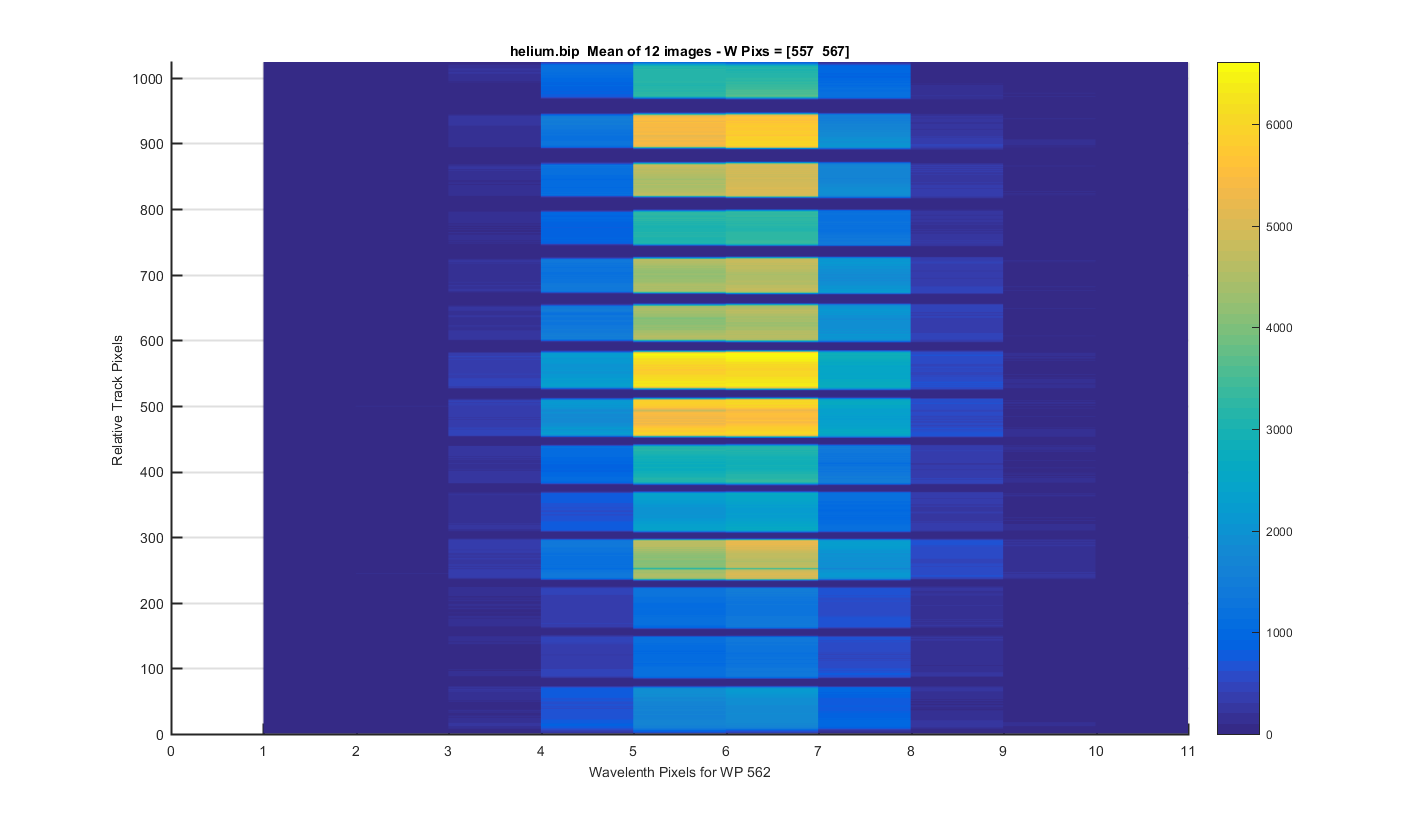
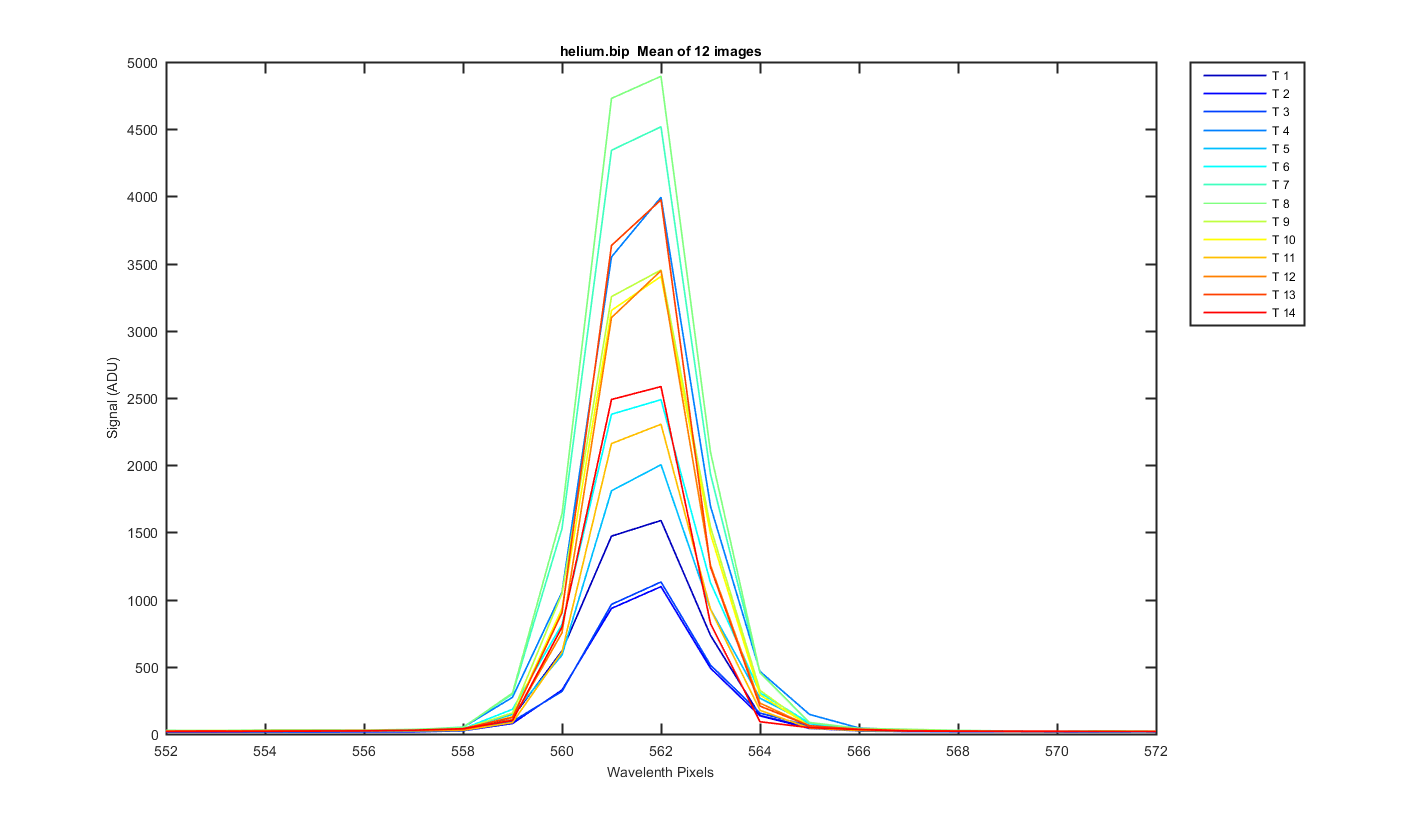
Helimu Peak 4 (at pix 562): The same surface plot but showing how individual helium peaks line up from track to track. Looks pretty good!
Figure 10
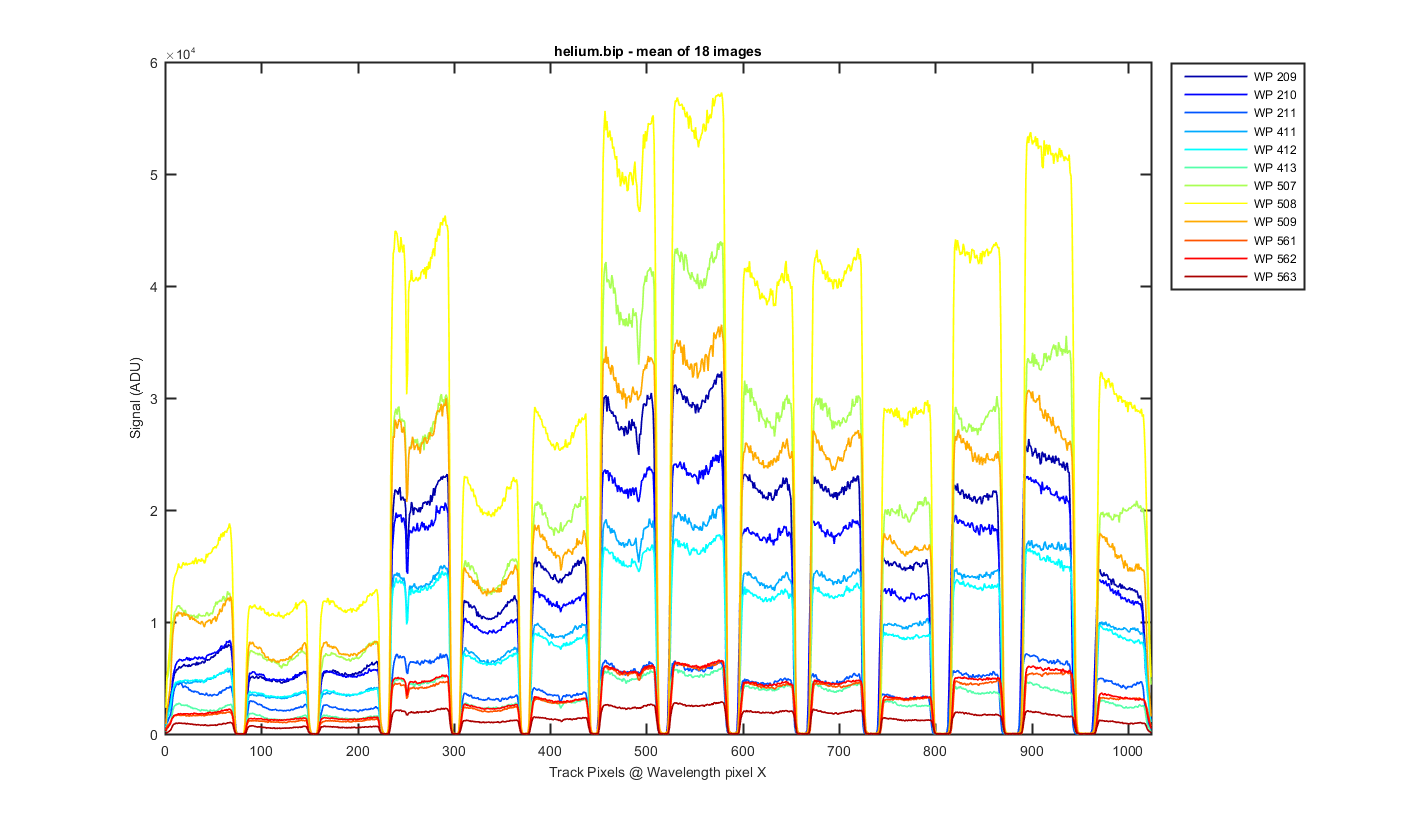
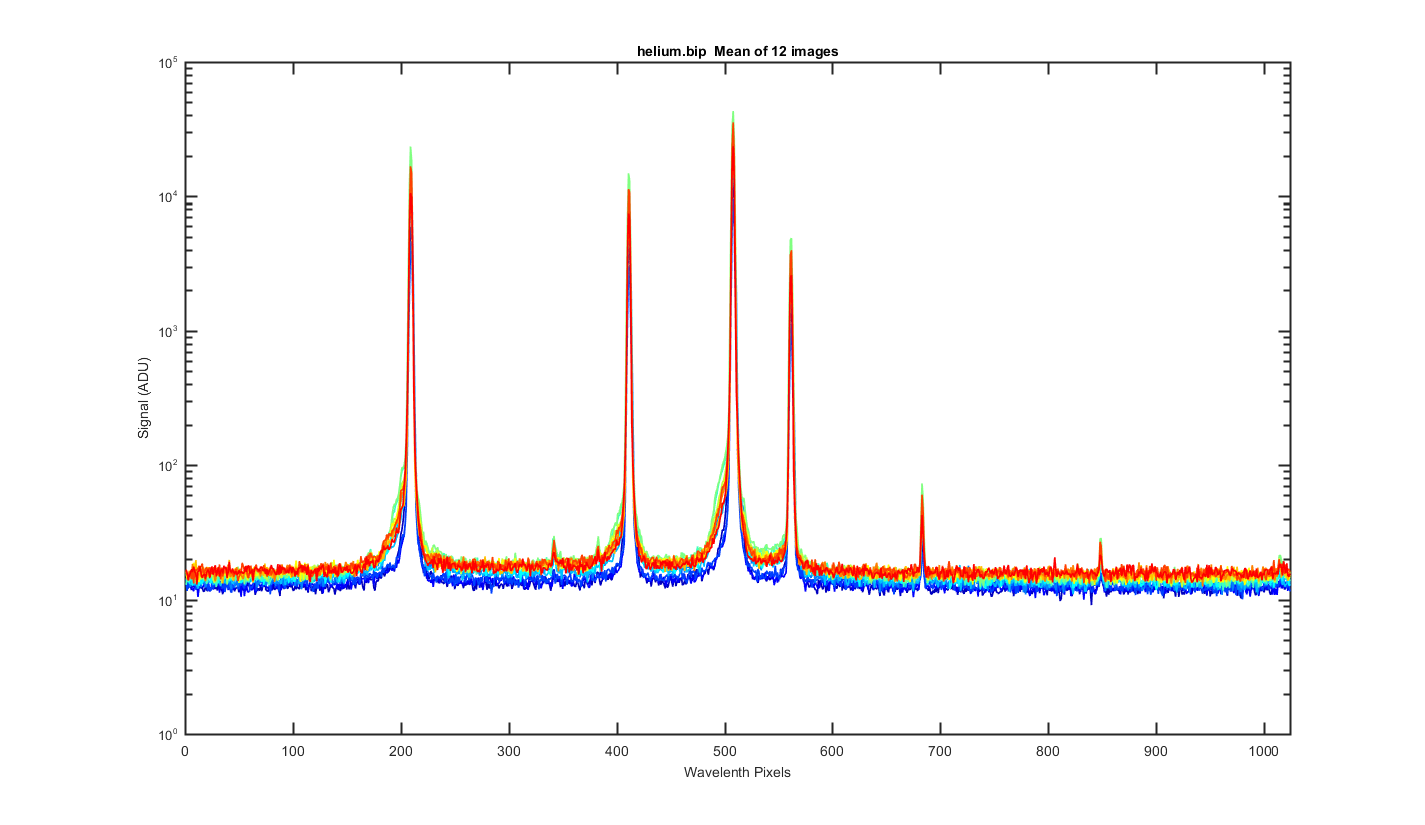
Mean image binned by track, the x-axis is wavelength pixels.
Figure 11
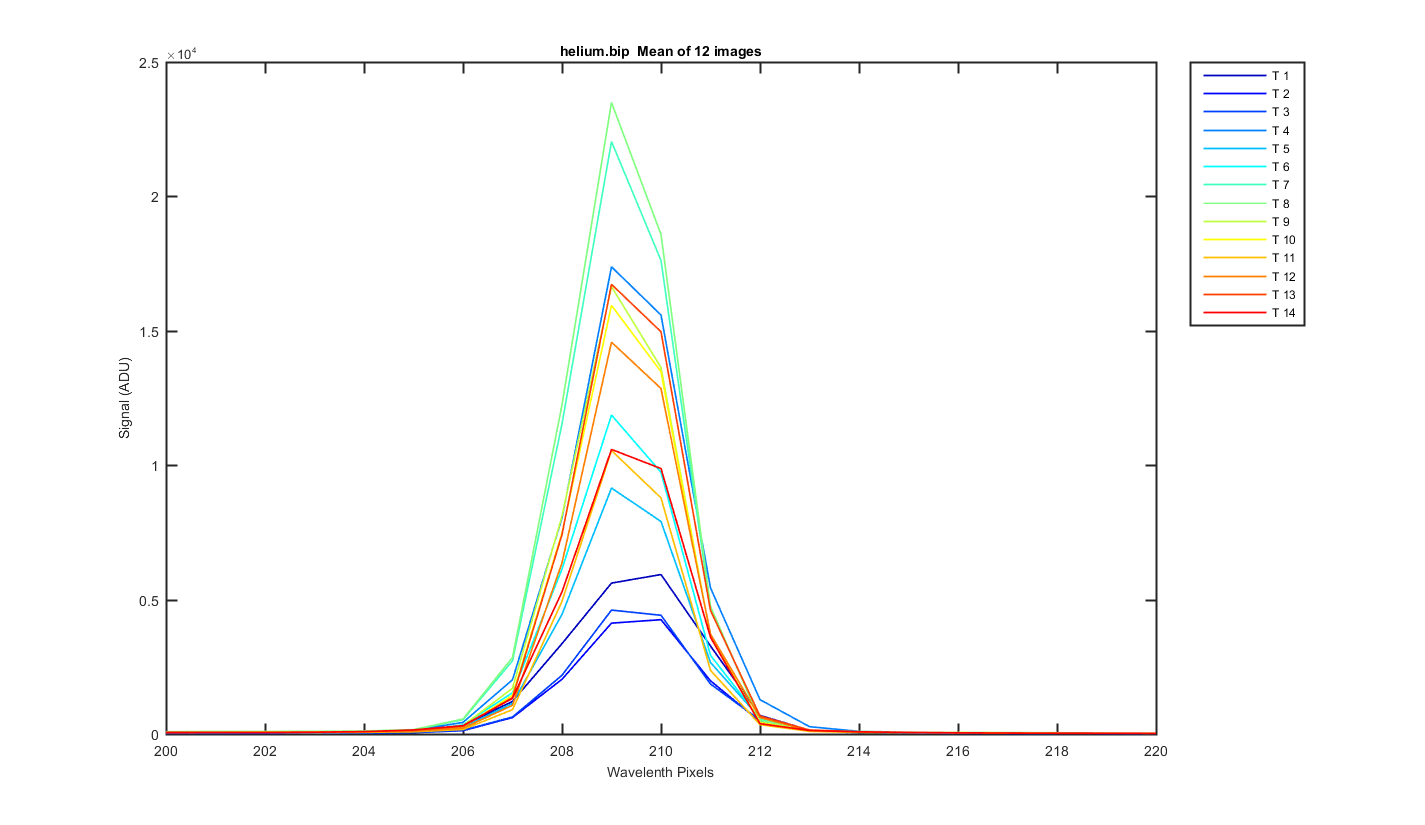
Close up of one of the helium peaks
Figure 12
Close up of one of the helium peaks
Figure 13
Close up of one of the helium peaks
Figure 14
Close up of one of the helium peaks
Figure 15
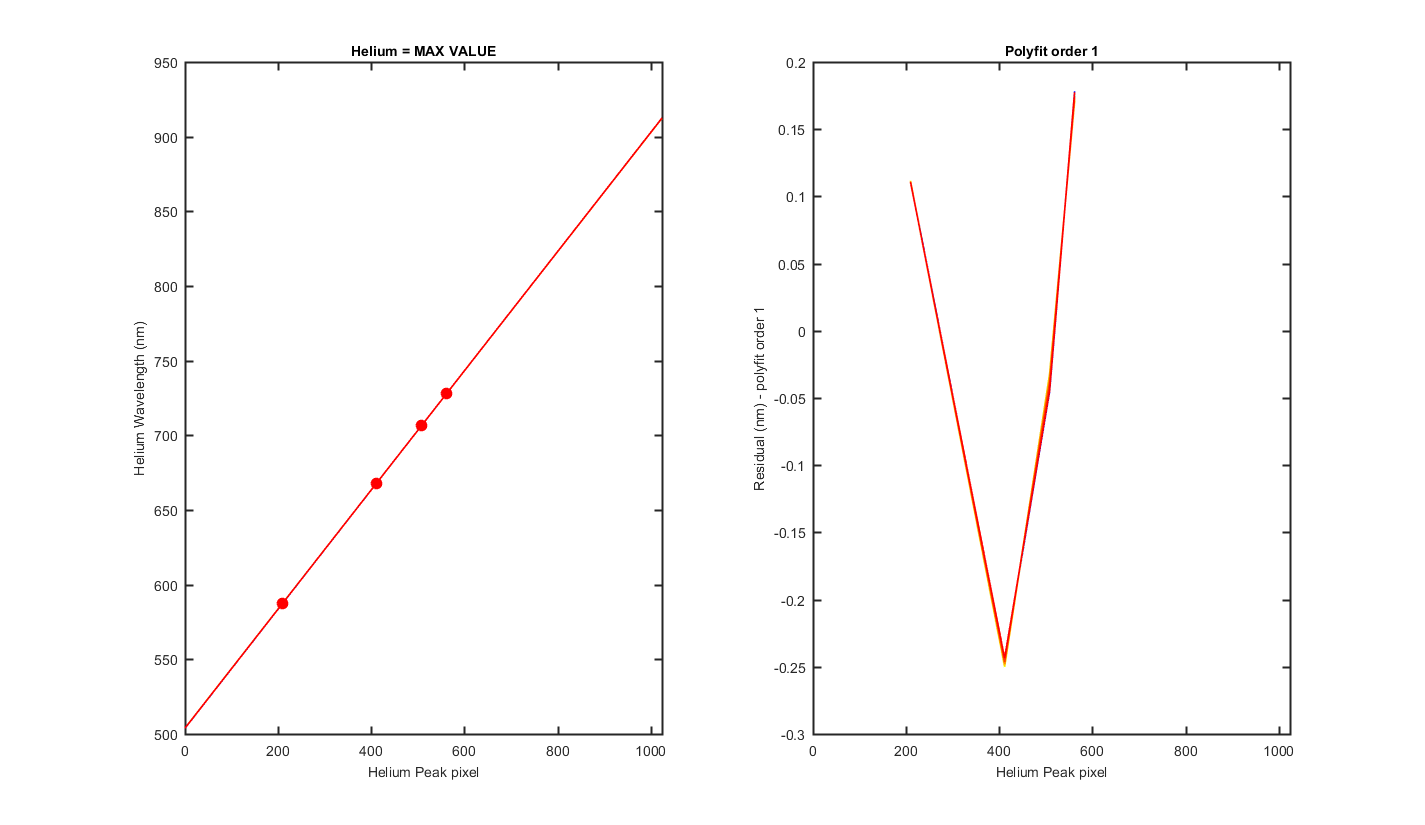
MY VERY ROUGH GUESS AT A WAVELENGTH CAL!!! THIS ASSUMES I GUESS CORRECTLY WHICH PEAKS WHERE WHICH HELIUM LINES. Originally I had ~ 506.51, 921.42, but after Mikes email I drop the peak at 683 and changed from 2nd order to linear. Mikes says "pix #1 = 504.70, pix #1024 = 911.97, with pixel separation = 0.40 nm" And Casey says "The spectral range of the system is 503.7 nm to 911.4 nm"
Track, Min,    Max,     diff
    1, 504.25, 912.50,  0.40
    2, 504.27, 912.43,  0.40
    3, 504.31, 912.38,  0.40
    4, 504.35, 912.37,  0.40
    5, 504.38, 912.34,  0.40
    6, 504.41, 912.35,  0.40
    7, 504.43, 912.35,  0.40
    8, 504.44, 912.34,  0.40
    9, 504.41, 912.34,  0.40
   10, 504.40, 912.33,  0.40
   11, 504.40, 912.35,  0.40
   12, 504.36, 912.37,  0.40
   13, 504.34, 912.42,  0.40
   14, 504.32, 912.48,  0.40
Figure 16
  Track = The Resonon Track number
Lwave = Laser Wavelength
Lpix1 = Laser Pixel found using the max value of the track
Lpix2 = Laser Pixel found using mygaussfit to fit the laser peak
| Track | Lwave | Lpix1 | Lpix2 |
|---|---|---|---|
| 1 | 587.5621 | 210 | 209.48 |
| 1 | 667.8151 | 412 | 411.47 |
| 1 | 706.519 | 508 | 507.95 |
| 1 | 728.1349 | 562 | 561.57 |
| 2 | 587.5621 | 210 | 209.49 |
| 2 | 667.8151 | 412 | 411.52 |
| 2 | 706.519 | 508 | 508.03 |
| 2 | 728.1349 | 562 | 561.65 |
| 3 | 587.5621 | 209 | 209.43 |
| 3 | 667.8151 | 412 | 411.51 |
| 3 | 706.519 | 508 | 508.03 |
| 3 | 728.1349 | 562 | 561.67 |
| 4 | 587.5621 | 209 | 209.36 |
| 4 | 667.8151 | 411 | 411.47 |
| 4 | 706.519 | 508 | 507.99 |
| 4 | 728.1349 | 562 | 561.65 |
| 5 | 587.5621 | 209 | 209.31 |
| 5 | 667.8151 | 411 | 411.46 |
| 5 | 706.519 | 508 | 507.98 |
| 5 | 728.1349 | 562 | 561.66 |
| 6 | 587.5621 | 209 | 209.24 |
| 6 | 667.8151 | 411 | 411.40 |
| 6 | 706.519 | 508 | 507.92 |
| 6 | 728.1349 | 562 | 561.61 |
| 7 | 587.5621 | 209 | 209.20 |
| 7 | 667.8151 | 411 | 411.36 |
| 7 | 706.519 | 508 | 507.91 |
| 7 | 728.1349 | 562 | 561.58 |
| 8 | 587.5621 | 209 | 209.19 |
| 8 | 667.8151 | 411 | 411.36 |
| 8 | 706.519 | 508 | 507.91 |
| 8 | 728.1349 | 562 | 561.58 |
| 9 | 587.5621 | 209 | 209.24 |
| 9 | 667.8151 | 411 | 411.41 |
| 9 | 706.519 | 508 | 507.93 |
| 9 | 728.1349 | 562 | 561.63 |
| 10 | 587.5621 | 209 | 209.27 |
| 10 | 667.8151 | 411 | 411.44 |
| 10 | 706.519 | 508 | 507.95 |
| 10 | 728.1349 | 562 | 561.64 |
| 11 | 587.5621 | 209 | 209.27 |
| 11 | 667.8151 | 411 | 411.42 |
| 11 | 706.519 | 508 | 507.93 |
| 11 | 728.1349 | 562 | 561.62 |
| 12 | 587.5621 | 209 | 209.33 |
| 12 | 667.8151 | 411 | 411.45 |
| 12 | 706.519 | 508 | 507.96 |
| 12 | 728.1349 | 562 | 561.64 |
| 13 | 587.5621 | 209 | 209.34 |
| 13 | 667.8151 | 411 | 411.42 |
| 13 | 706.519 | 508 | 507.93 |
| 13 | 728.1349 | 562 | 561.58 |
| 14 | 587.5621 | 209 | 209.36 |
| 14 | 667.8151 | 411 | 411.38 |
| 14 | 706.519 | 508 | 507.89 |
| 14 | 728.1349 | 562 | 561.51 |