REVISION DATE: 03-Dec-2015 13:27:10
Email from Mike Kehoe on 2 Dec 2015 4:24 pm:
Greetings All,

We received the revised lenses for the MOBY Red system an assembled and tested the first unit.  Initial results are as follows:

1.  14 fibers fit on CCD per attached image, "cross_section_white_light.png."
2.  Smile at center wavelength, 705 nm is essentially zero, per attached image, smile_705nm.png."
3.  FWHM spectral line width is 2.4 pixels at 587 nm and 667 nm and 2.5 pixels at 705 nm.  This corresponds to a spectral resolution of just about 1 nm.

I propose that we run the system on our shaker table over the weekend and check the results on Monday.  If things remain stable, we will then glue
things up and ship next week.  Please let me know if this agenda meets your needs.

-Mike

Additional email from Mike on 12/2/2015 4:43 PM:
The spacing difference looks like some tilt to me.  I would guess that is from tilt of the fiber bundle in its mount since that is the loosest tolerance.
The camera image plane it tilted 1.4 w.r.t. its mount on this one, which is pretty good and wouldnt cause that effect.  The other possibility
is the PGP, although less likely as it seems to sit well in its mount.  The measurement data indicates the lenses are pretty well centered in the barrels,
so theres unlikely to be a problem there.  We will look into this issue some more this week.

Additional email from Casey Smith on 12/2/2015 7:13 PM:
Indeed, this data was taken with a non-uniform light source.  I am mostly looking for feedback before we proceed further, as it takes time to finalize the alingment,
seal up all of the light leaks necessary during alignment, rig mounting to collect careful radiance data, etc.  If these initial measurements look acceptable enough to
proceed, I can fire up our integrating sphere light source on Friday and collected better fiber-fiber data.
Mike included two pngs (cross_section_whitelight.png and smile_705nm.png) and later send two bip files (helium.bip and whitelight.bip).
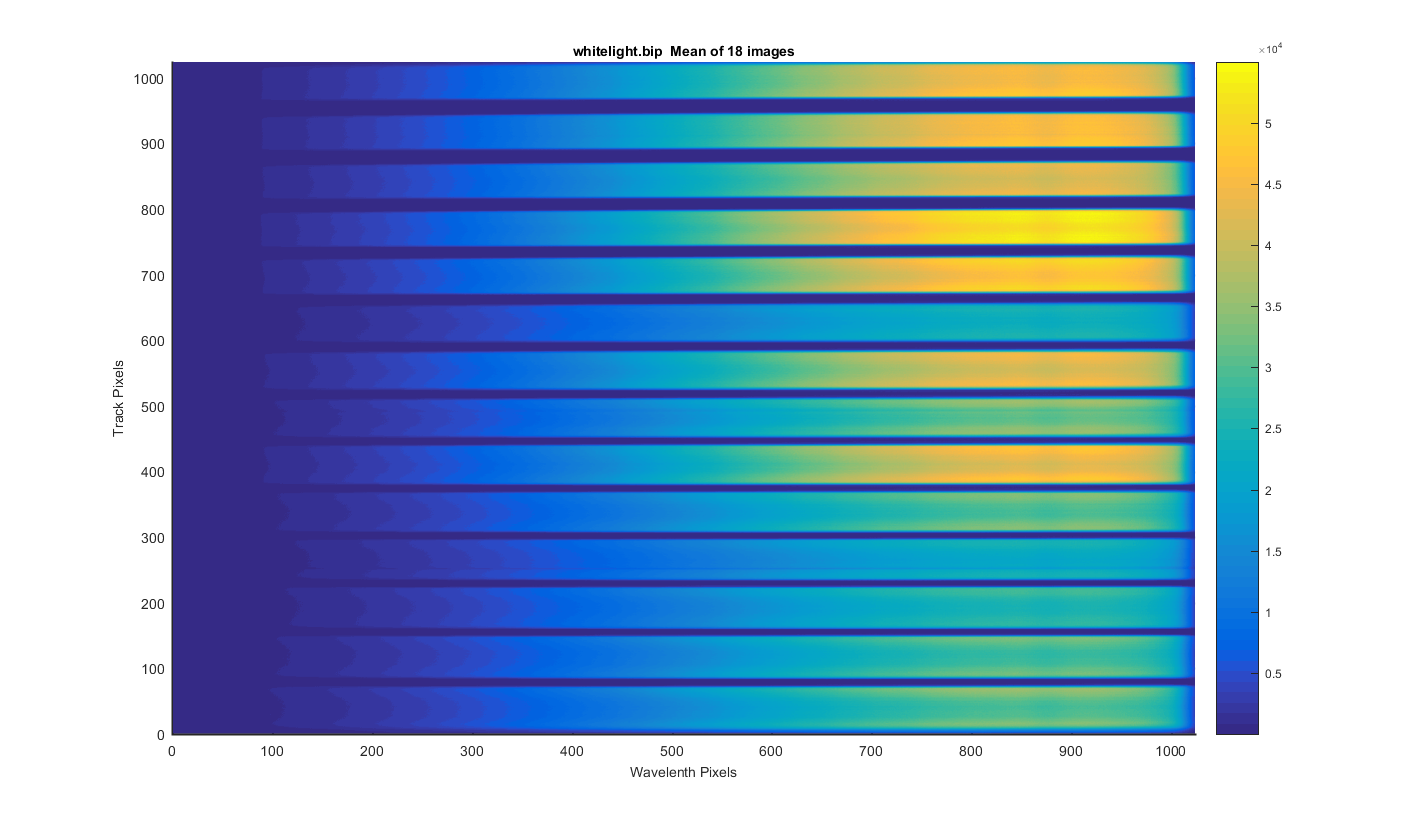
Below are my graphs of the whitelight.bip file. The file contains 18 images of the white lgith source. Over all it looks really stable and track definition looks good. See each graph below for more detail.
I took the 18 images and meaned them to get the surface plot below. Things to note 1) notice that the width of the dark areas between the tracks is tighter at the bottom than wider at the top. 2) Tracks are wider at the bottom and narrower at the top. 3) Track 4 (4th from bottom) has a line in it from one end to the other.
Figure 1
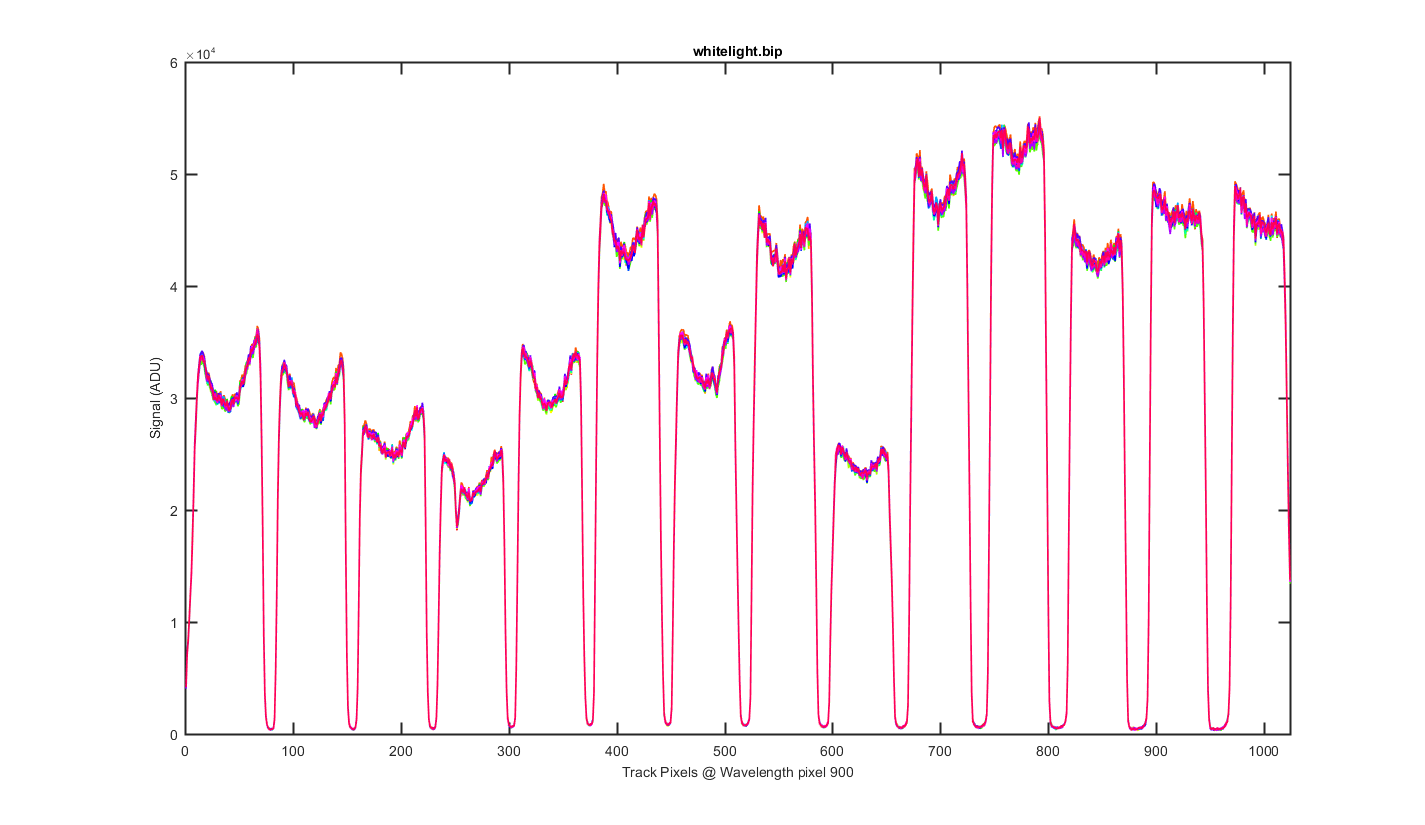
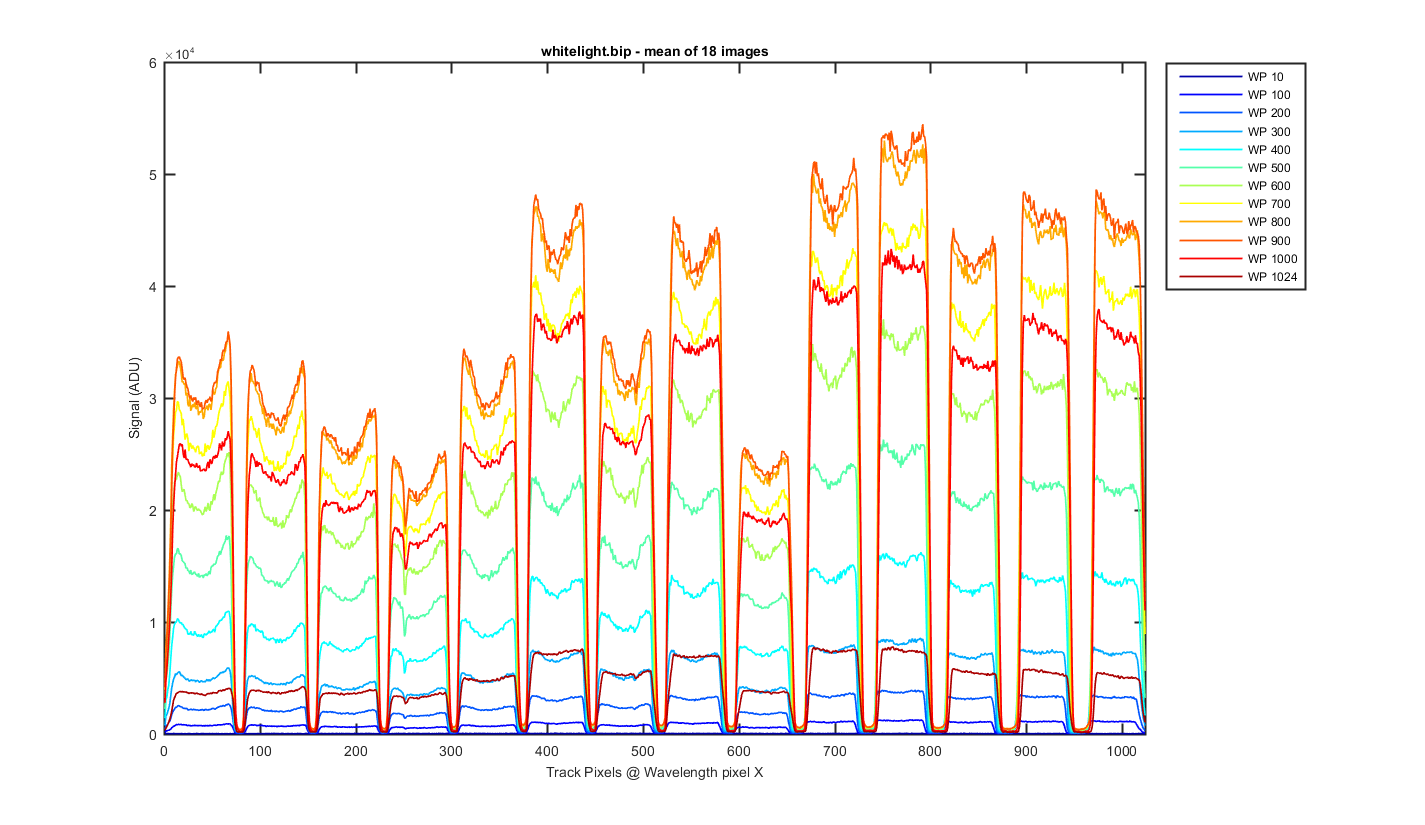
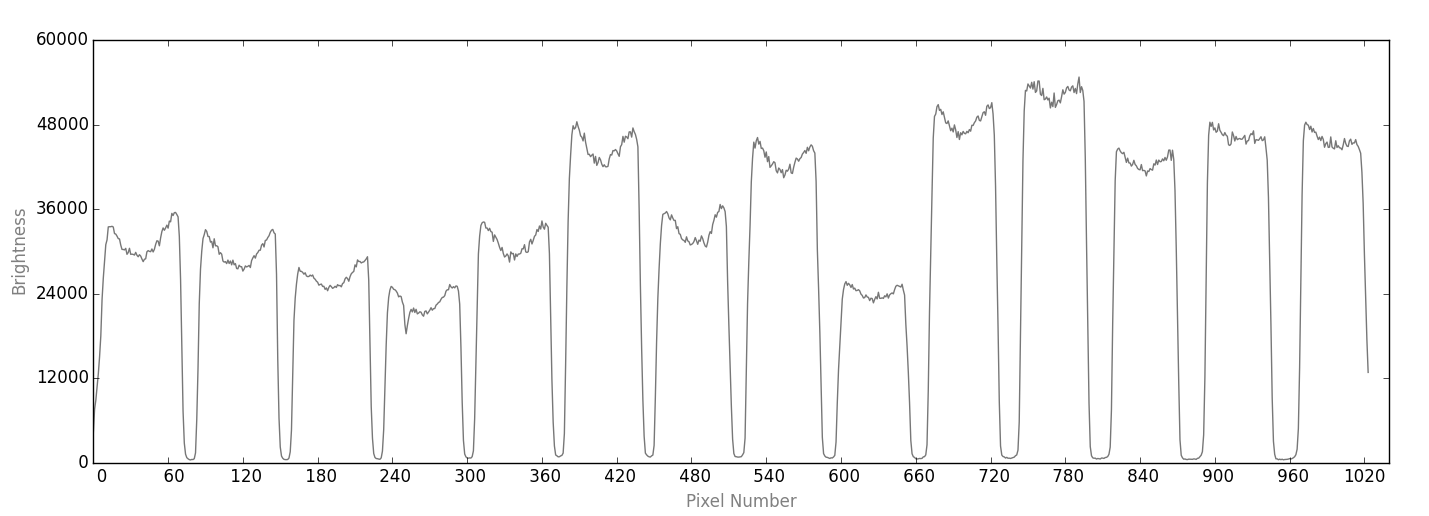
This is a cross section through the tracks at wavelength pixel 900, with one line for each of the 18 images. The tracks and their shapes look really stable. You can see the differences in the width of the spacing between the tracks here too.
Figure 2
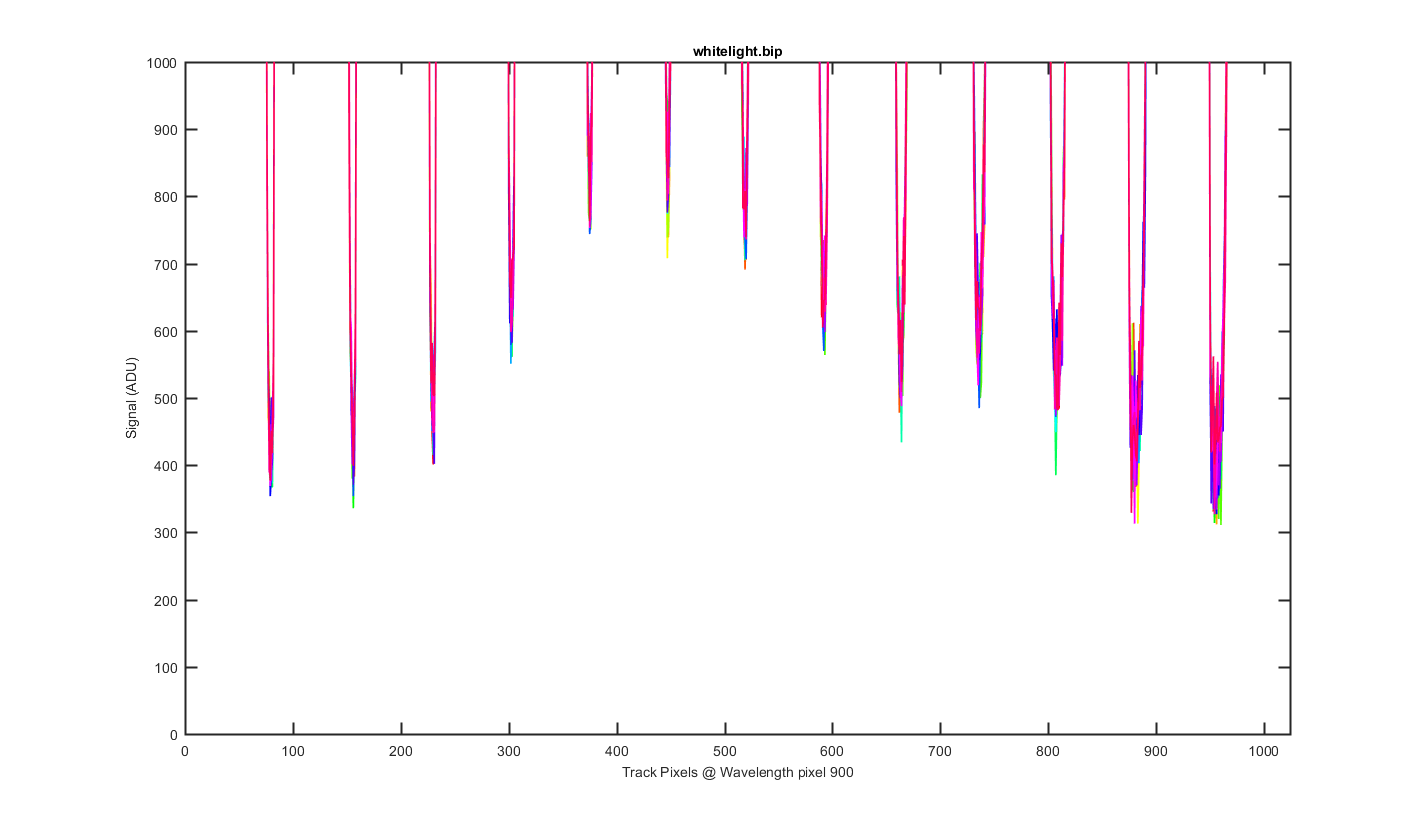
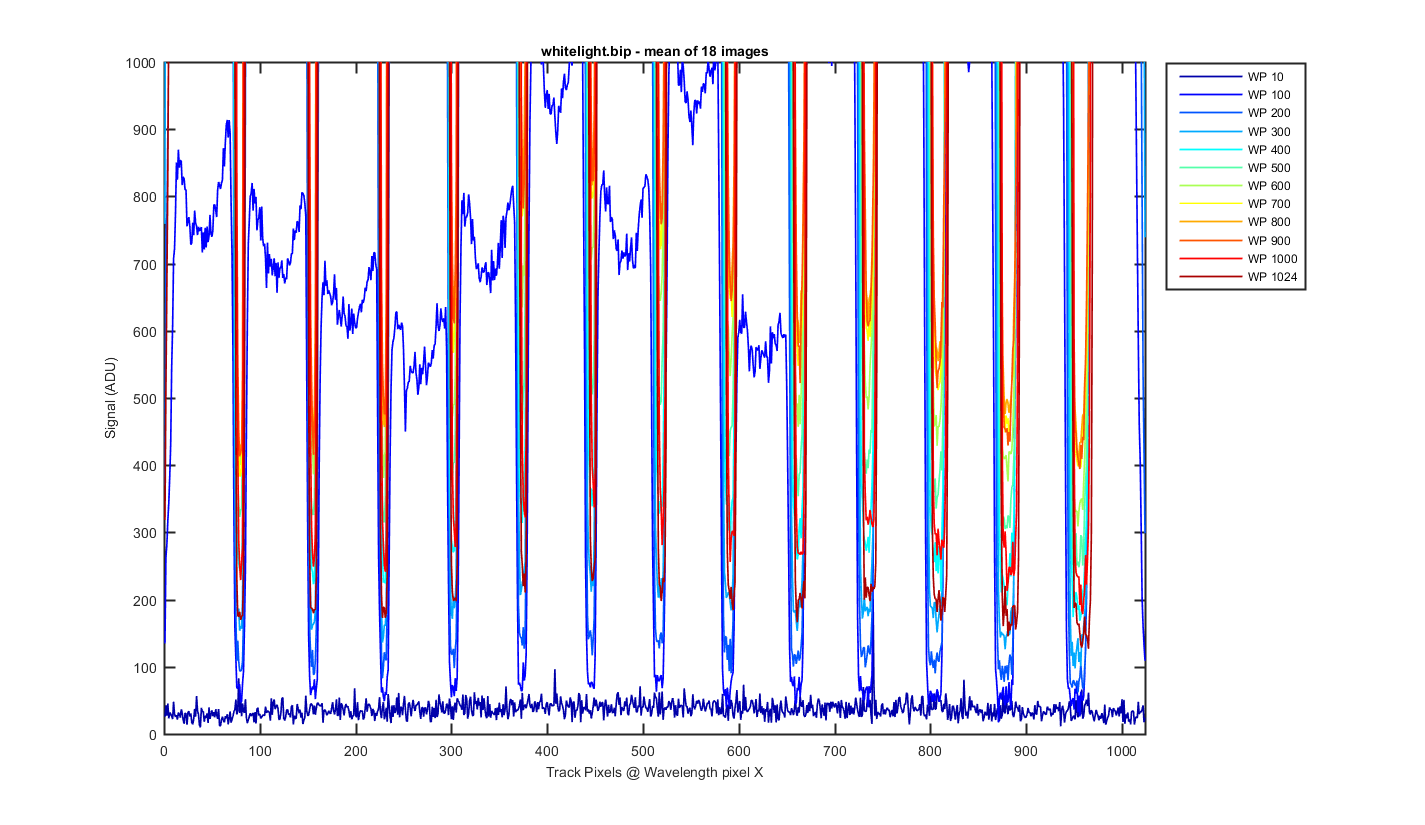
Same as the previous graph but zoomed into the bottom to see the level of the darks between the tracks. Looks like there might be more light getting between the tracks for tracks 4-9??
Figure 3
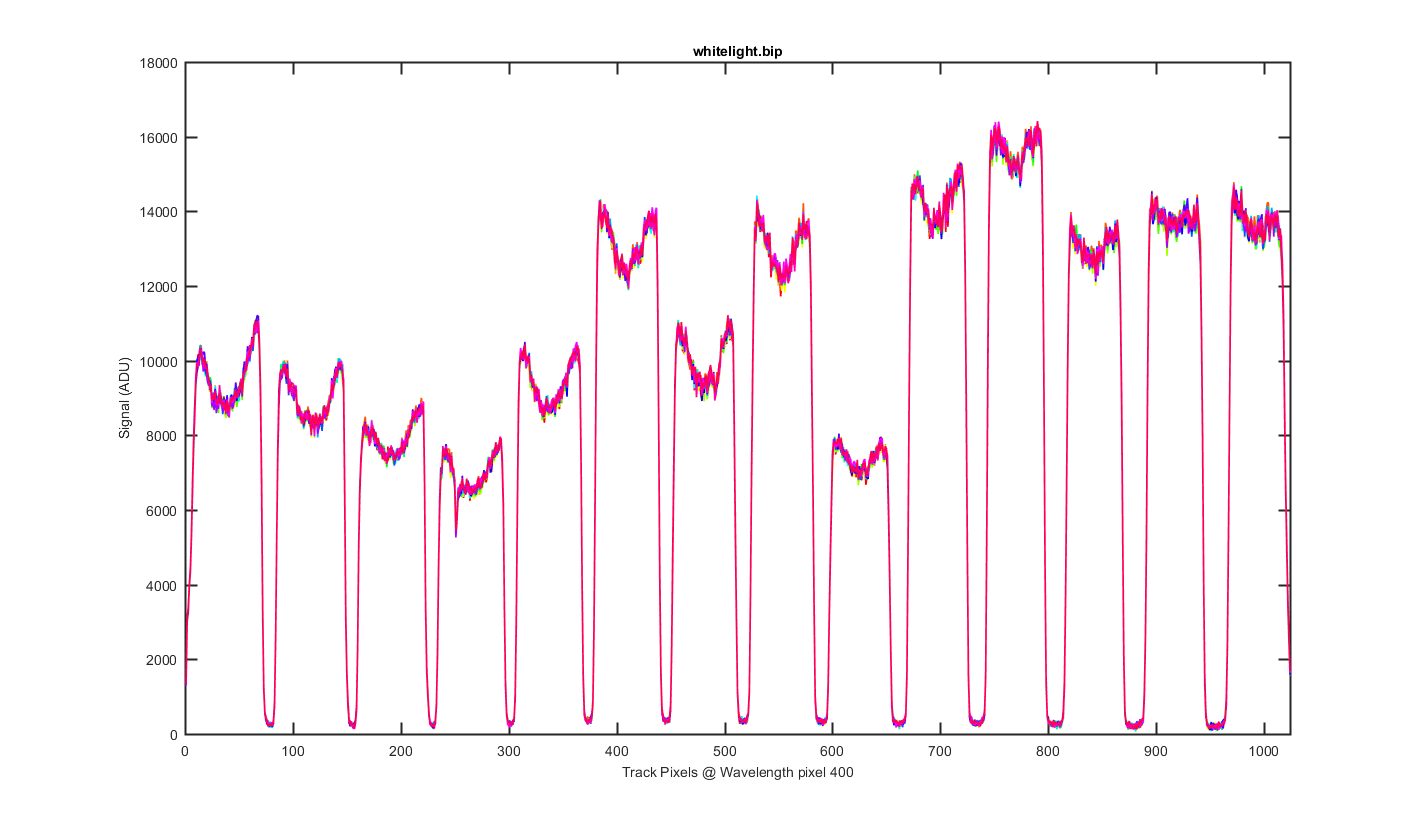
Same as figure 2 but for Wavelength pixel 400.
Figure 4
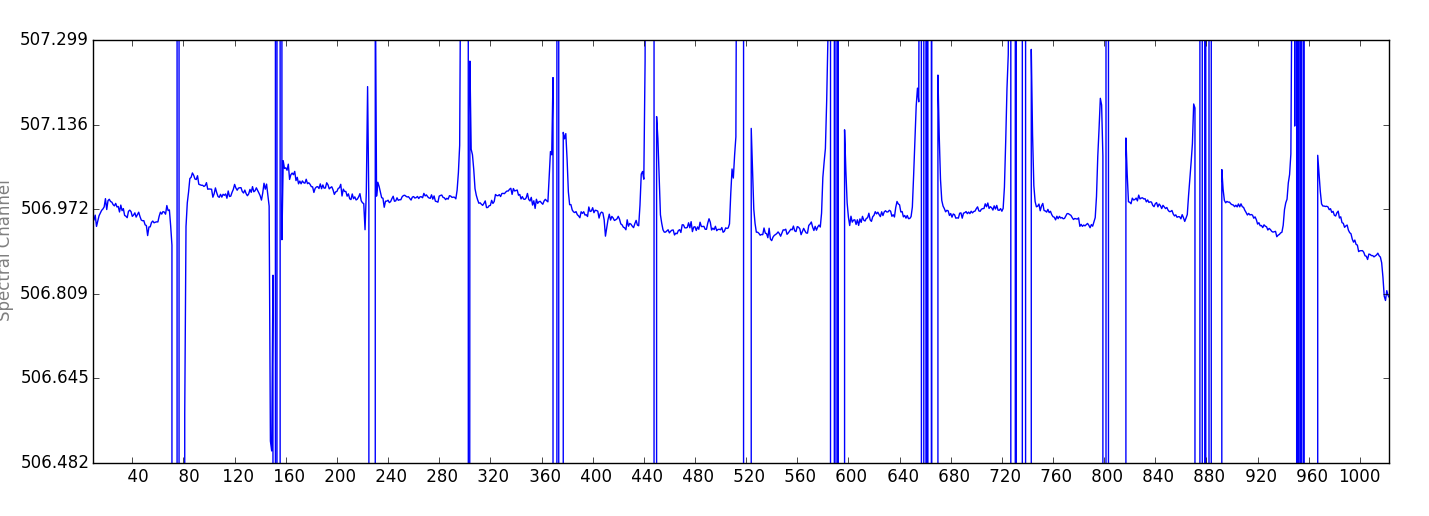
Again this is the mean image with slices thought the image at different wavelength pixels.
Figure 5
Same as figure 5 but zoomed to the bottom so you can see the darks between the tracks.
Figure 6
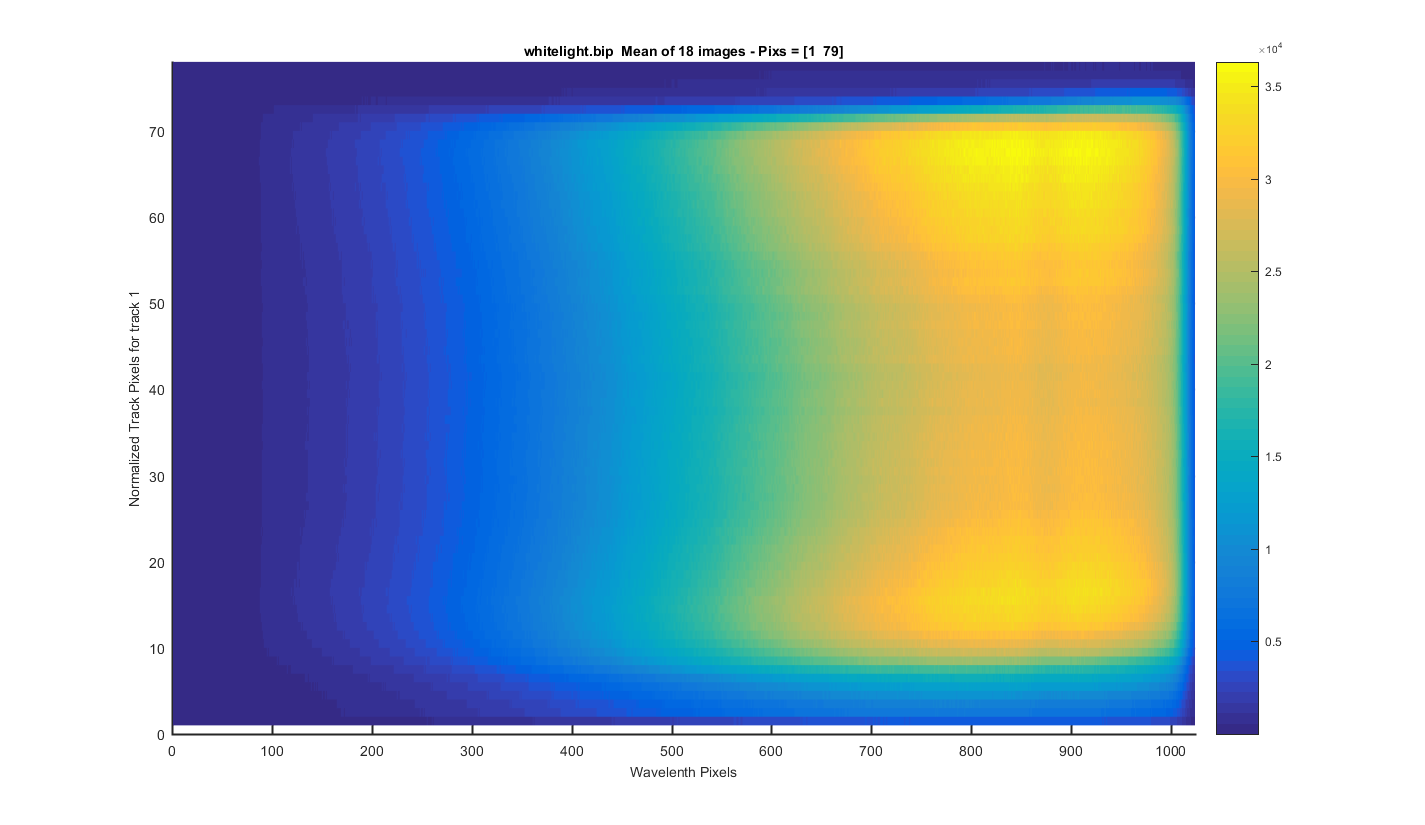
TRACK 1: The meaned image surface plot but for only one track so you can see each track zoomed in. The y-axis is the relative pixel for that track. The title contains the real pixels. I clicked to get these track positions so this will need to be refined in the future.
Figure 7
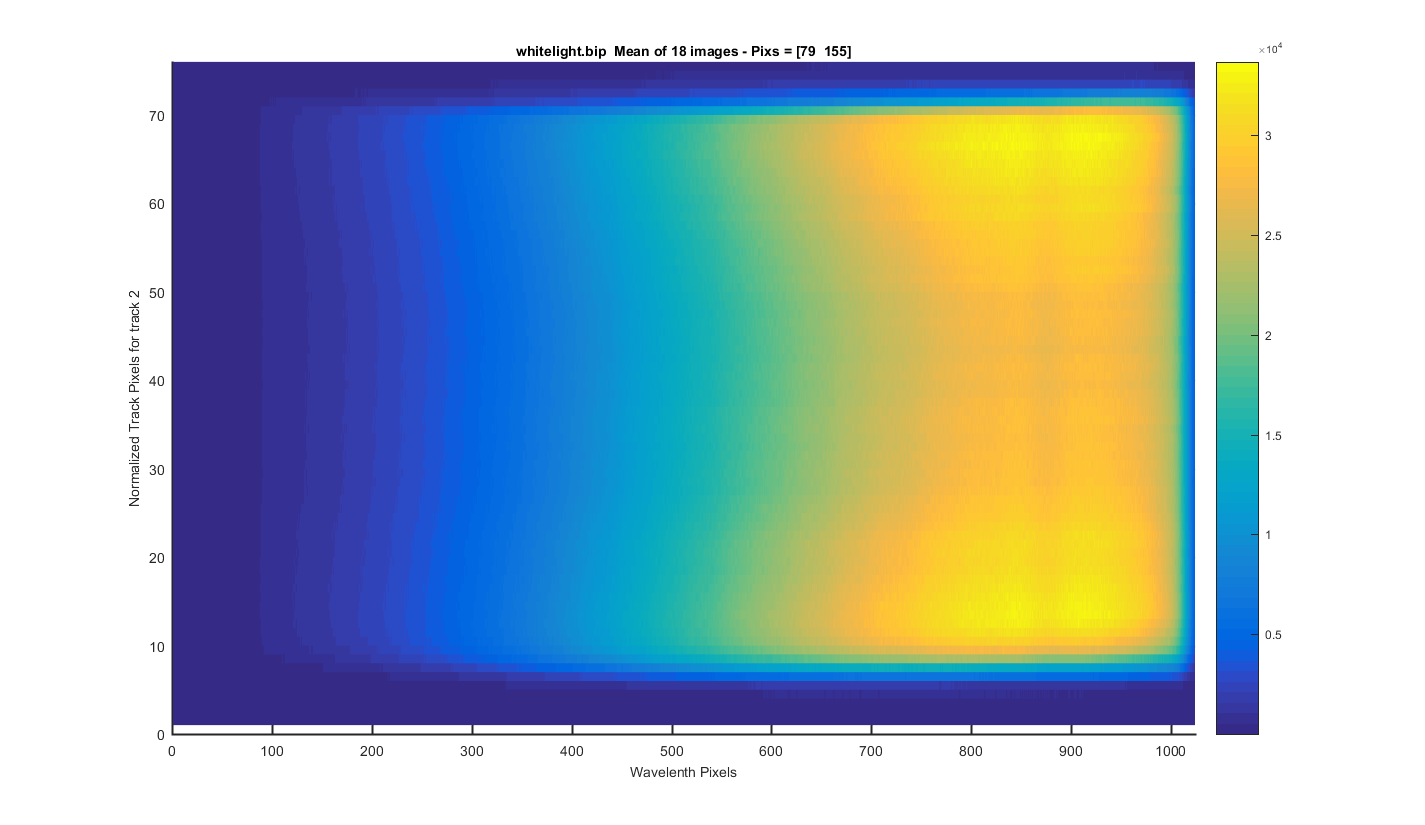
TRACK 2: The meaned image surface plot but for only one track so you can see each track zoomed in. The y-axis is the relative pixel for that track. The title contains the real pixels. I clicked to get these track positions so this will need to be refined in the future.
Figure 8
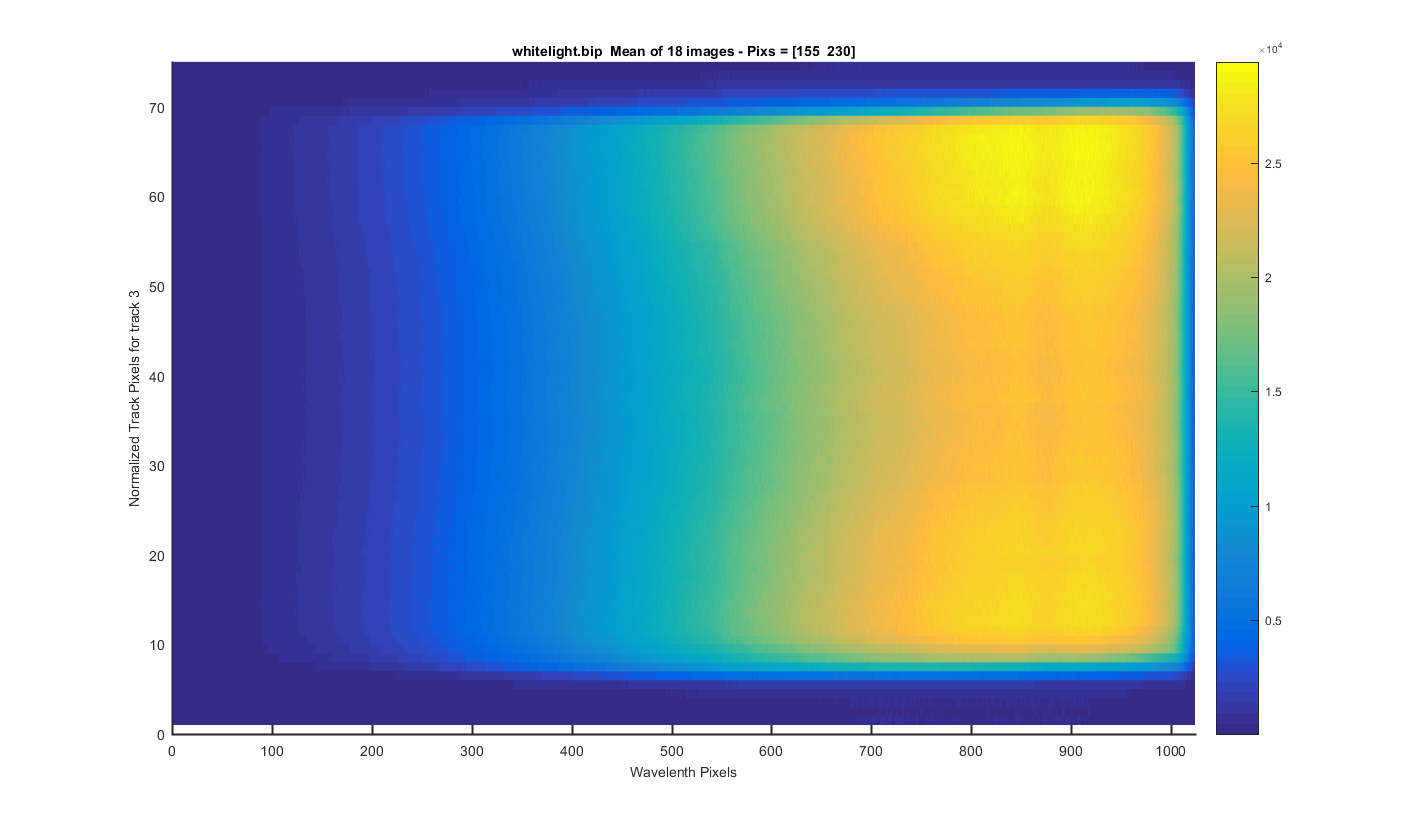
TRACK 3: The meaned image surface plot but for only one track so you can see each track zoomed in. The y-axis is the relative pixel for that track. The title contains the real pixels. I clicked to get these track positions so this will need to be refined in the future.
Figure 9
TRACK 4: The meaned image surface plot but for only one track so you can see each track zoomed in. The y-axis is the relative pixel for that track. The title contains the real pixels. I clicked to get these track positions so this will need to be refined in the future.
Note the line down the entore length of the track (around track pixel 23). Not sure what causes this?
Figure 10

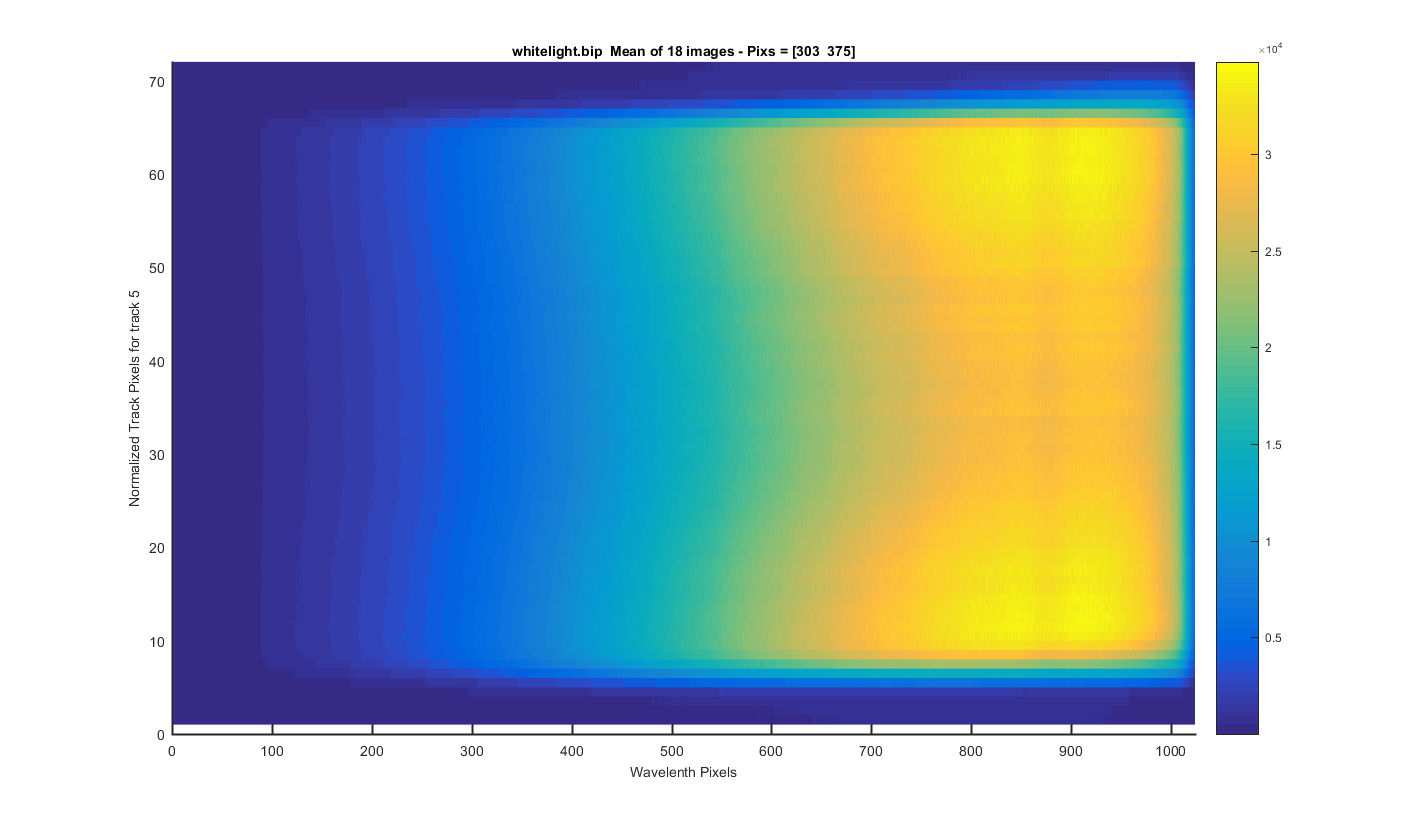
TRACK 5: The meaned image surface plot but for only one track so you can see each track zoomed in. The y-axis is the relative pixel for that track. The title contains the real pixels. I clicked to get these track positions so this will need to be refined in the future.
Figure 11
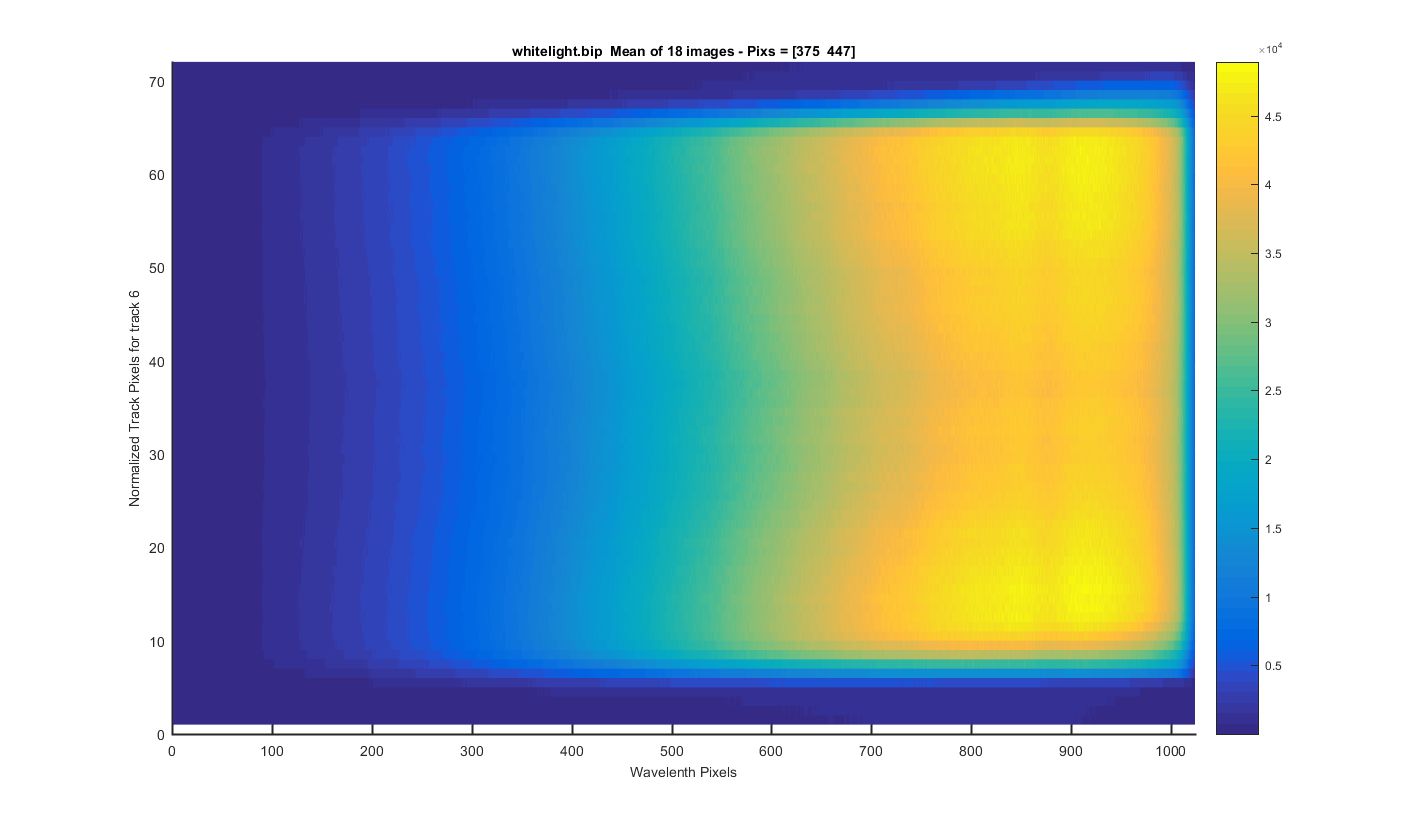
TRACK 6: The meaned image surface plot but for only one track so you can see each track zoomed in. The y-axis is the relative pixel for that track. The title contains the real pixels. I clicked to get these track positions so this will need to be refined in the future.
Figure 12
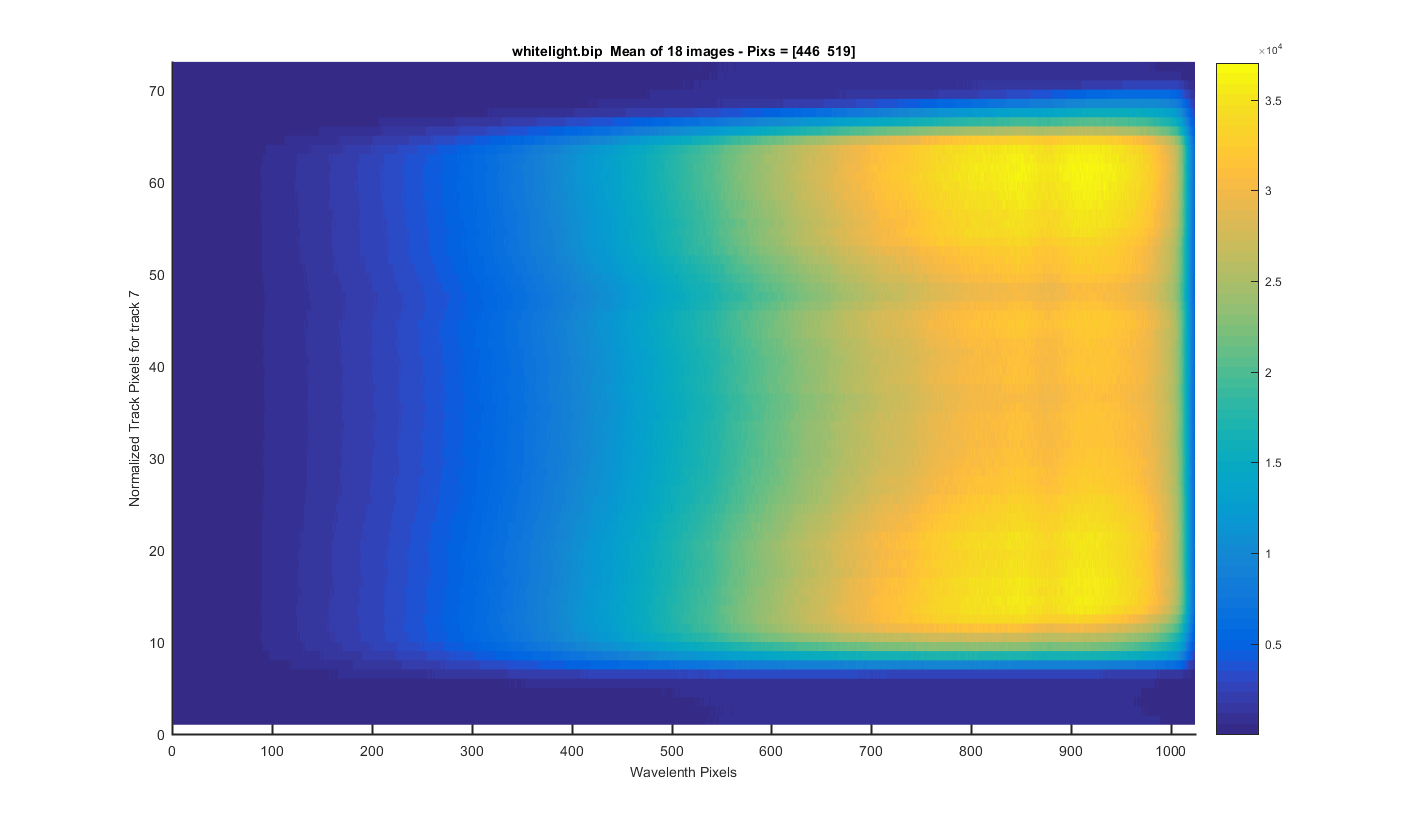
TRACK 7: The meaned image surface plot but for only one track so you can see each track zoomed in. The y-axis is the relative pixel for that track. The title contains the real pixels. I clicked to get these track positions so this will need to be refined in the future.
There may be a line here too , like the one in track 4.
Figure 13
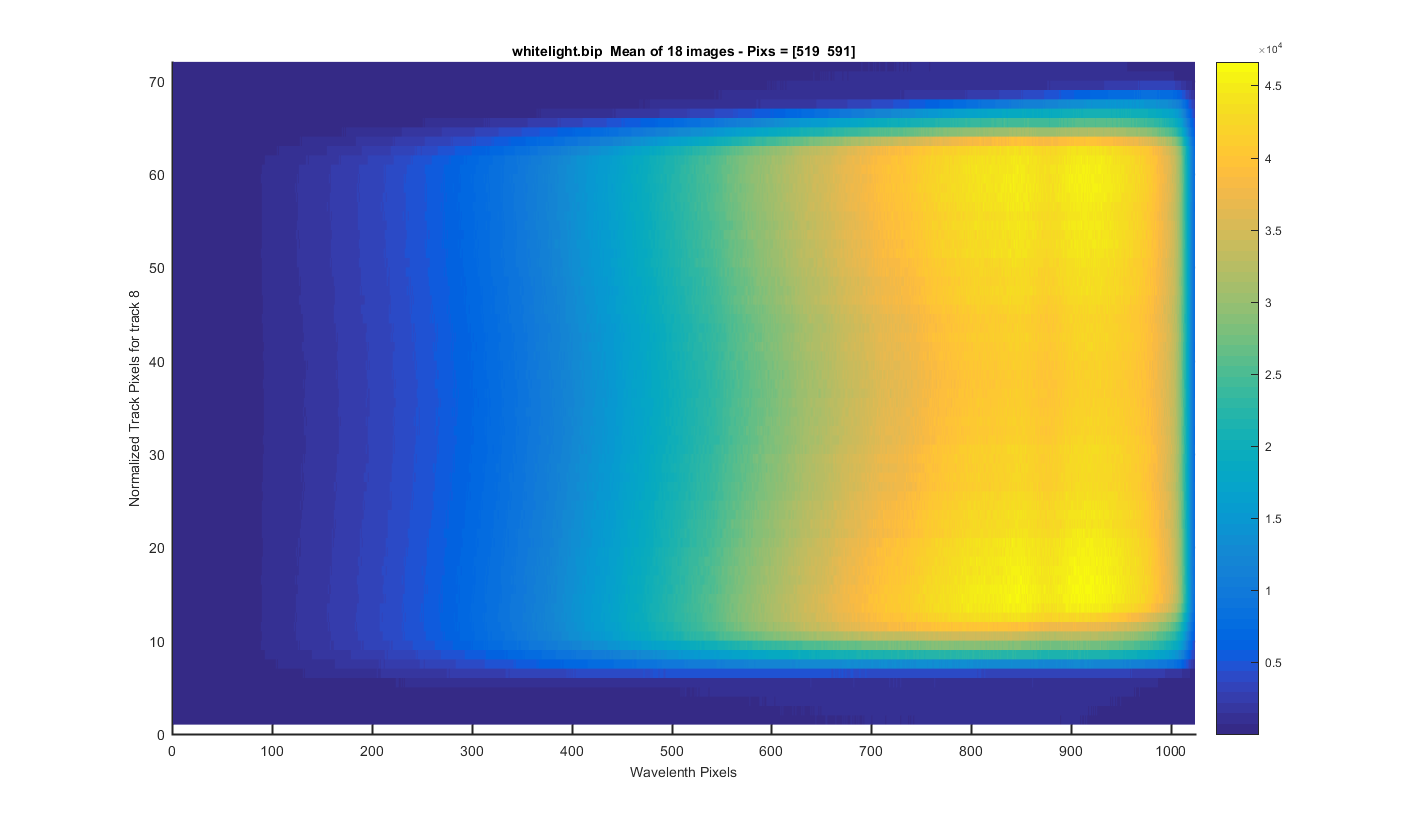
TRACK 8: The meaned image surface plot but for only one track so you can see each track zoomed in. The y-axis is the relative pixel for that track. The title contains the real pixels. I clicked to get these track positions so this will need to be refined in the future.
Figure 14
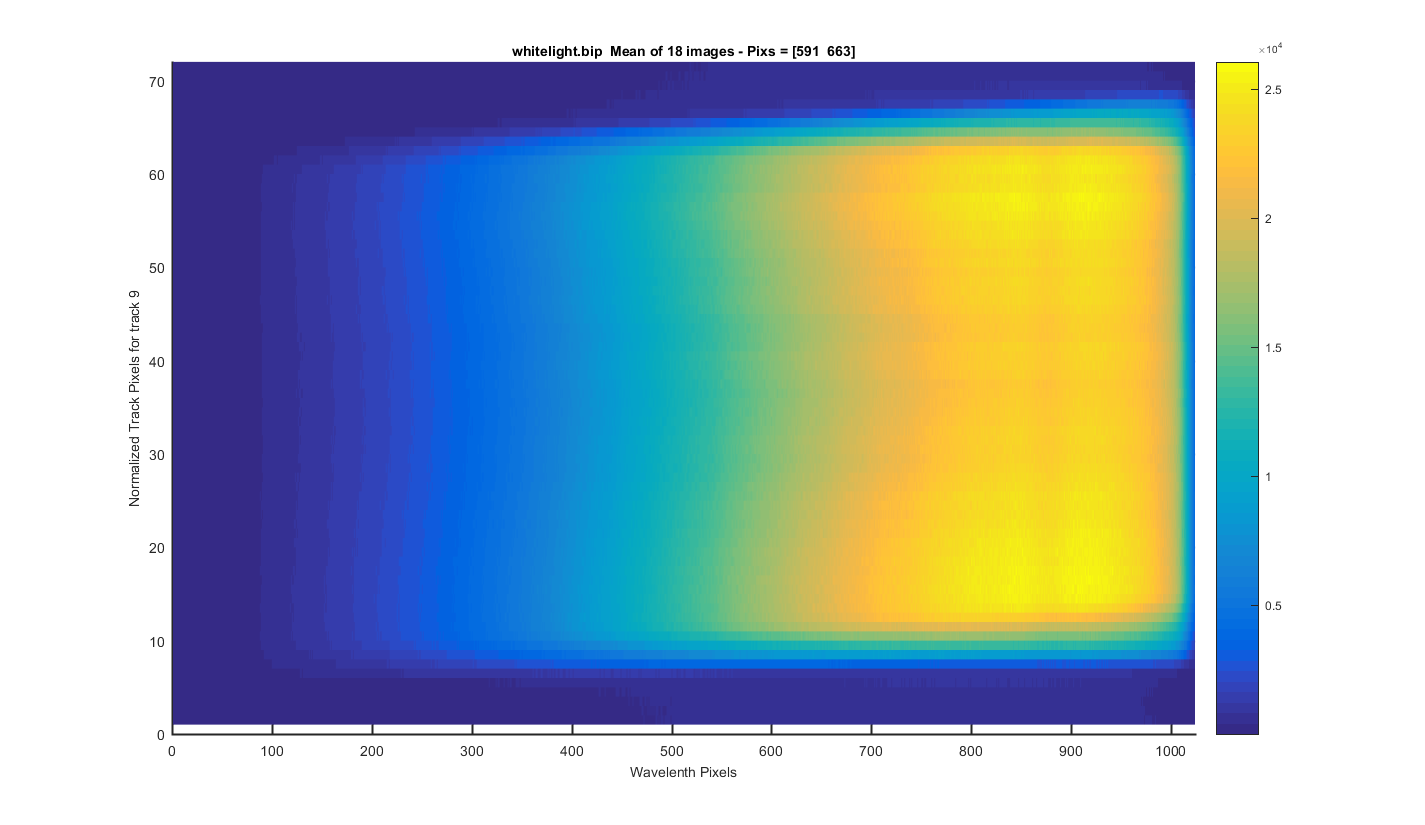
TRACK 9: The meaned image surface plot but for only one track so you can see each track zoomed in. The y-axis is the relative pixel for that track. The title contains the real pixels. I clicked to get these track positions so this will need to be refined in the future.
Figure 15
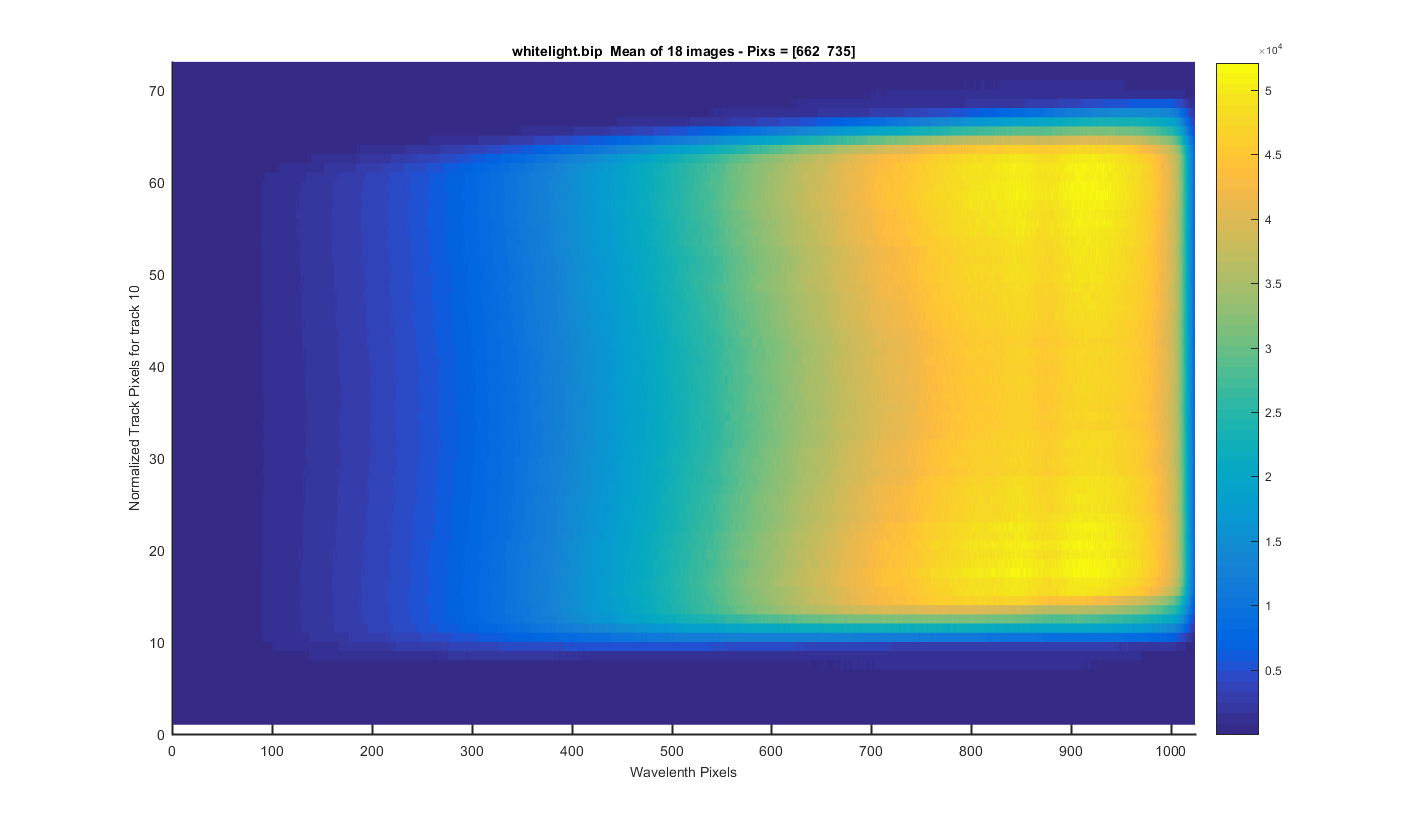
TRACK 10: The meaned image surface plot but for only one track so you can see each track zoomed in. The y-axis is the relative pixel for that track. The title contains the real pixels. I clicked to get these track positions so this will need to be refined in the future.
Figure 16
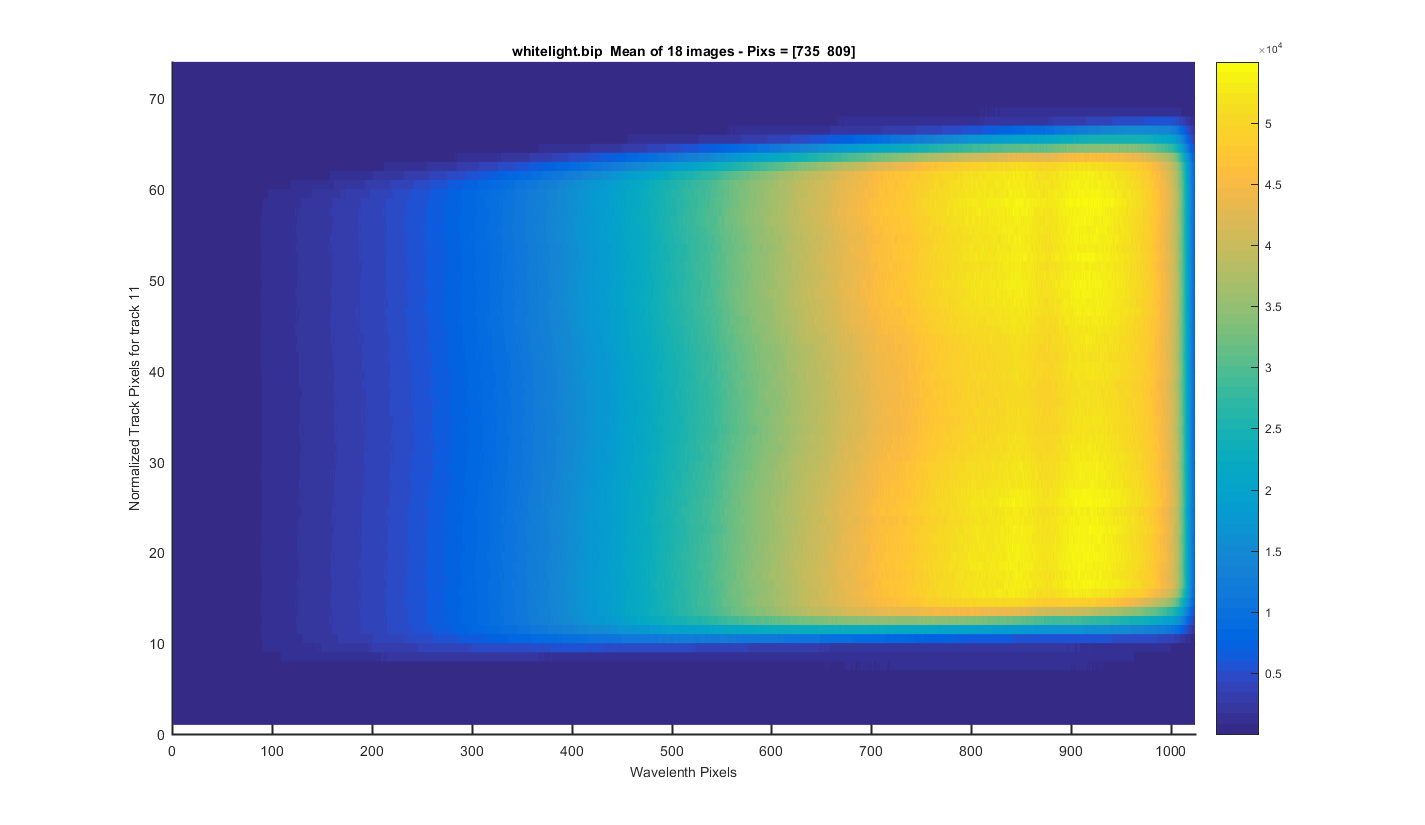
TRACK 11: The meaned image surface plot but for only one track so you can see each track zoomed in. The y-axis is the relative pixel for that track. The title contains the real pixels. I clicked to get these track positions so this will need to be refined in the future.
Figure 17
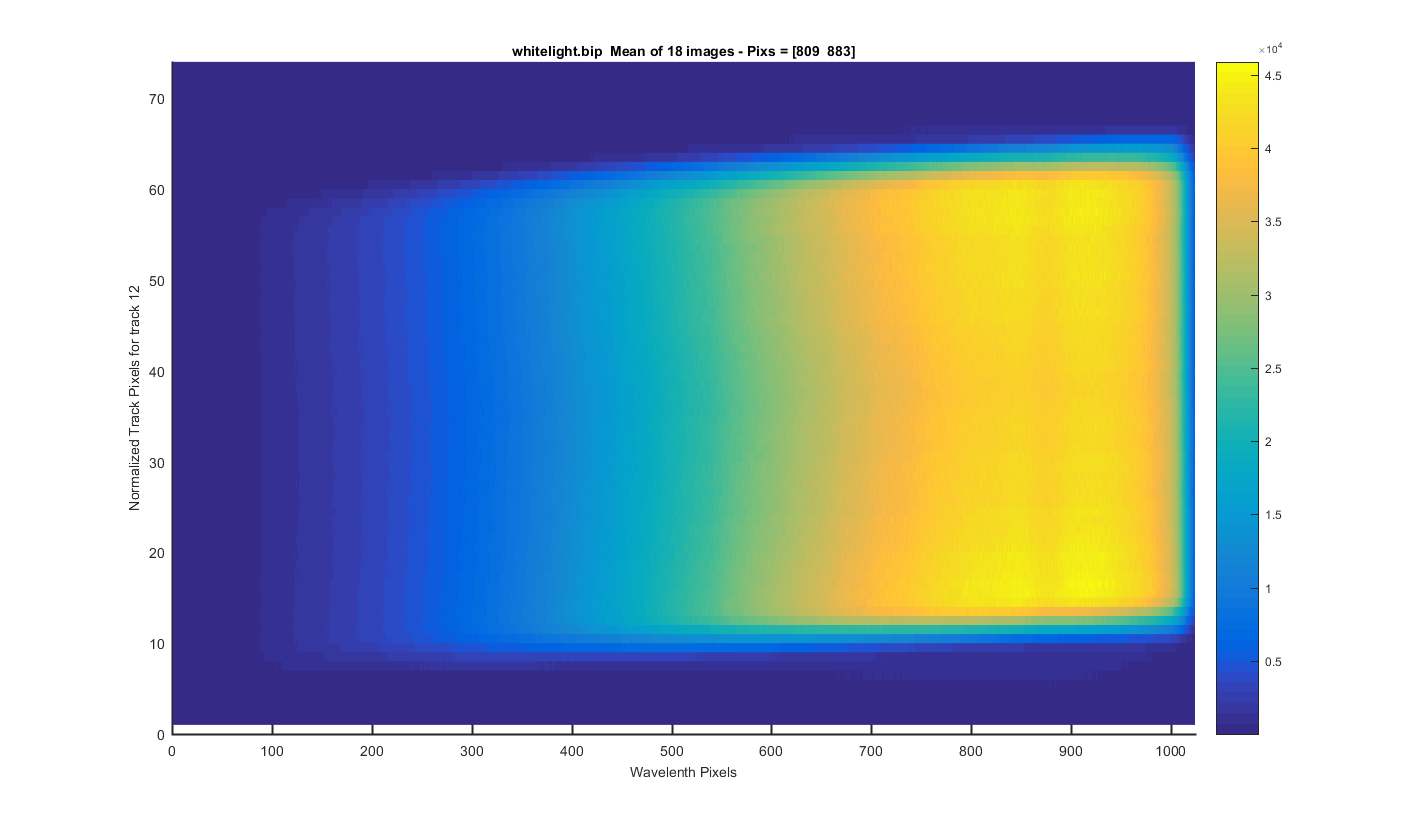
TRACK 12: The meaned image surface plot but for only one track so you can see each track zoomed in. The y-axis is the relative pixel for that track. The title contains the real pixels. I clicked to get these track positions so this will need to be refined in the future.
Figure 18
TRACK 13: The meaned image surface plot but for only one track so you can see each track zoomed in. The y-axis is the relative pixel for that track. The title contains the real pixels. I clicked to get these track positions so this will need to be refined in the future.
Figure 19

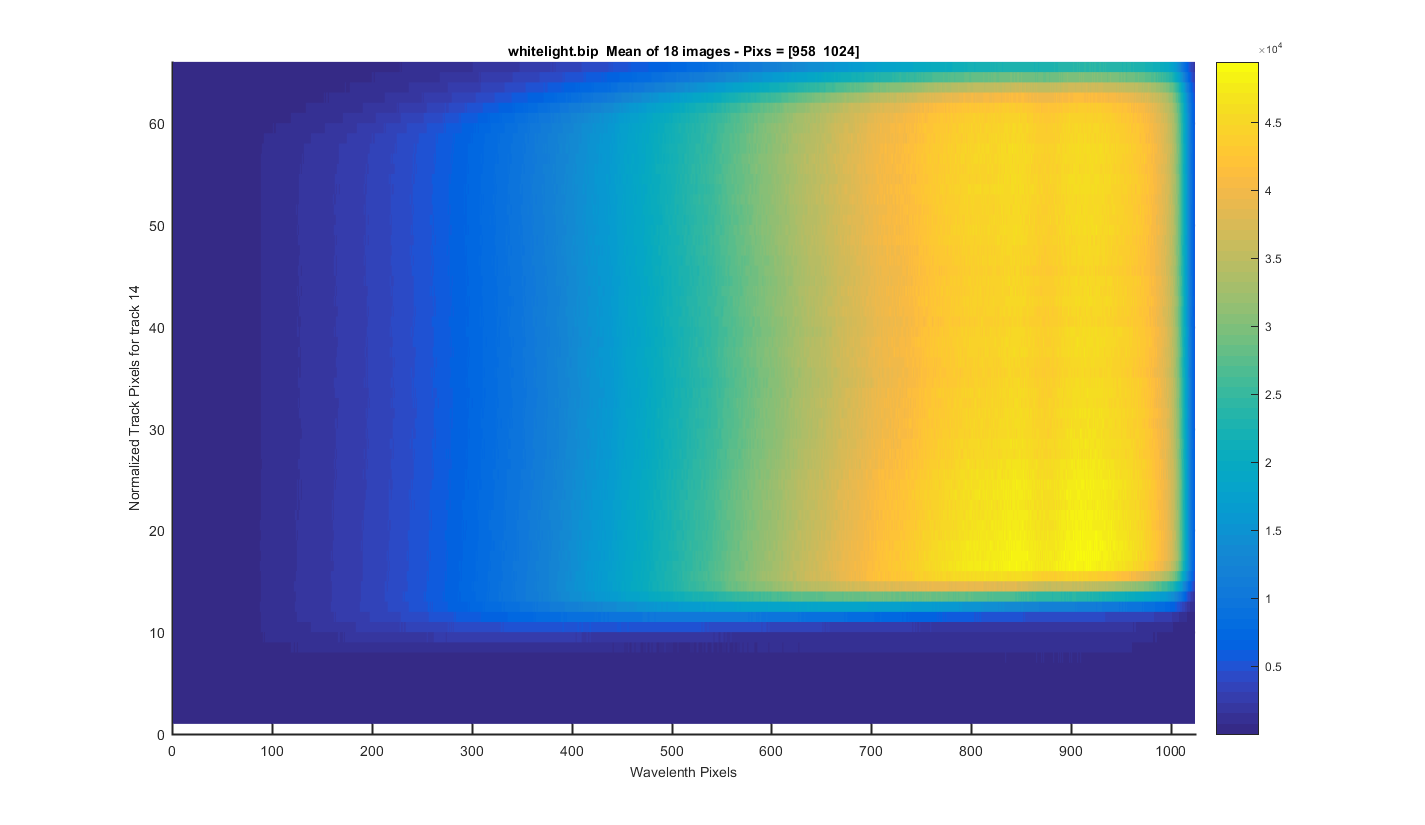
TRACK 14: The meaned image surface plot but for only one track so you can see each track zoomed in. The y-axis is the relative pixel for that track. The title contains the real pixels. I clicked to get these track positions so this will need to be refined in the future.
Figure 20