REVISION DATE: 18-Apr-2016 17:50:49
Email from Mike Kehoe on 4/15/2016 3:08 PM:

Greetings All,

Casey has finished aligning RS2.  Please find his preliminary report attached.   Test data is available at the usual site:

-Mike
Below are my graphs of the sphere100ms.bip file. The file contains 30 dark images at 0.1 sec Note some graphs are dark corrected and some are not so check the axis labels to know what you are looking at.
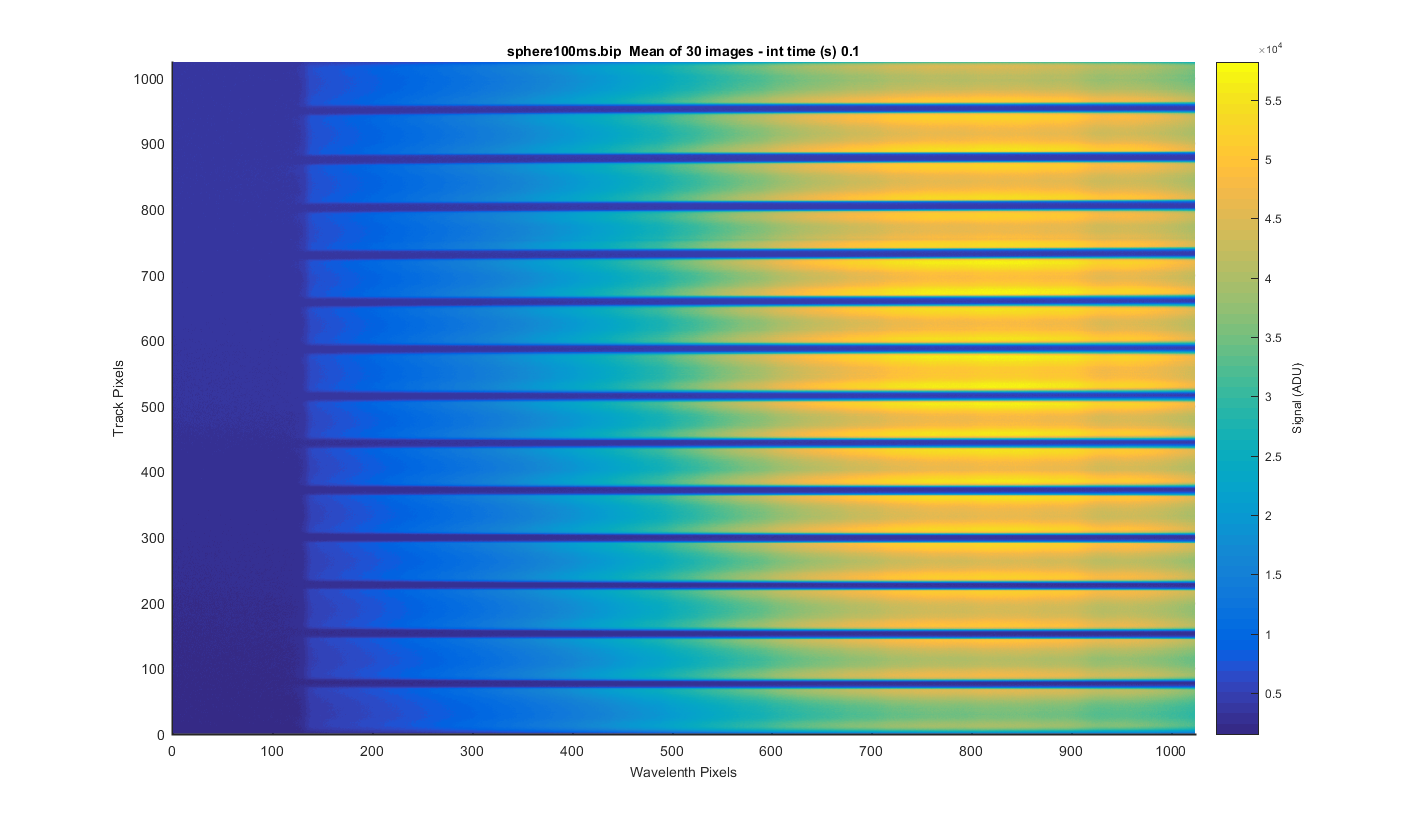
I took the 30 images and meaned them to get the surface plot below.
Figure 1
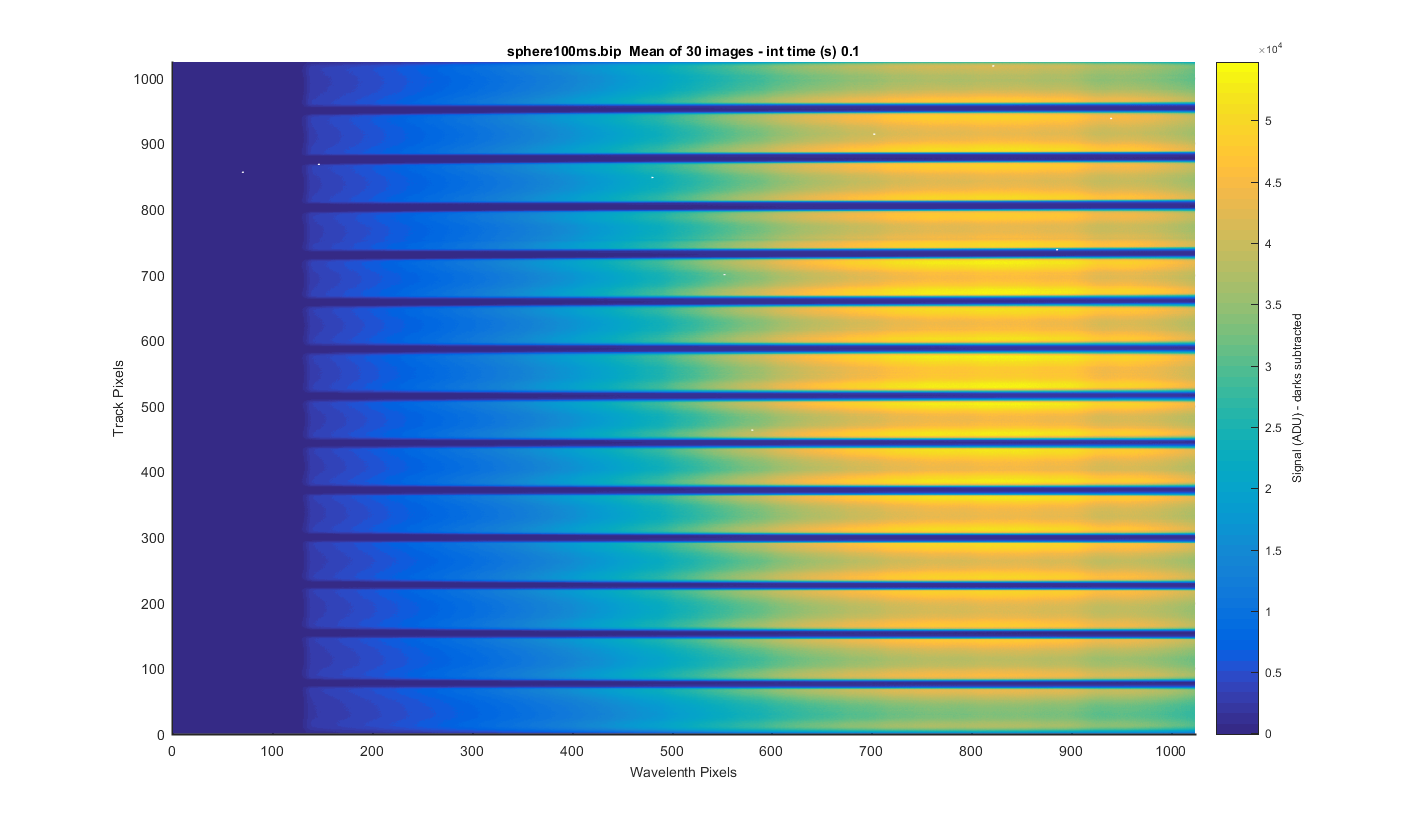
Same as the previous images but with the dark image subtracted. The little white dots are where there where spiked in the darks which where set to NaN.
Figure 2
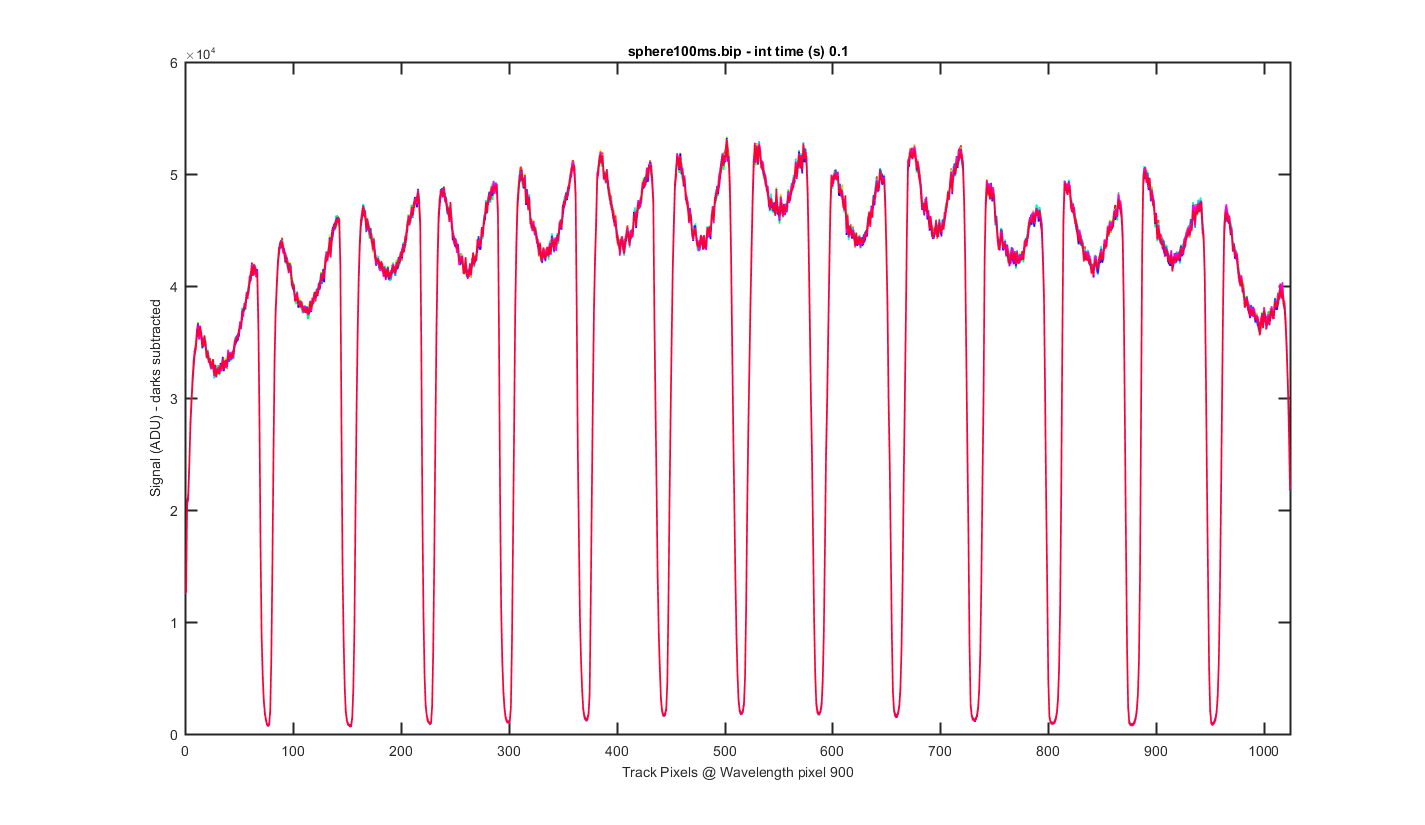
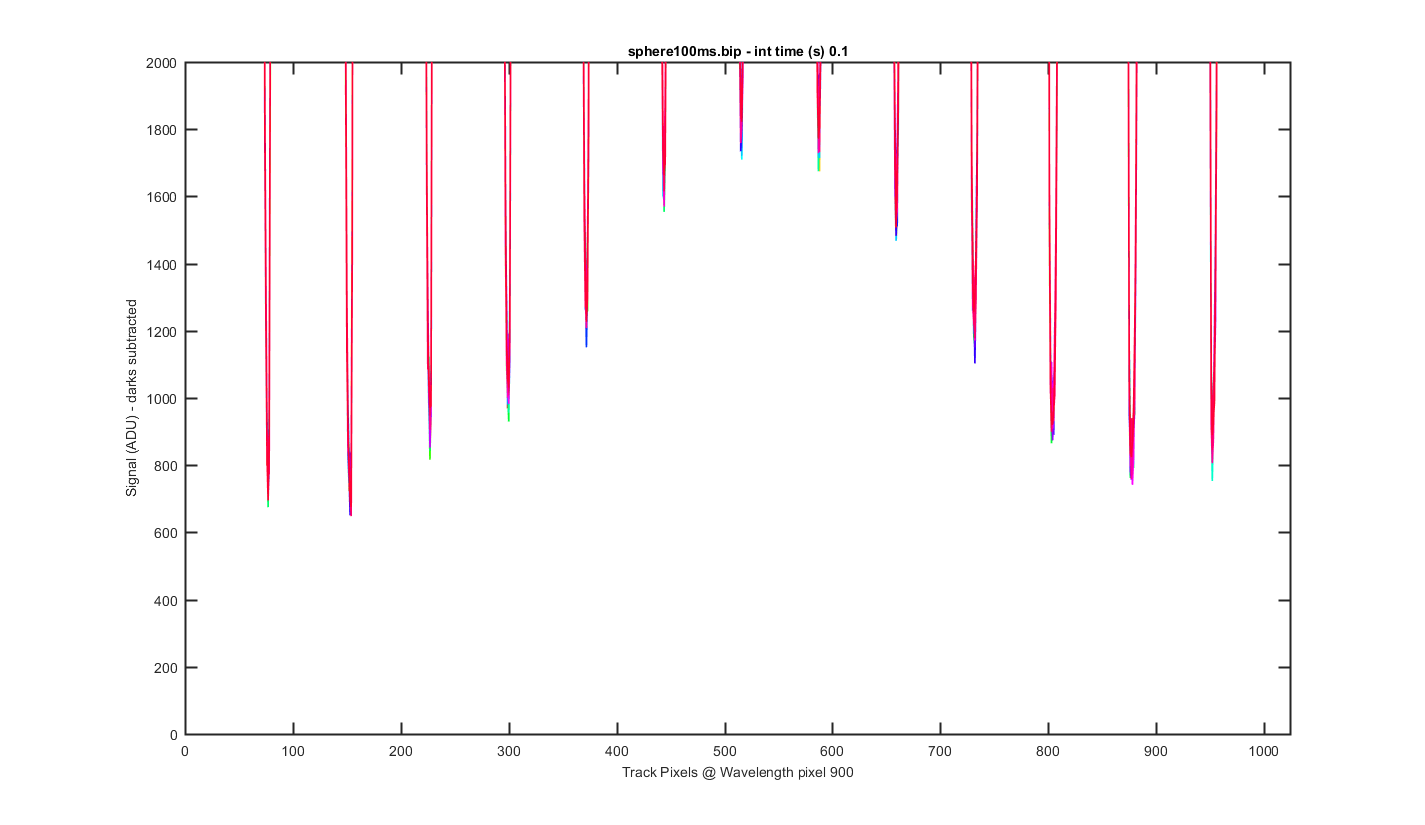
This is a cross section through the tracks at wavelength pixel 900, with one line for each of the 30 images (darks are subtracted).
Figure 3
Same as the previous graph but zoomed into the bottom to see the level of the darks between the tracks.
Figure 4
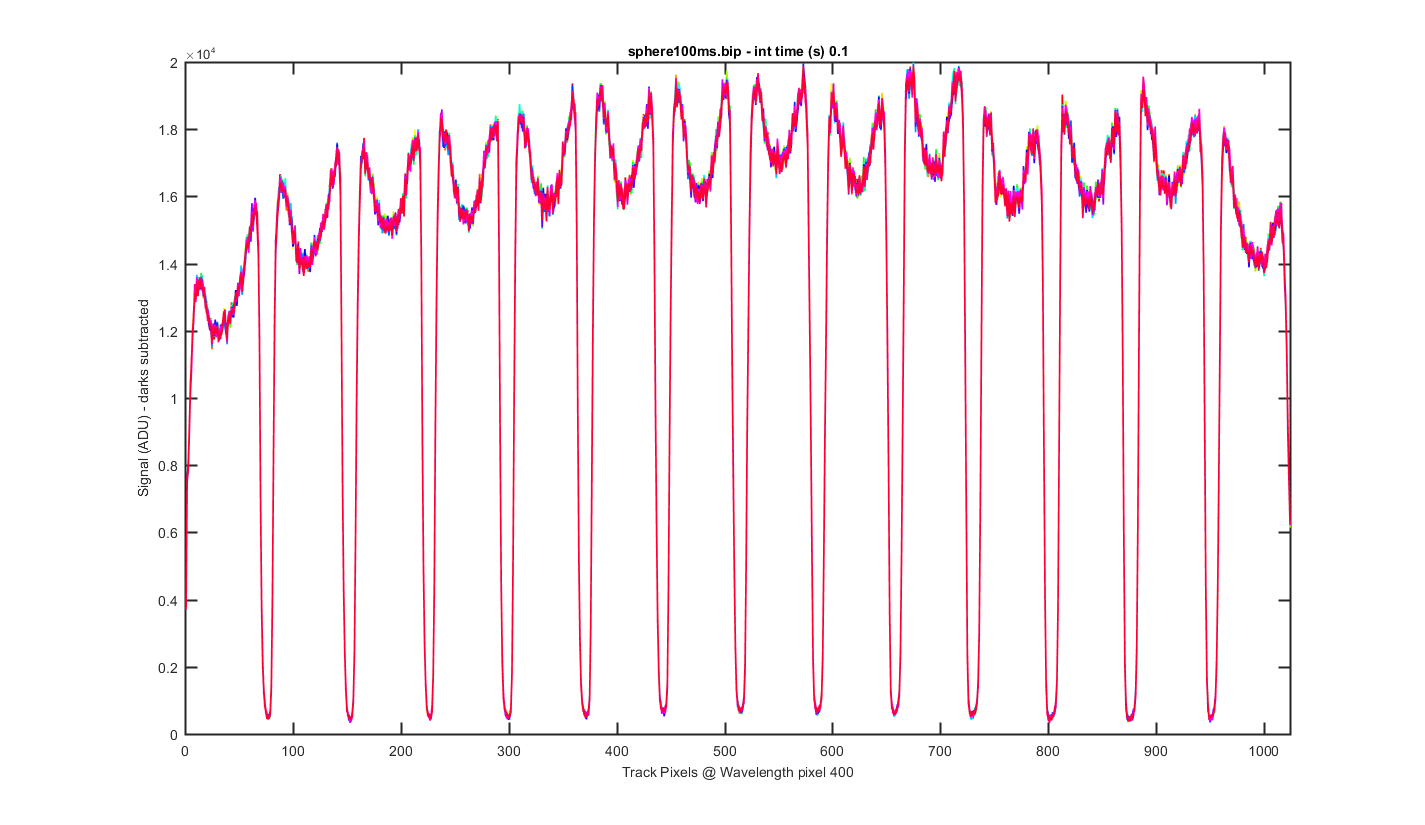
Same as figure 2 but for Wavelength pixel 400 (darks are subtracted)
Figure 5
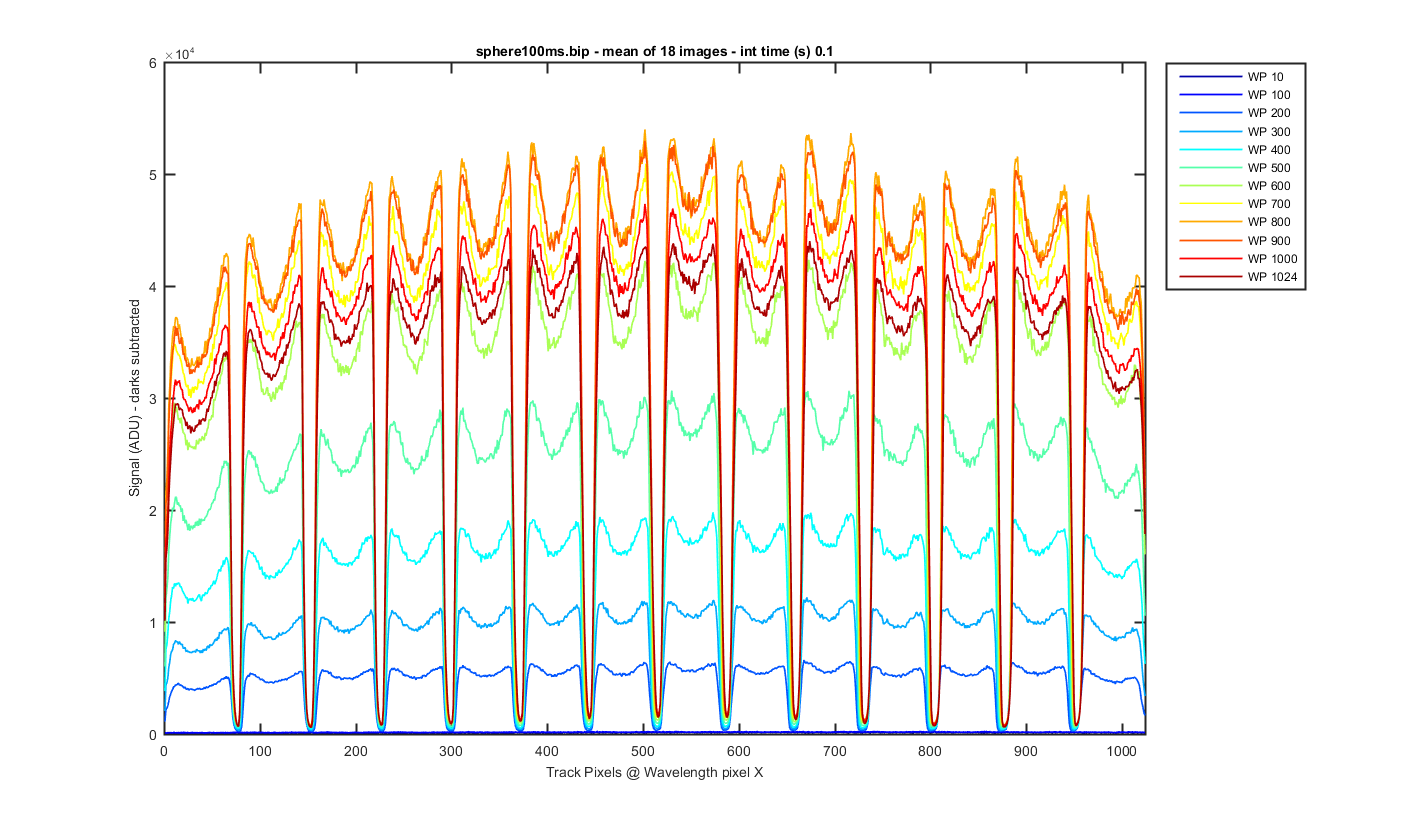
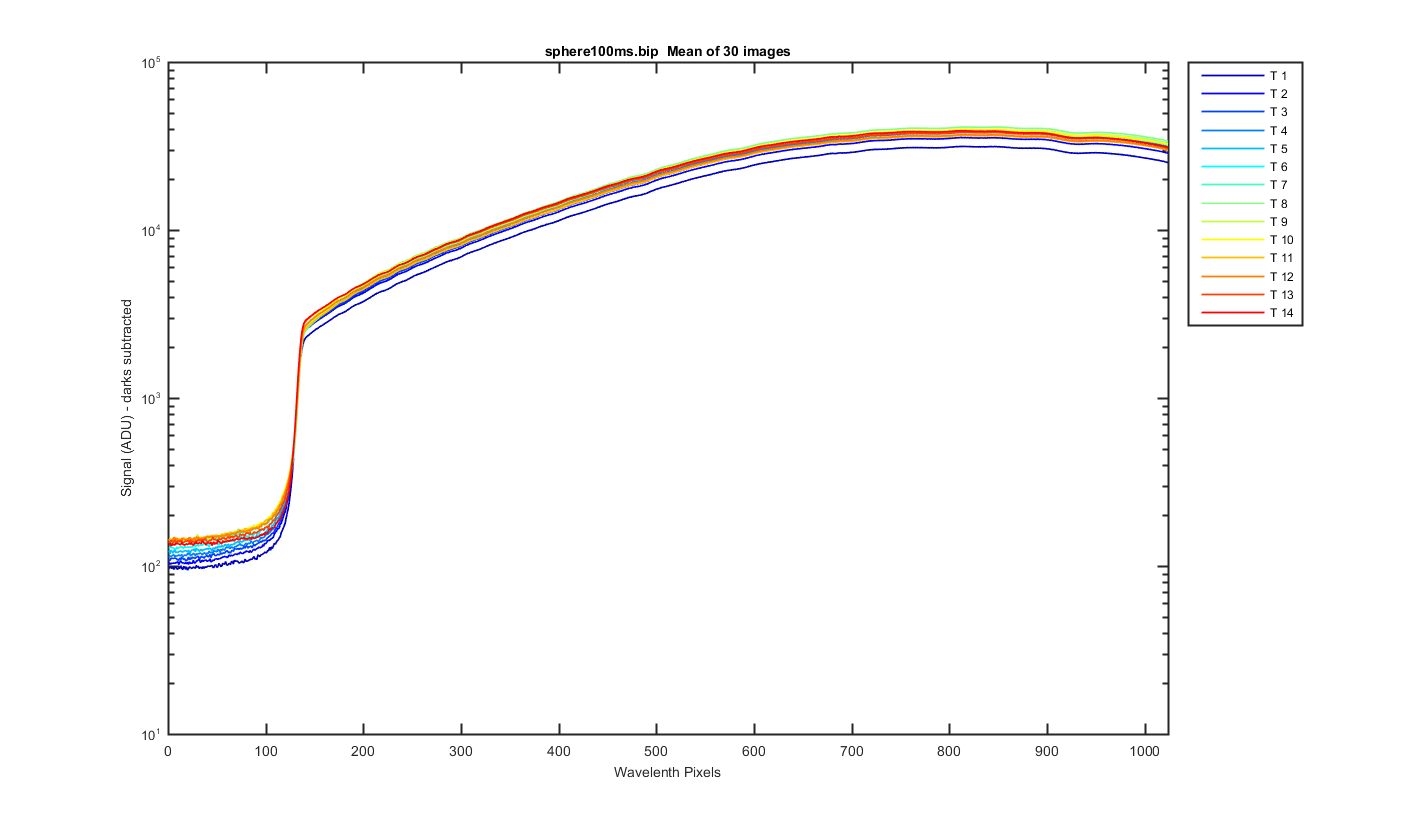
Again this is the mean image with slices thought the image at different wavelength pixels (darks are subtracted).
Figure 6
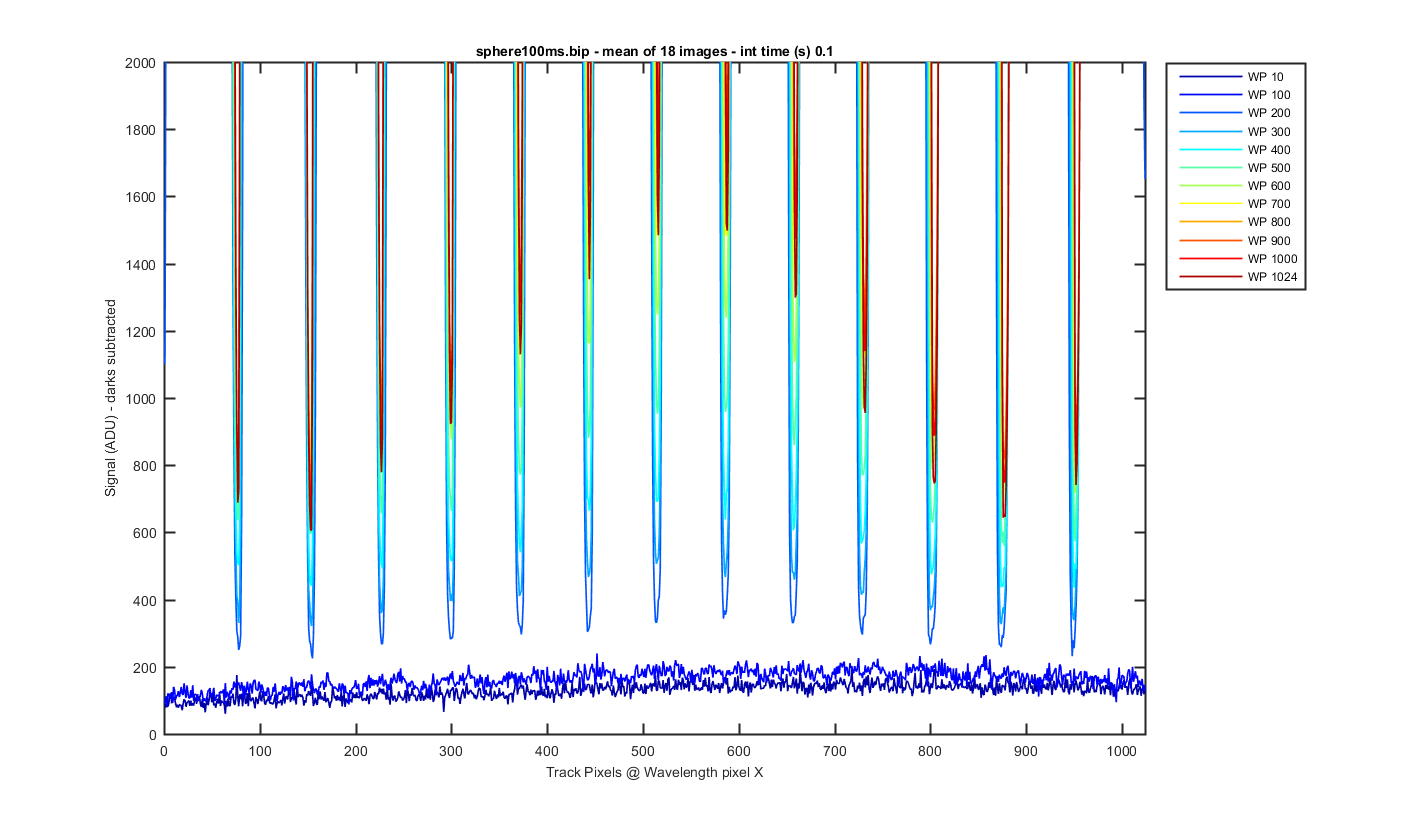
Same as figure 6 but zoomed to the bottom so you can see the darks between the tracks (darks are subtracted).
Figure 7
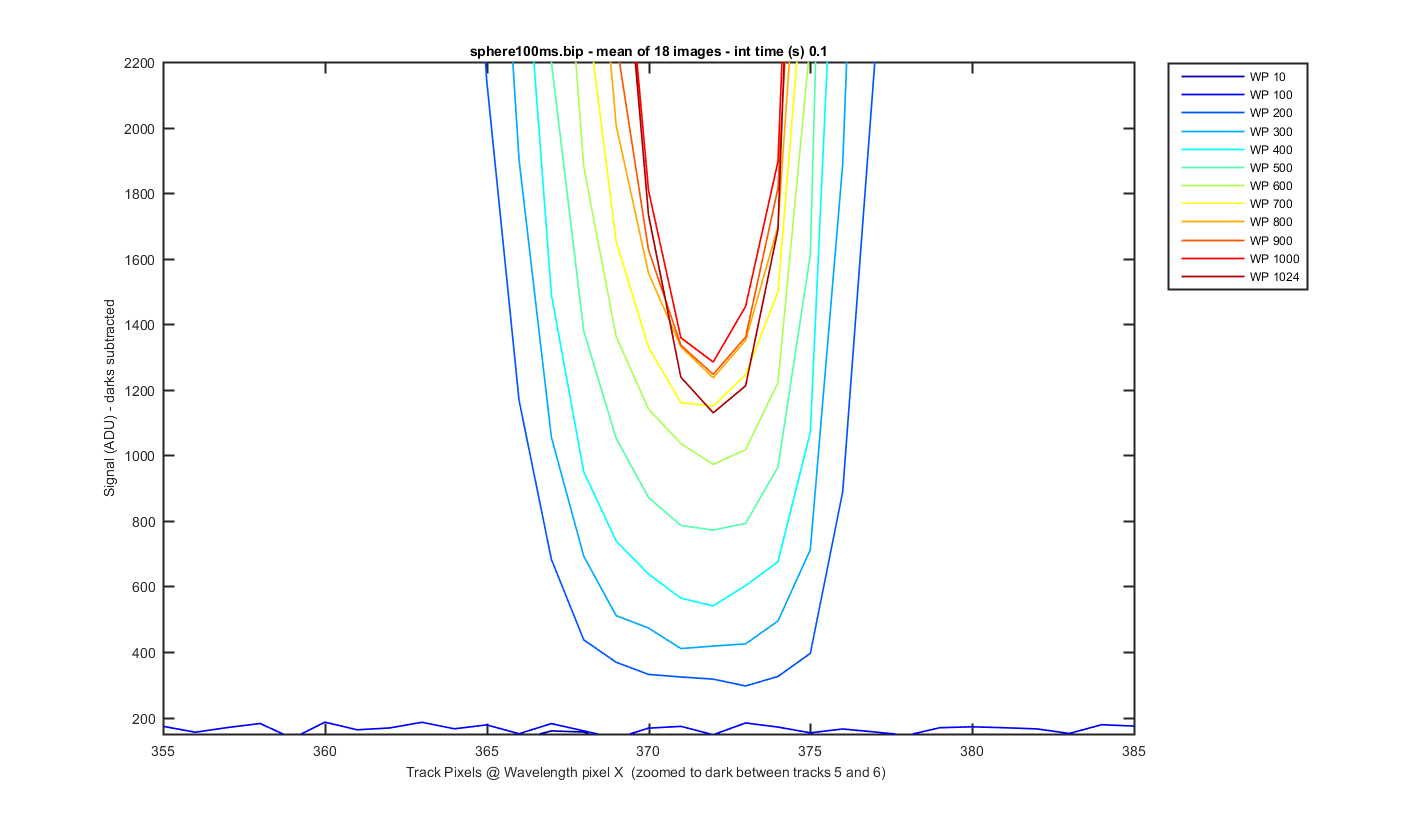
Same as figure 7 but zoomed into the dark area between tracks 5 and 6 so you can see the amount of light getting between the tracks (darks are subtracted). It varies by wavelength.
Figure 8
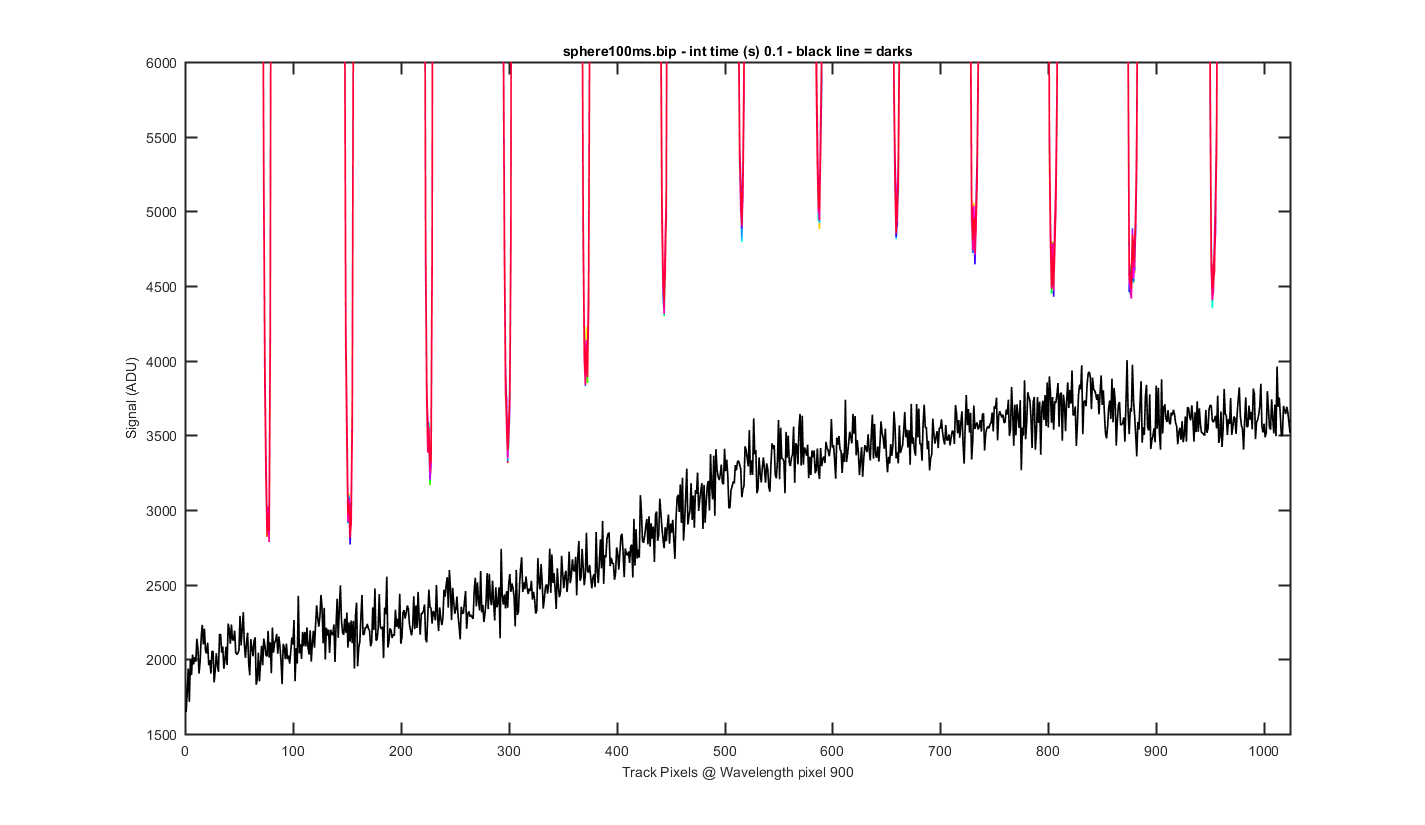
The same cross track plots but zoomed to the bottom and not dark corrected with the dark plotted at a black line (wavelength pixel 900).
Figure 9
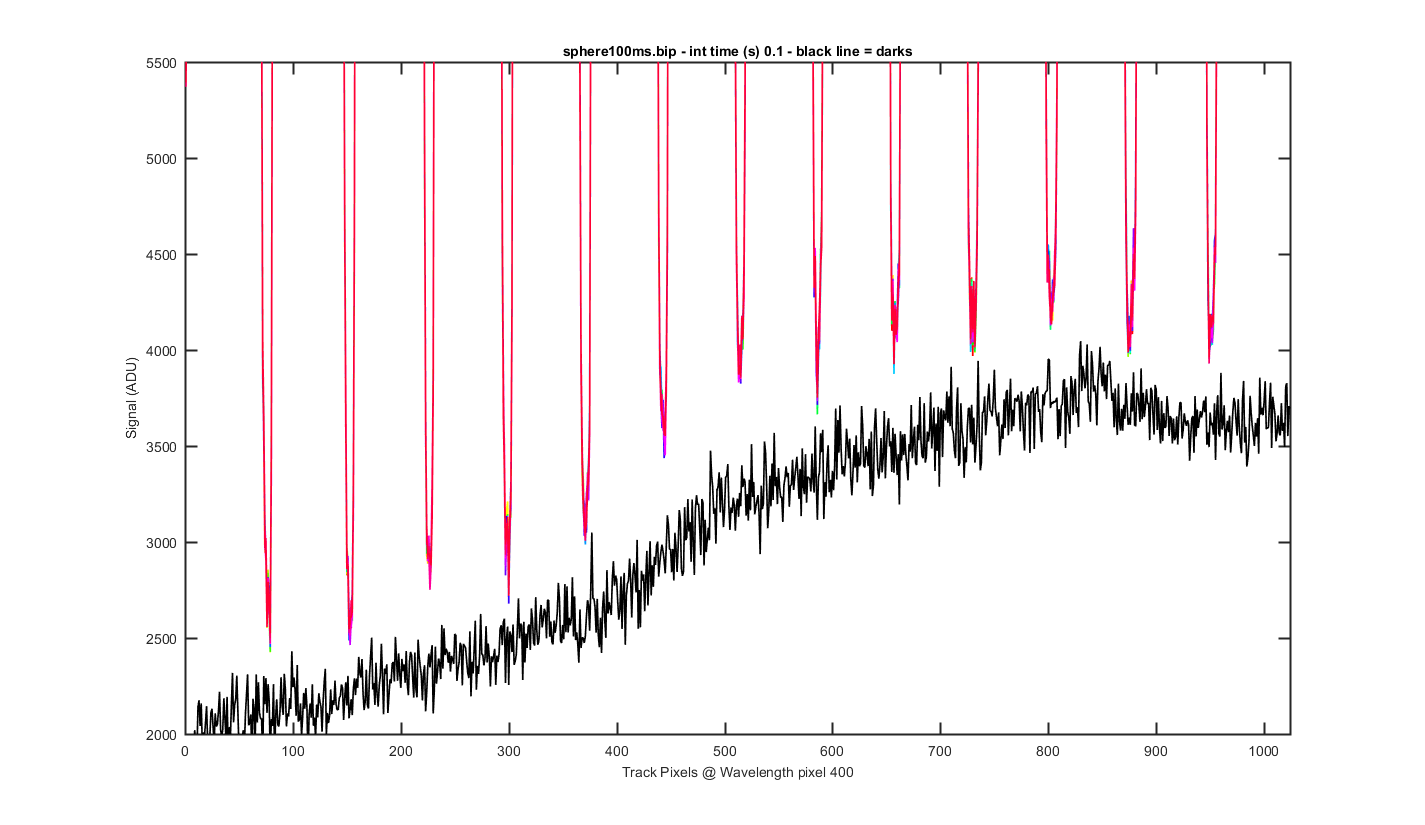
The same cross track plots but zoomed to the bottom and not dark corrected with the dark plotted at a black line (wavelength pixel 400).
Figure 10
Track data which is dark subtracted
Figure 11
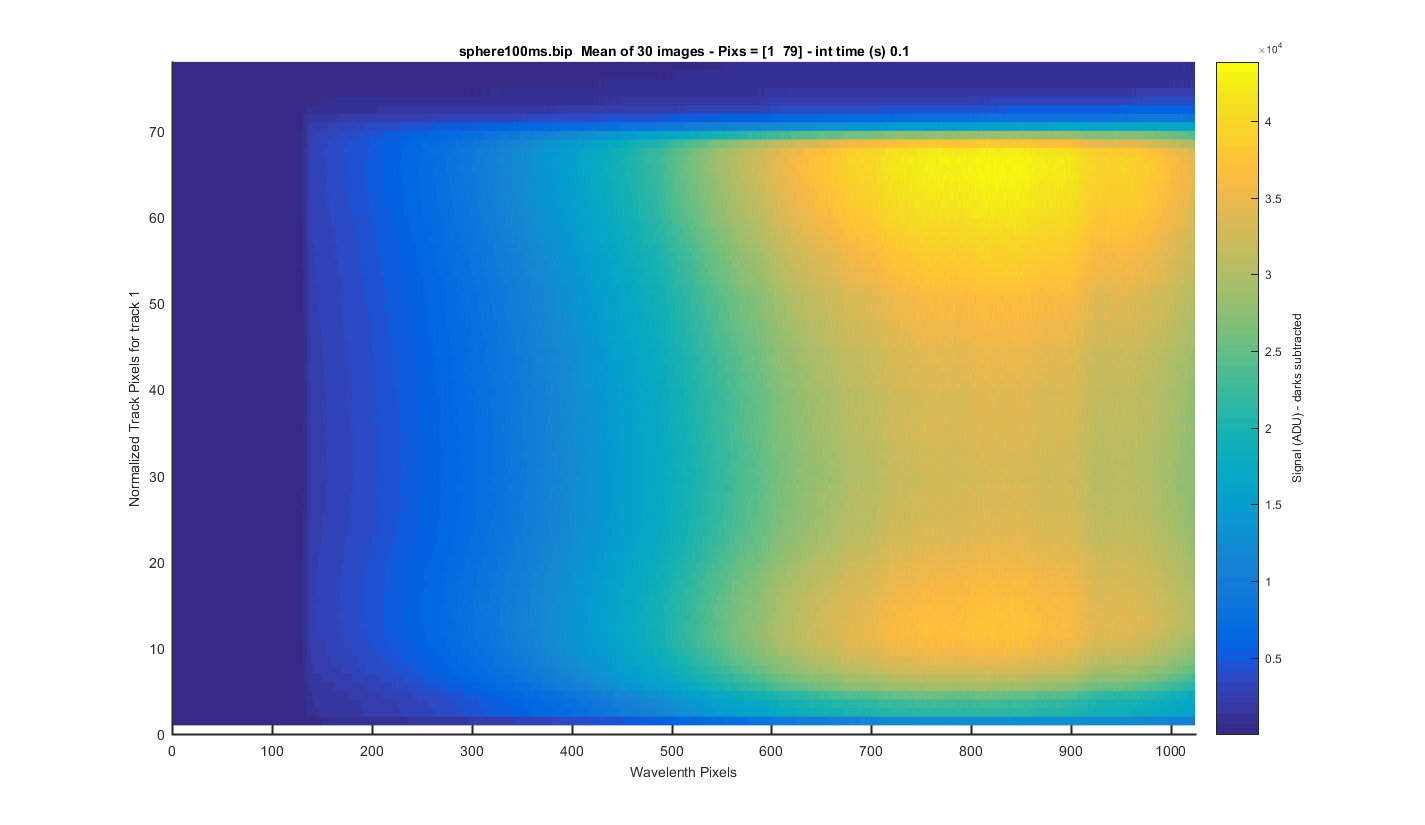
TRACK 1: The meaned image (darks are subtracted) surface plot but for only one track so you can see each track zoomed in. The y-axis is the relative pixel for that track. The title contains the real pixels. I clicked to get these track positions so this will need to be refined in the future.
Figure 12
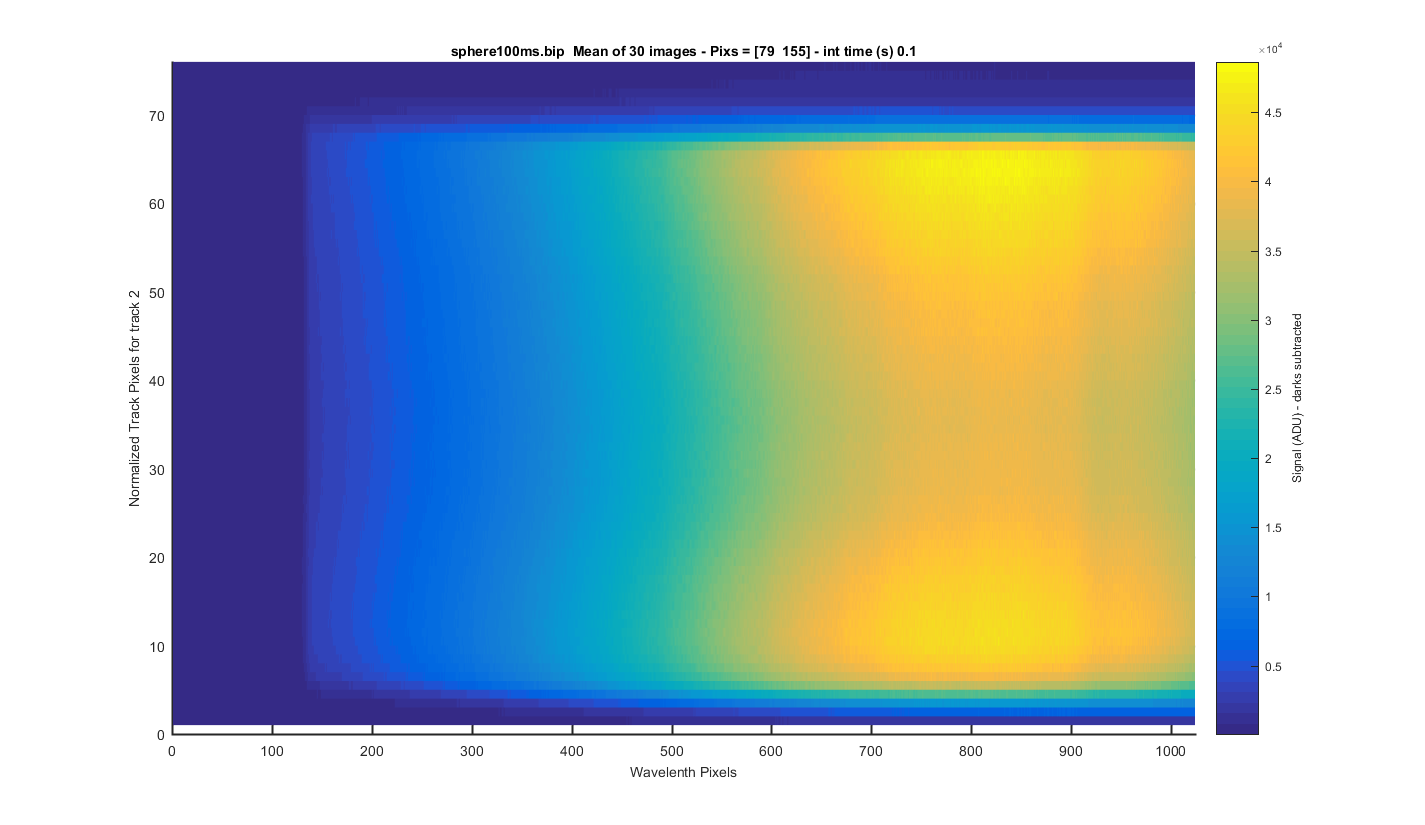
TRACK 2: The meaned image (darks are subtracted) surface plot but for only one track so you can see each track zoomed in. The y-axis is the relative pixel for that track. The title contains the real pixels. I clicked to get these track positions so this will need to be refined in the future.
Figure 13
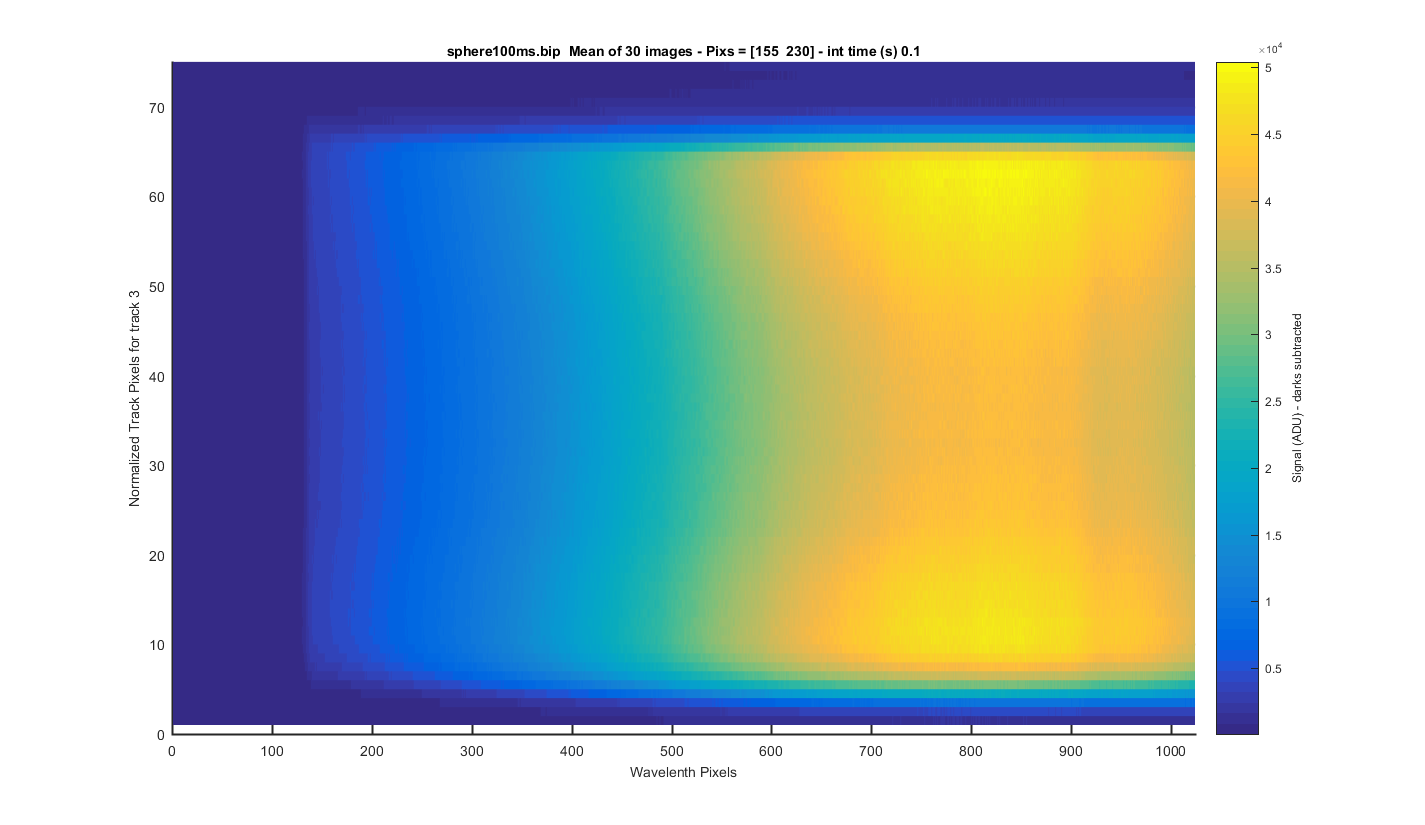
TRACK 3: The meaned image (darks are subtracted) surface plot but for only one track so you can see each track zoomed in. The y-axis is the relative pixel for that track. The title contains the real pixels. I clicked to get these track positions so this will need to be refined in the future.
Figure 14
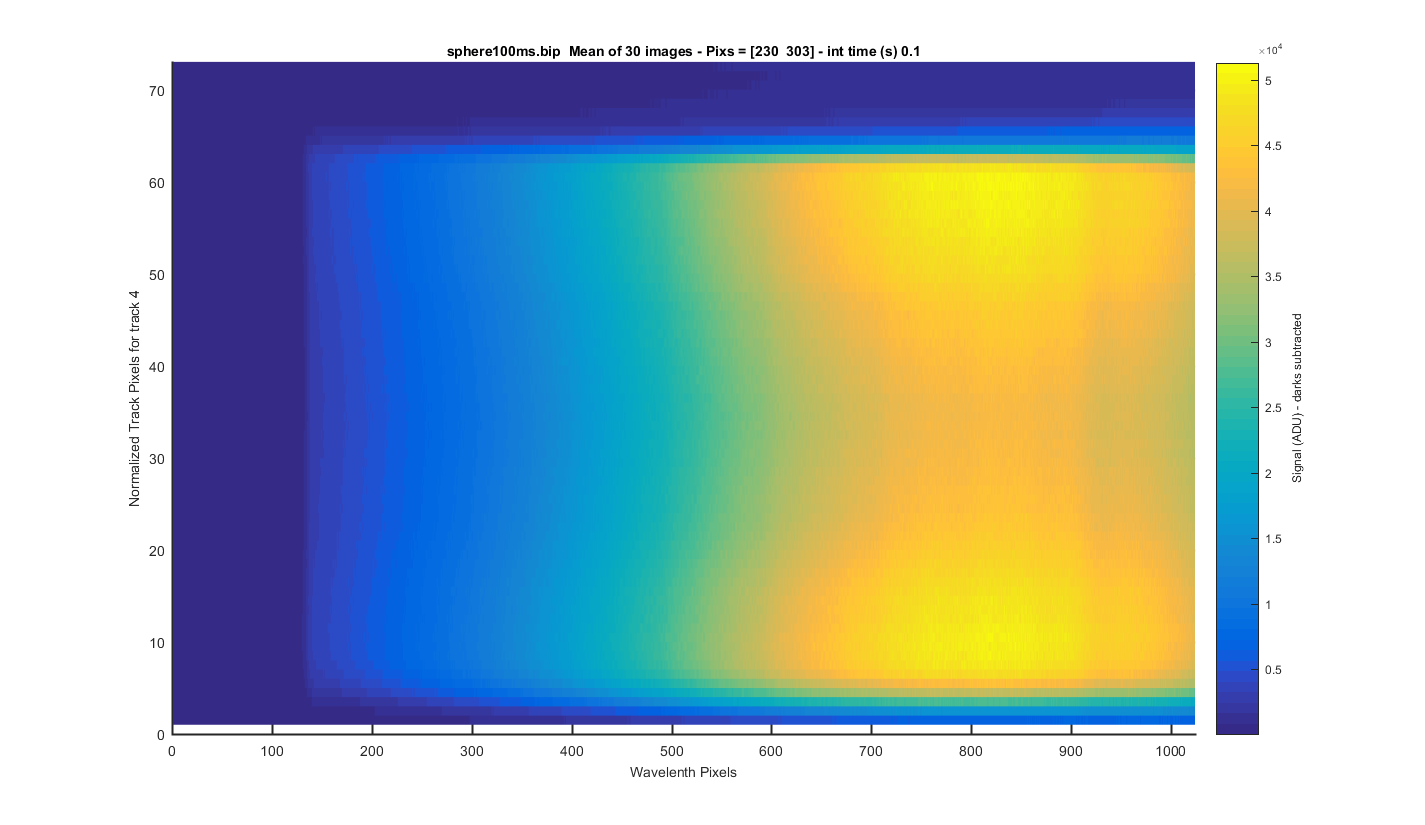
TRACK 4: The meaned image (darks are subtracted) surface plot but for only one track so you can see each track zoomed in. The y-axis is the relative pixel for that track. The title contains the real pixels. I clicked to get these track positions so this will need to be refined in the future.
Figure 15
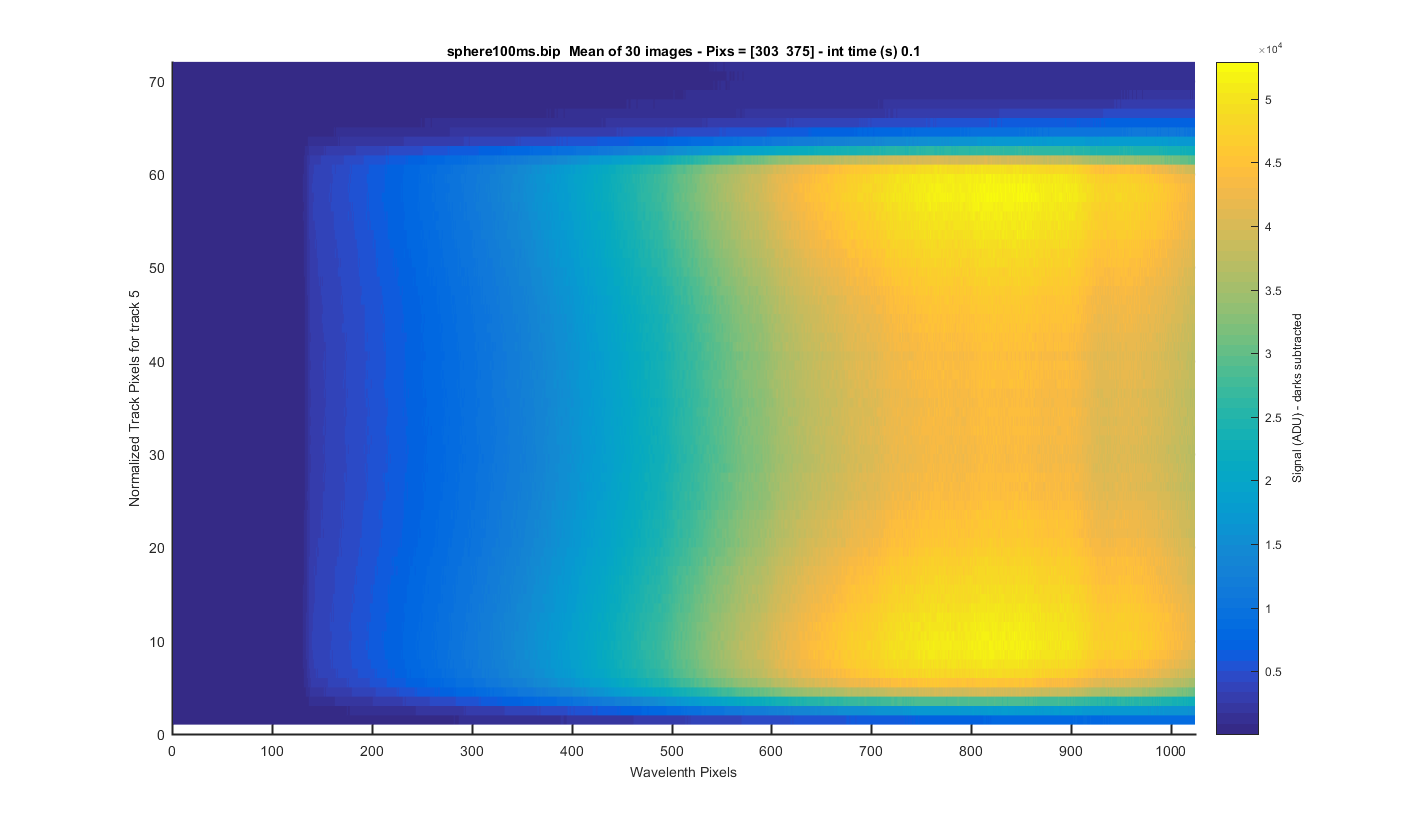
TRACK 5: The meaned image (darks are subtracted) surface plot but for only one track so you can see each track zoomed in. The y-axis is the relative pixel for that track. The title contains the real pixels. I clicked to get these track positions so this will need to be refined in the future.
Figure 16
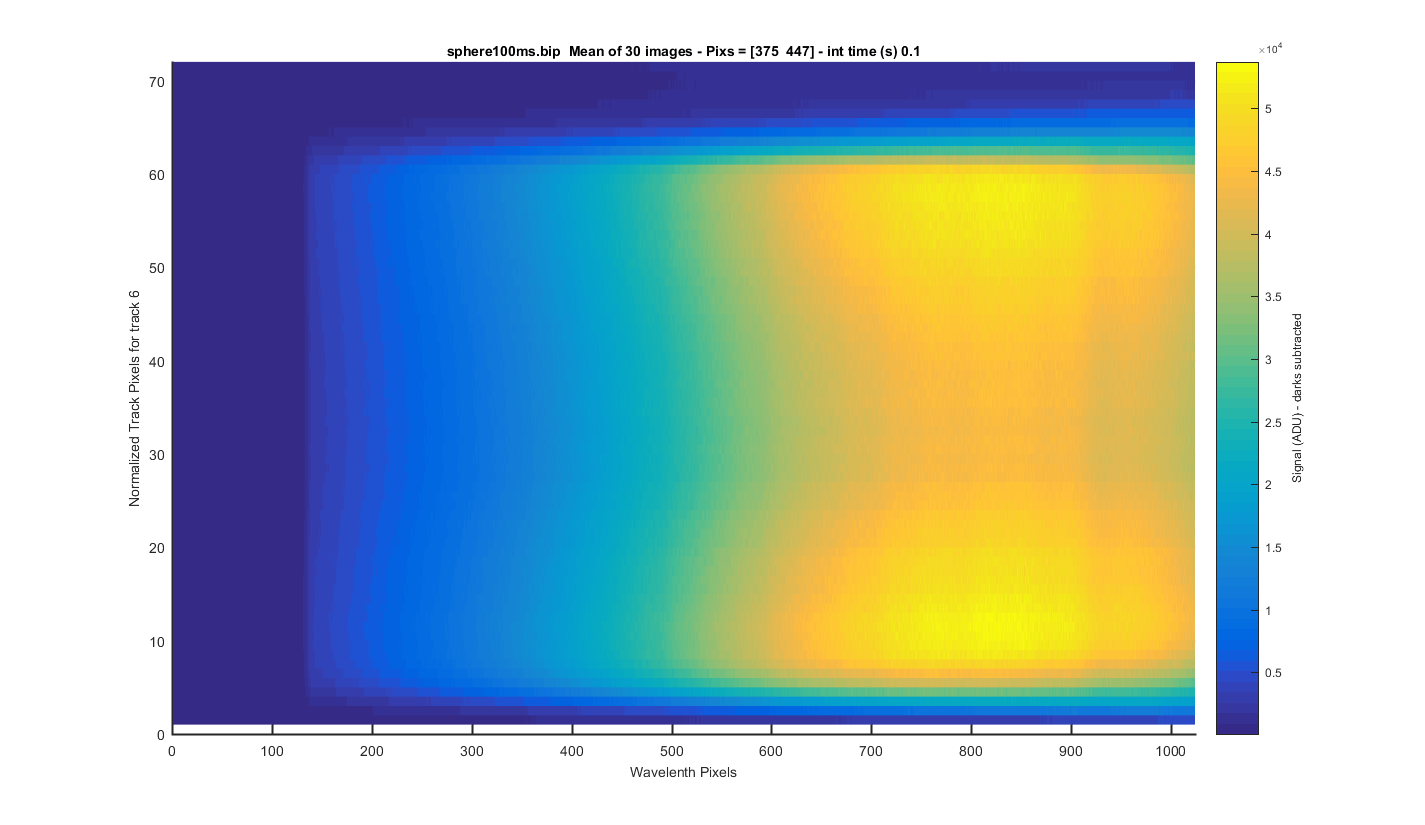
TRACK 6: The meaned image (darks are subtracted) surface plot but for only one track so you can see each track zoomed in. The y-axis is the relative pixel for that track. The title contains the real pixels. I clicked to get these track positions so this will need to be refined in the future.
Figure 17
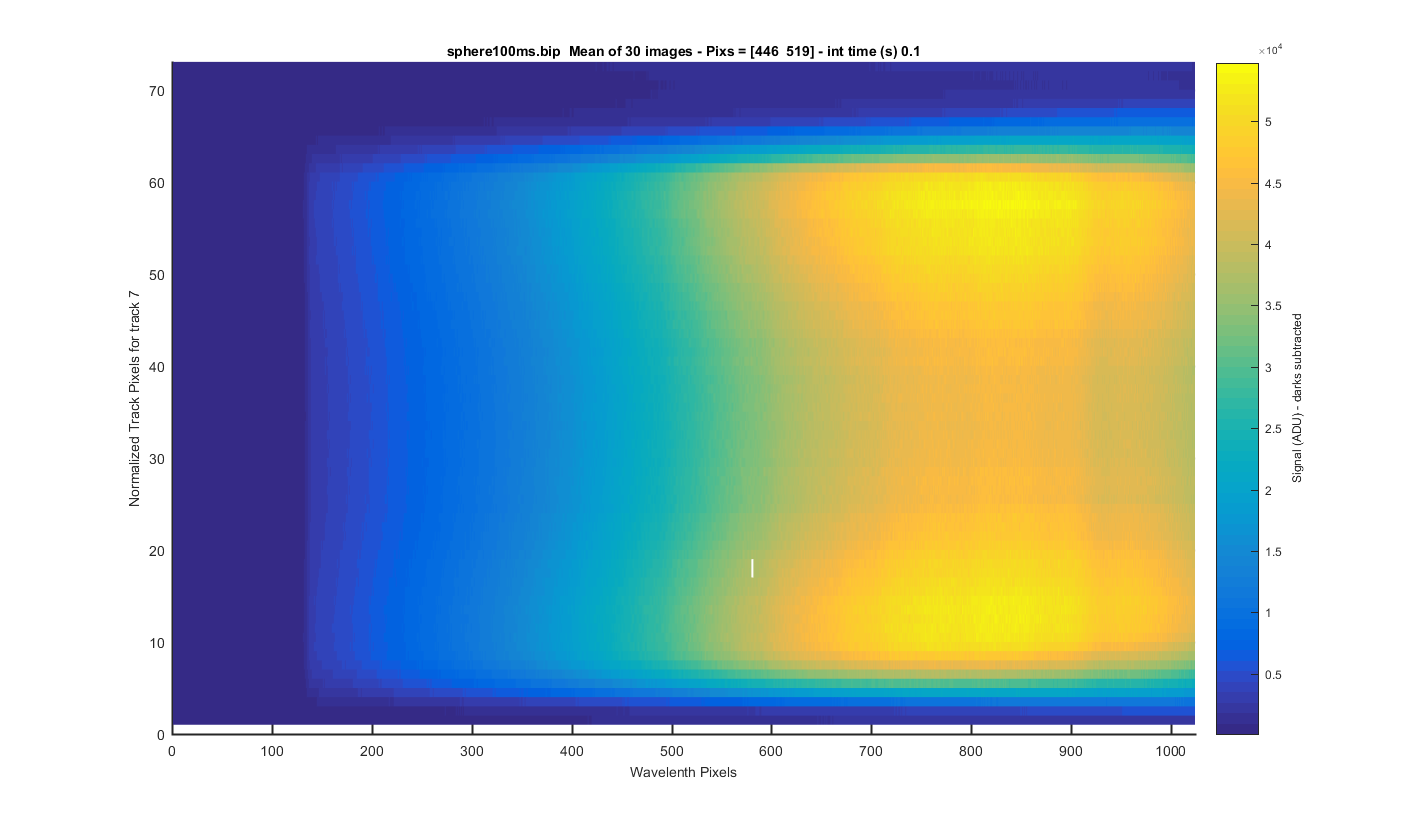
TRACK 7: The meaned image (darks are subtracted) surface plot but for only one track so you can see each track zoomed in. The y-axis is the relative pixel for that track. The title contains the real pixels. I clicked to get these track positions so this will need to be refined in the future.
Figure 18
TRACK 8: The meaned image (darks are subtracted) surface plot but for only one track so you can see each track zoomed in. The y-axis is the relative pixel for that track. The title contains the real pixels. I clicked to get these track positions so this will need to be refined in the future.
Figure 19

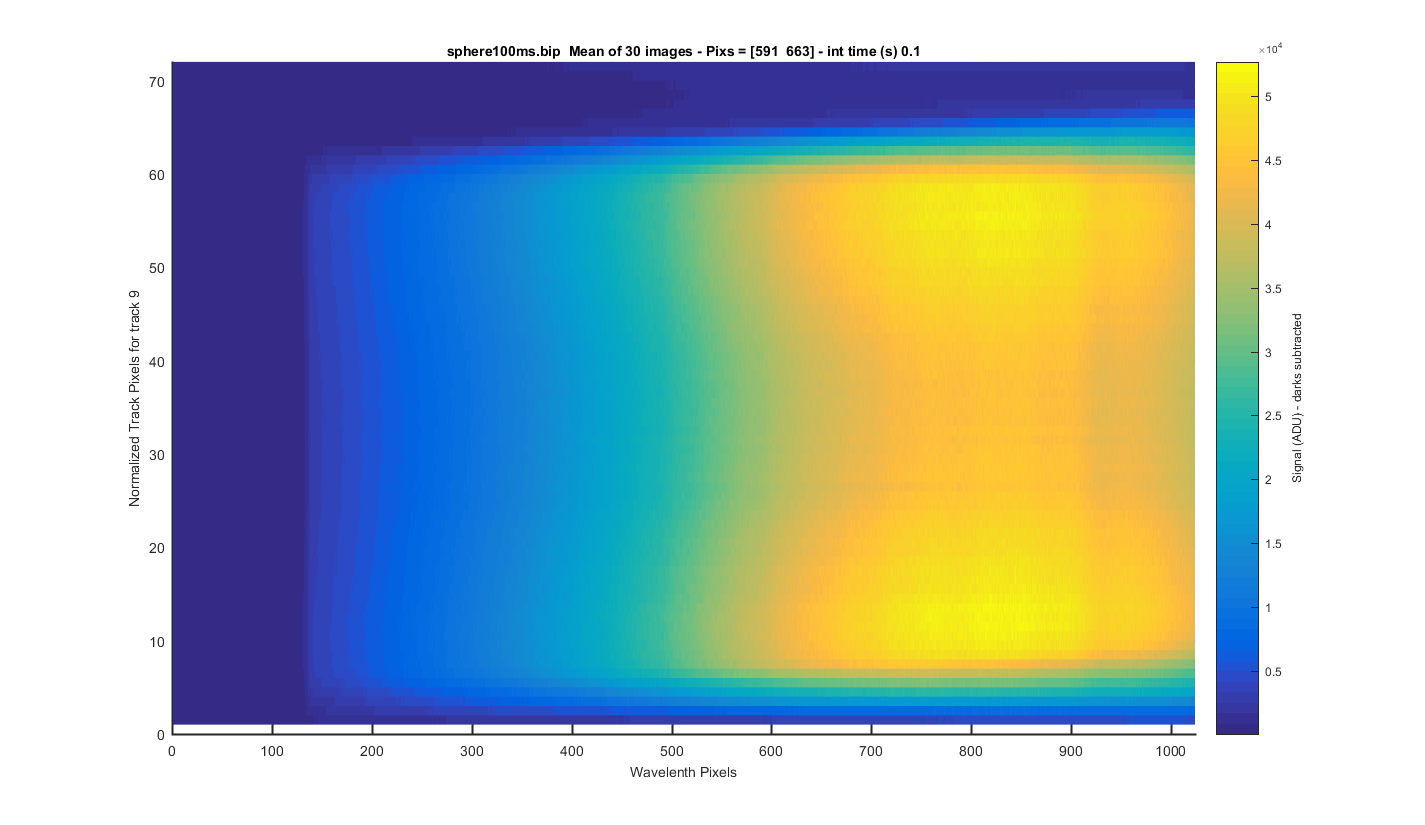
TRACK 9: The meaned image (darks are subtracted) surface plot but for only one track so you can see each track zoomed in. The y-axis is the relative pixel for that track. The title contains the real pixels. I clicked to get these track positions so this will need to be refined in the future.
Figure 20
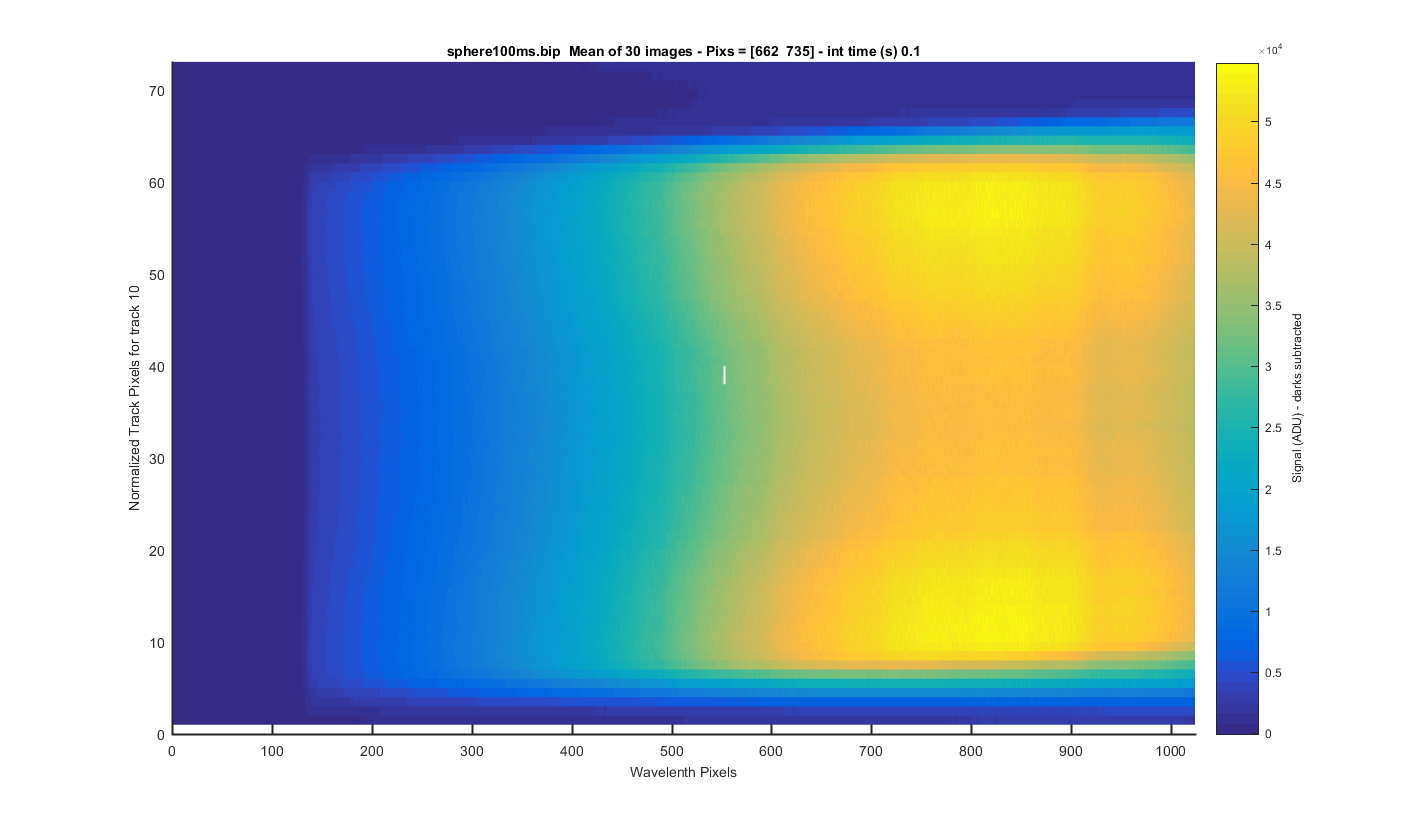
TRACK 10: The meaned image (darks are subtracted) surface plot but for only one track so you can see each track zoomed in. The y-axis is the relative pixel for that track. The title contains the real pixels. I clicked to get these track positions so this will need to be refined in the future.
Figure 21
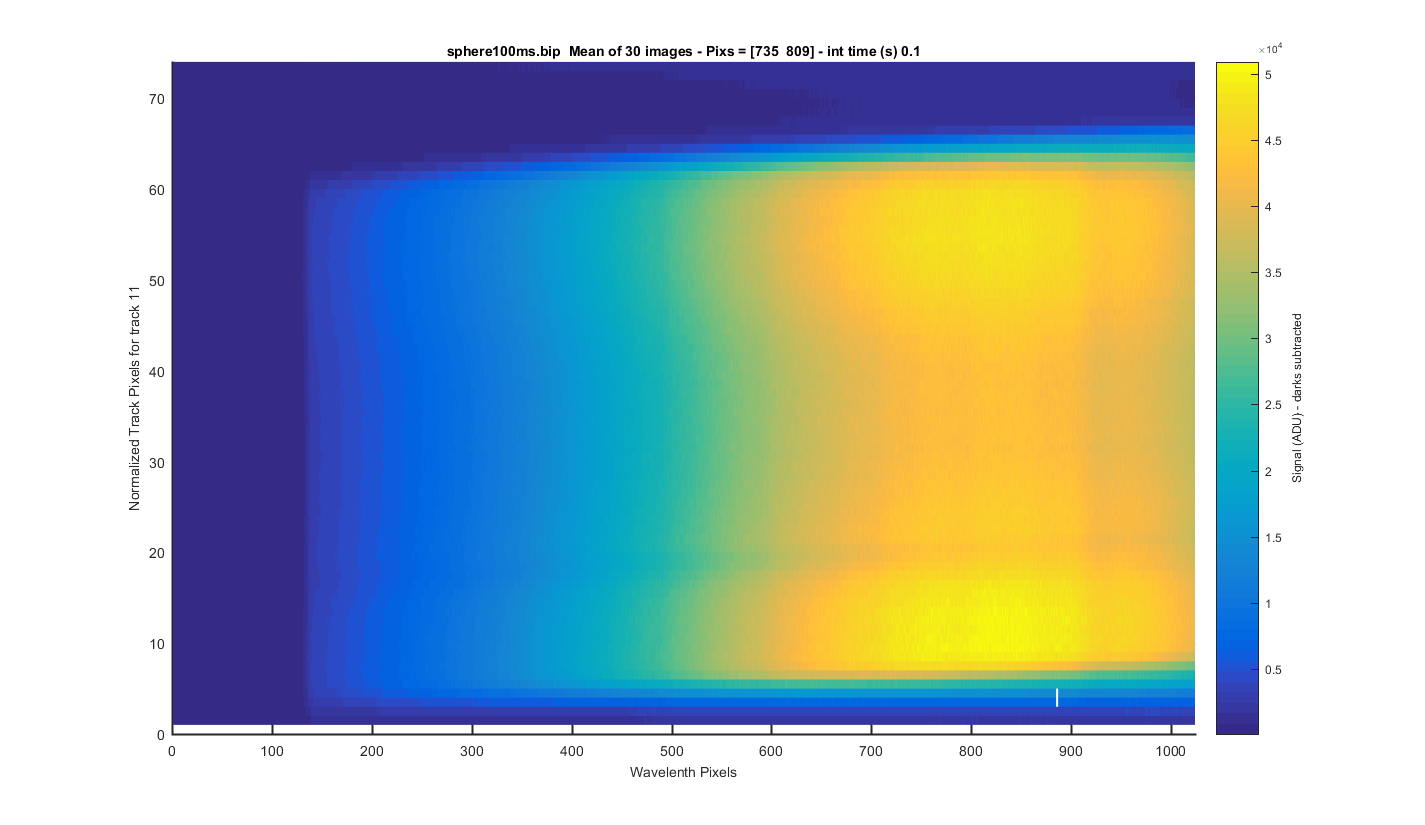
TRACK 11: The meaned image (darks are subtracted) surface plot but for only one track so you can see each track zoomed in. The y-axis is the relative pixel for that track. The title contains the real pixels. I clicked to get these track positions so this will need to be refined in the future.
Figure 22
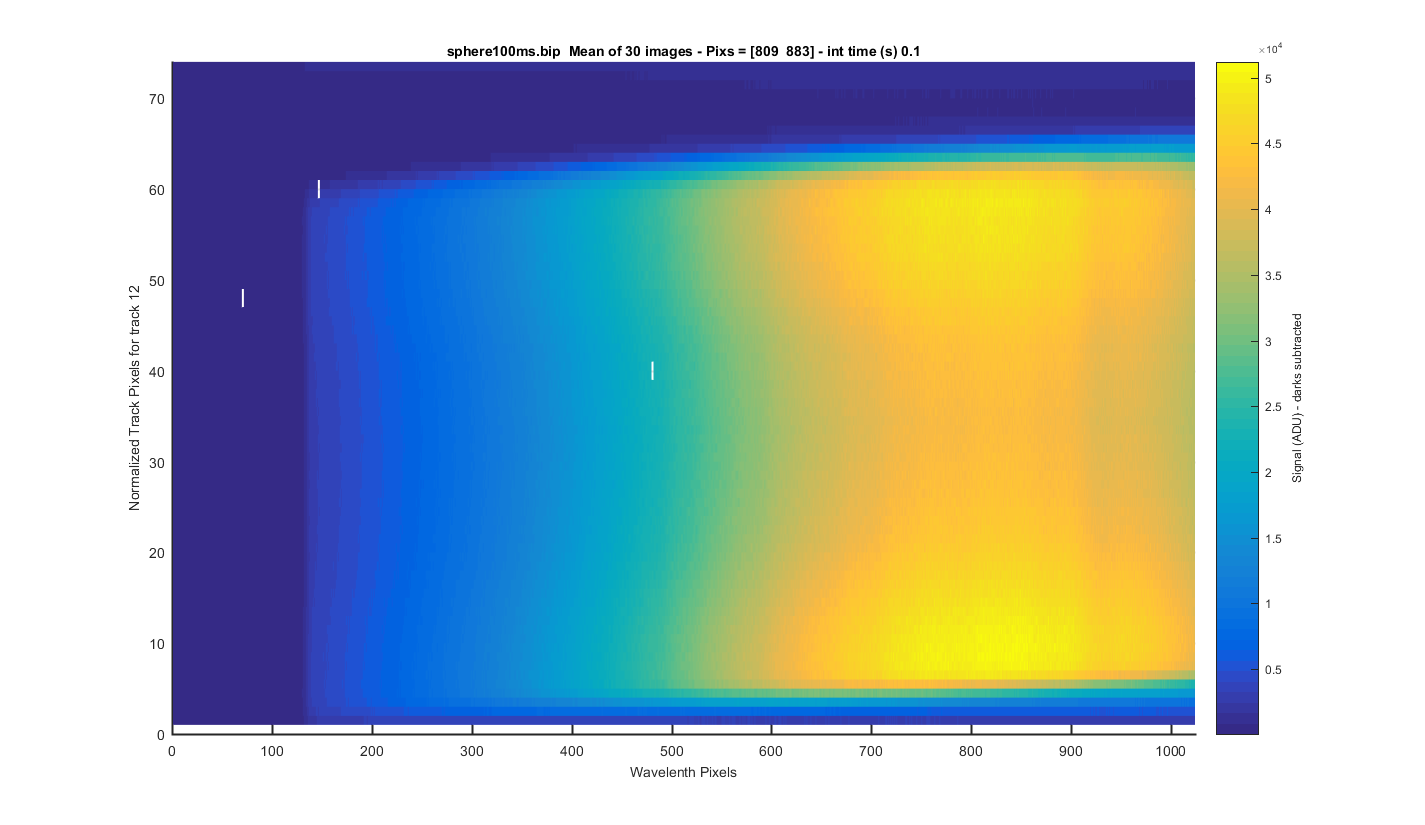
TRACK 12: The meaned image (darks are subtracted) surface plot but for only one track so you can see each track zoomed in. The y-axis is the relative pixel for that track. The title contains the real pixels. I clicked to get these track positions so this will need to be refined in the future.
Figure 23
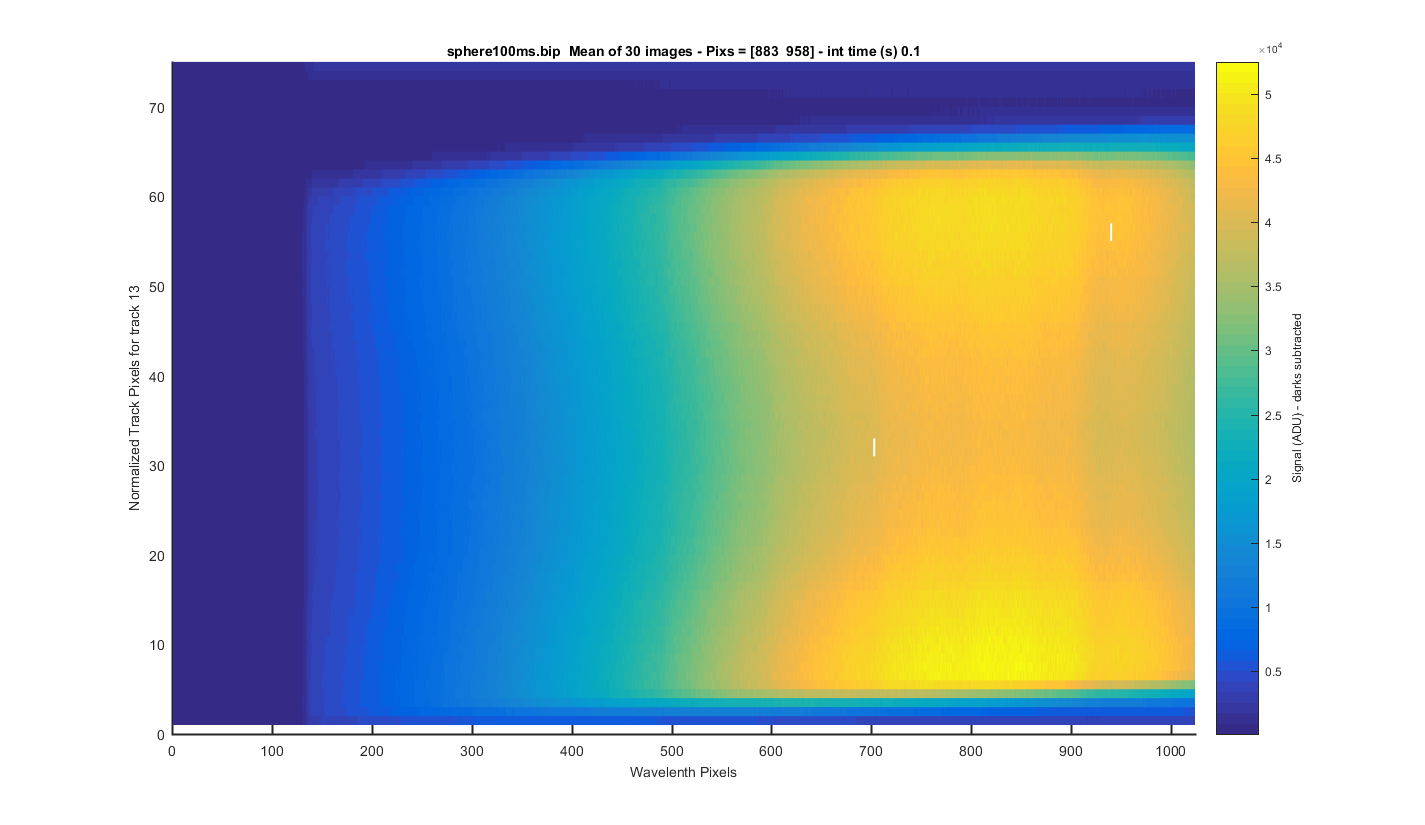
TRACK 13: The meaned image (darks are subtracted) surface plot but for only one track so you can see each track zoomed in. The y-axis is the relative pixel for that track. The title contains the real pixels. I clicked to get these track positions so this will need to be refined in the future.
Figure 24
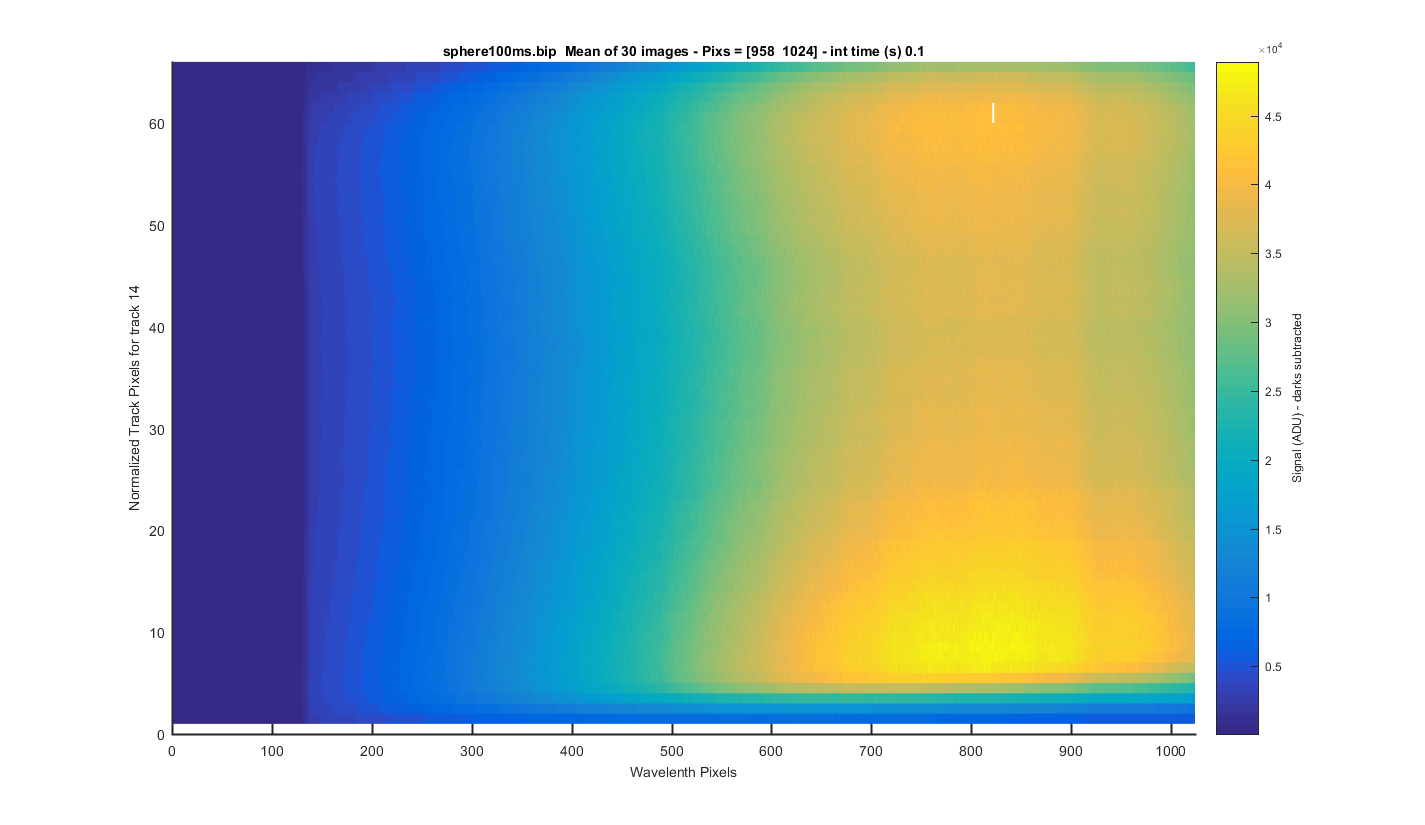
TRACK 14: The meaned image (darks are subtracted) surface plot but for only one track so you can see each track zoomed in. The y-axis is the relative pixel for that track. The title contains the real pixels. I clicked to get these track positions so this will need to be refined in the future.
Figure 25