REVISION DATE: 15-Aug-2016 14:43:17
Email from Mike Kehoe on 8/2/2016 3:51 PM:

Greetings All,

Casey finished assembly and testing of RS3 last week, before heading to Asia on other business. Please find attached the report on RS3.
The data is at the usual site:  MOBY Red file dated 7/28/16.  The system is ready so ship, so please let me know when you are ready to receive it.

-Mike
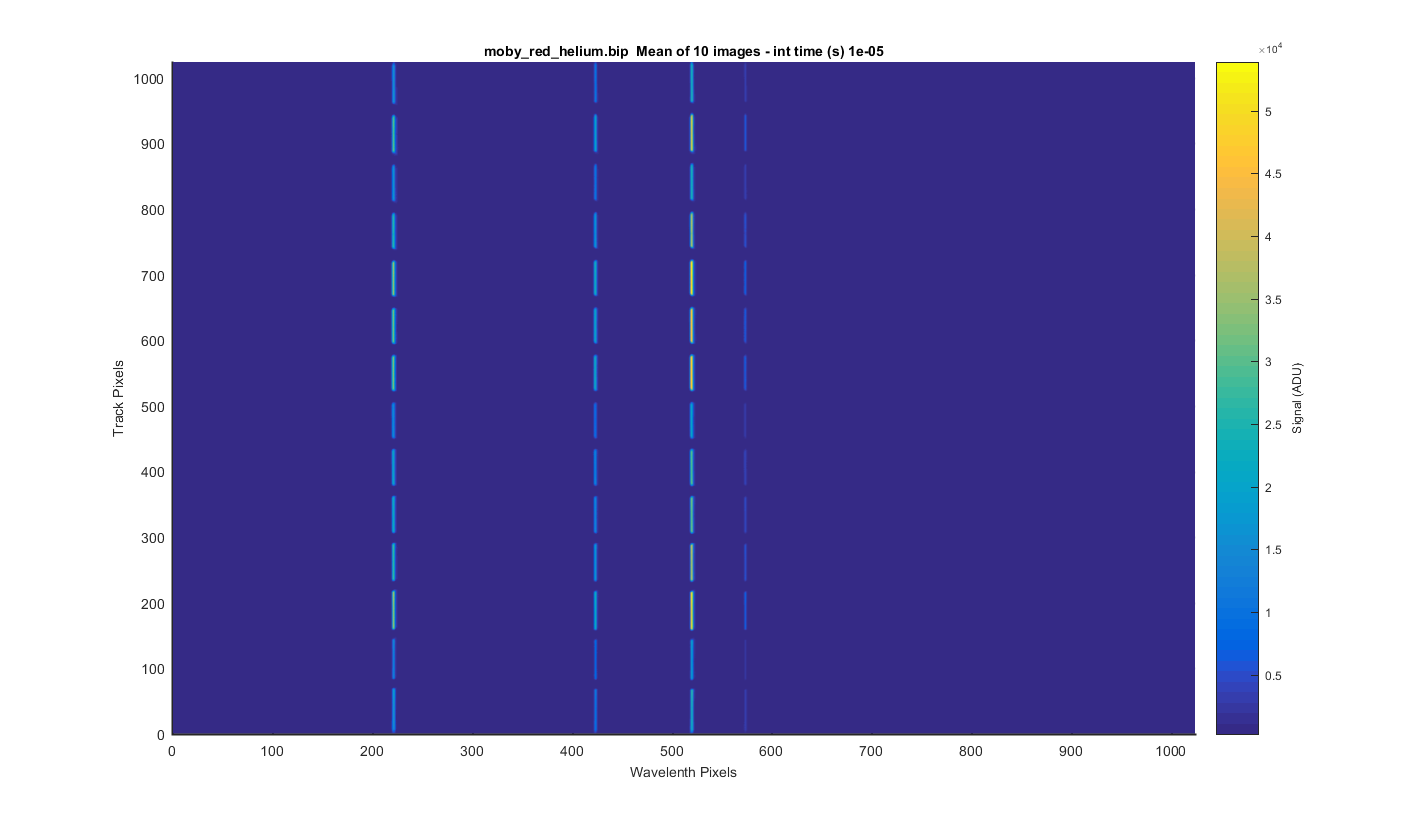
Below are my graphs of the helium.bip file. The file contains 10 dark images at 0.1 sec Note some graphs are dark corrected and some are not so check the axis labels to know what you are looking at.
I took the 10 images and meaned them to get the surface plot below.
Figure 1
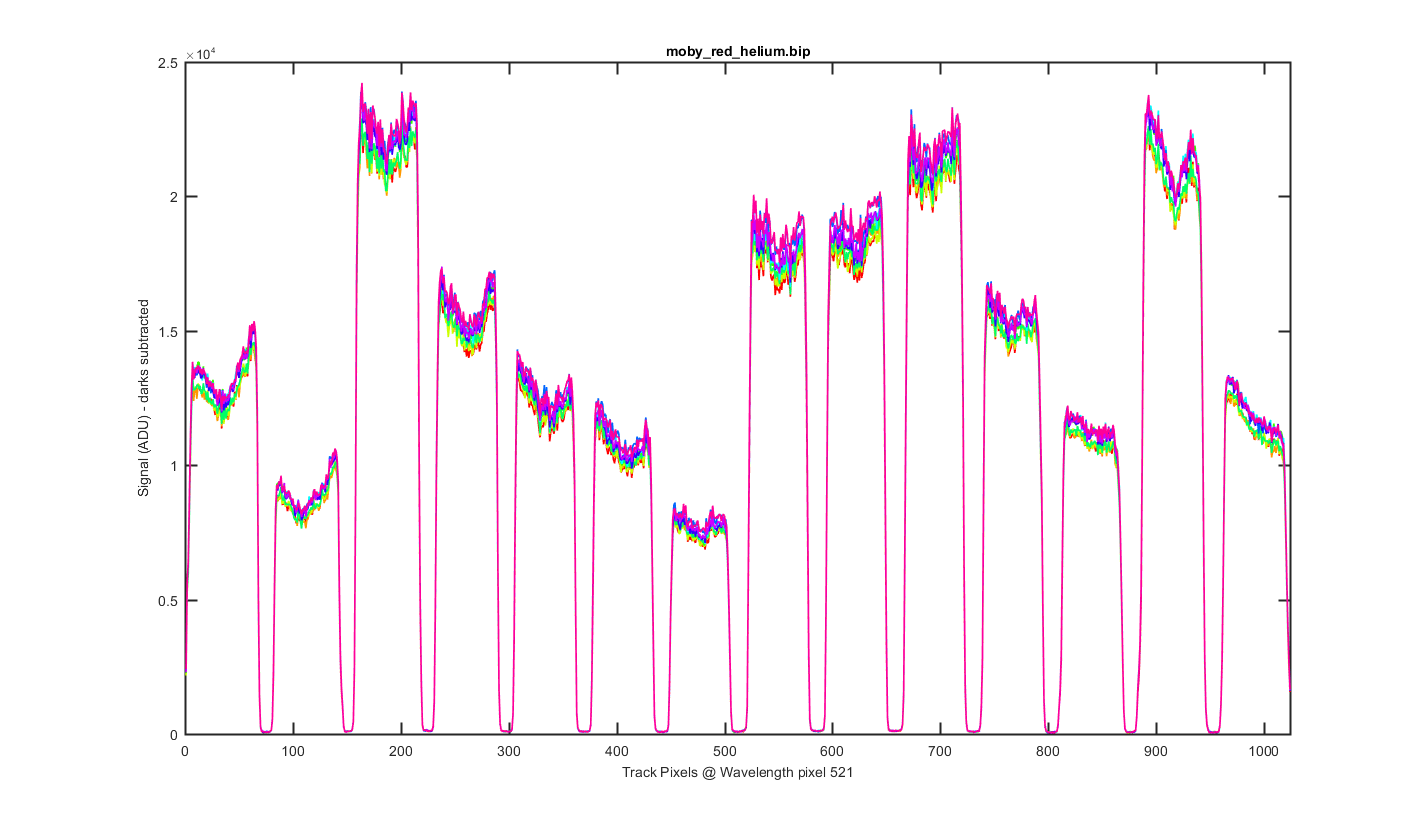
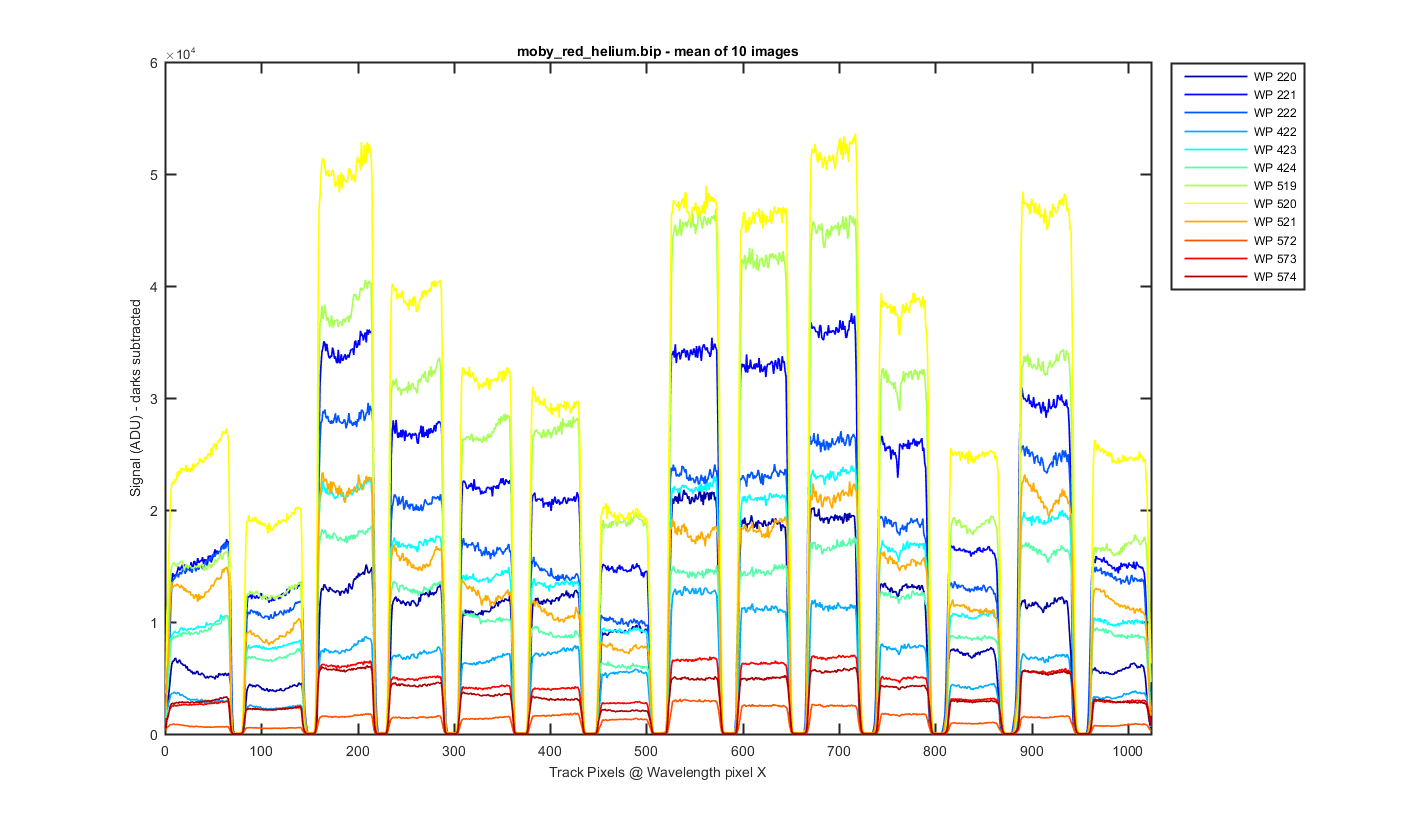
This is a cross section through the tracks at wavelength pixel 520, with one line for each of the 10 images. The tracks and their shapes look really stable.
Figure 2
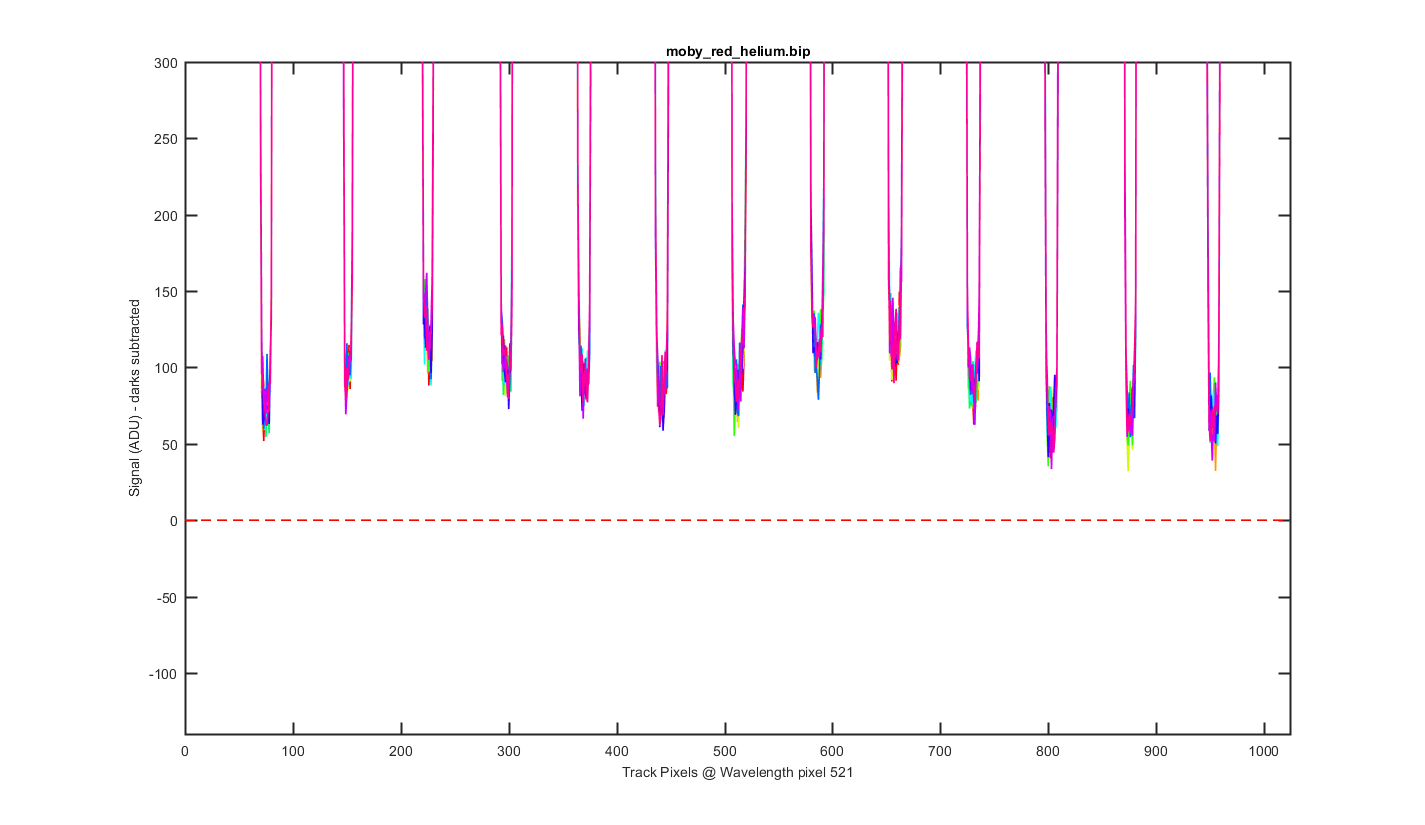
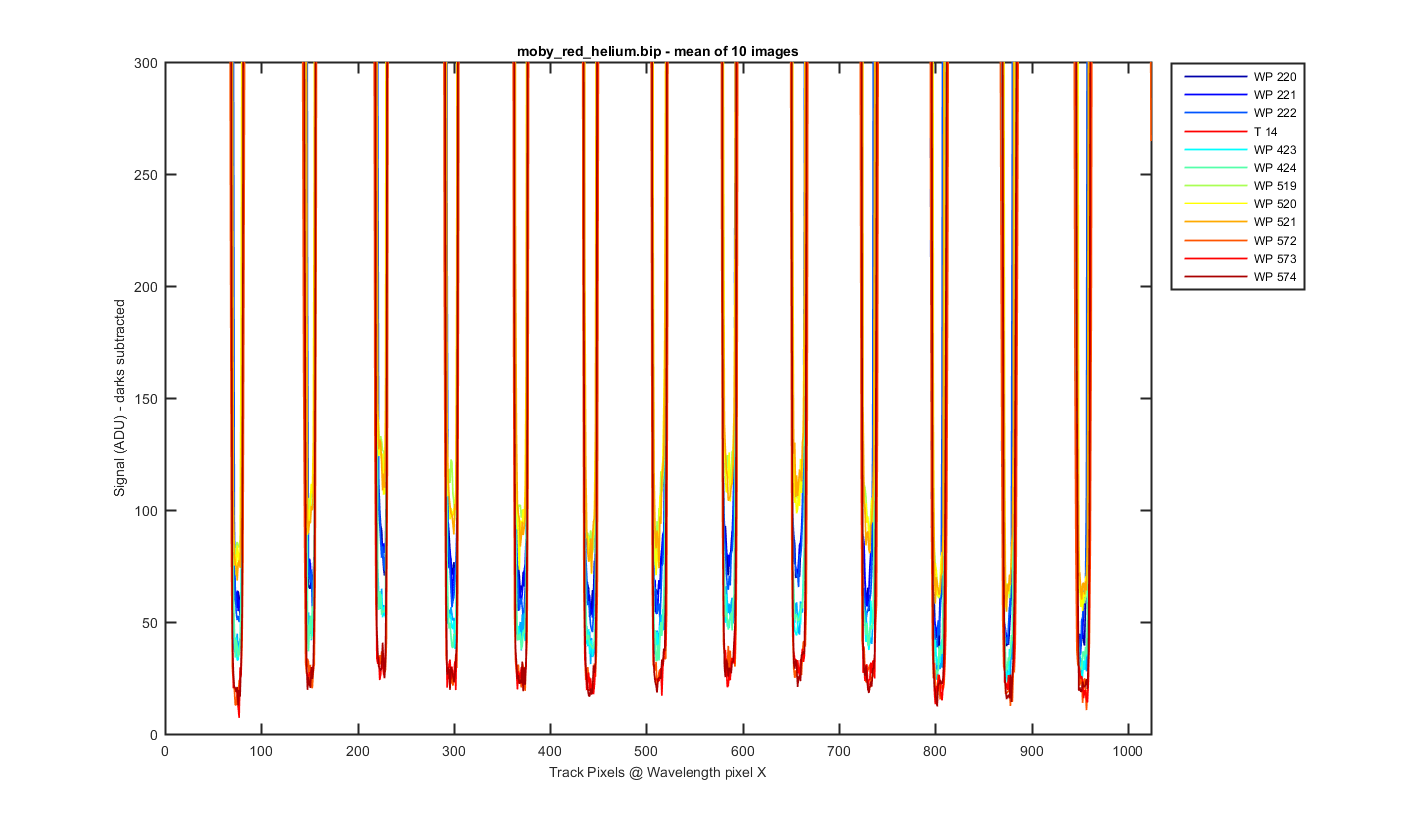
Same as the previous graph but zoomed into the bottom to see the level of the darks between the tracks.
Figure 3
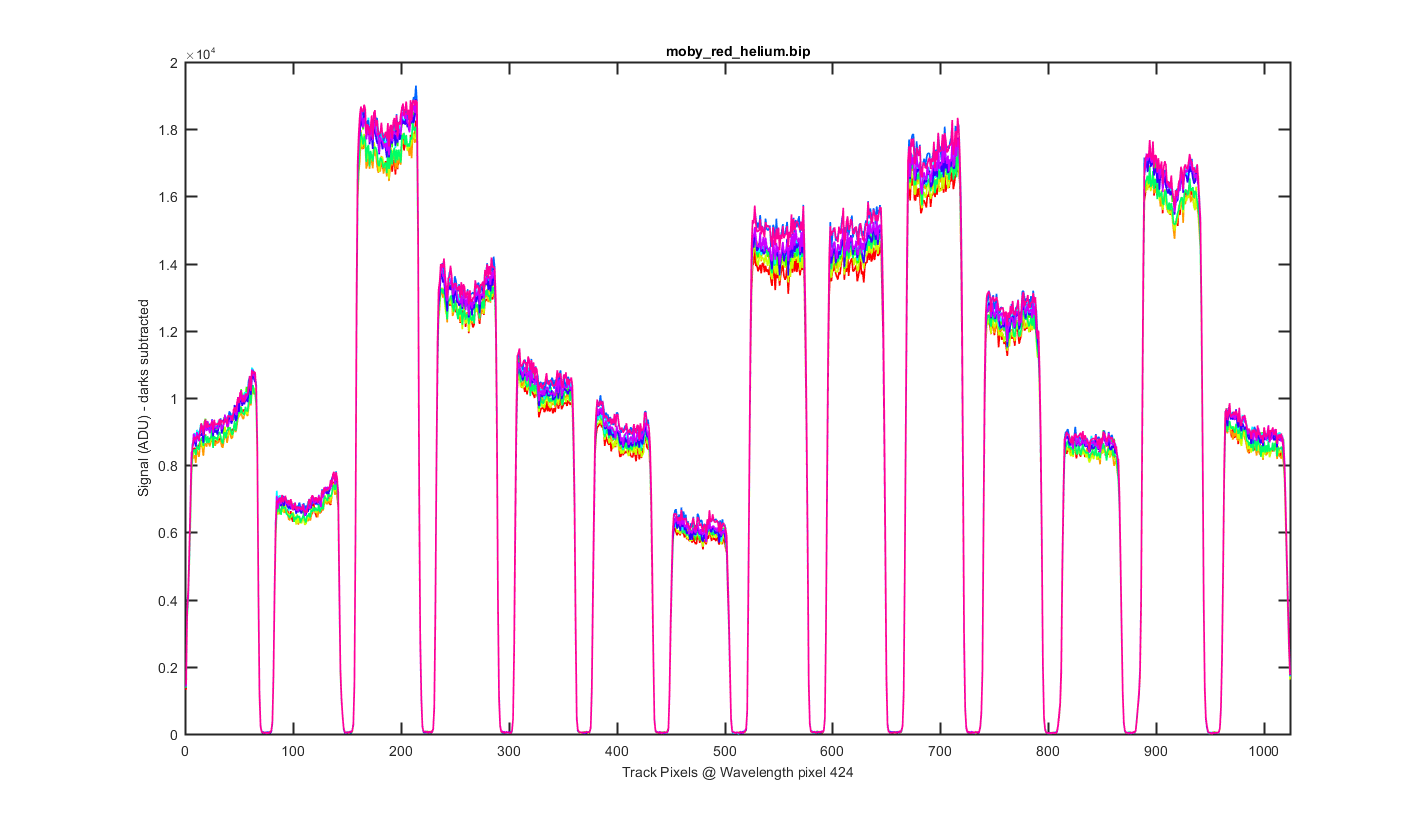
Same as figure 2 but for Wavelength pixel 423.
Figure 4
Again this is the mean image with slices thought the image at different wavelength pixels. The pixels choosen are where the helium peaks are and +- pixel pixel around them.
Figure 5
Same as figure 5 but zoomed to the bottom so you can see the darks between the tracks.
Figure 6
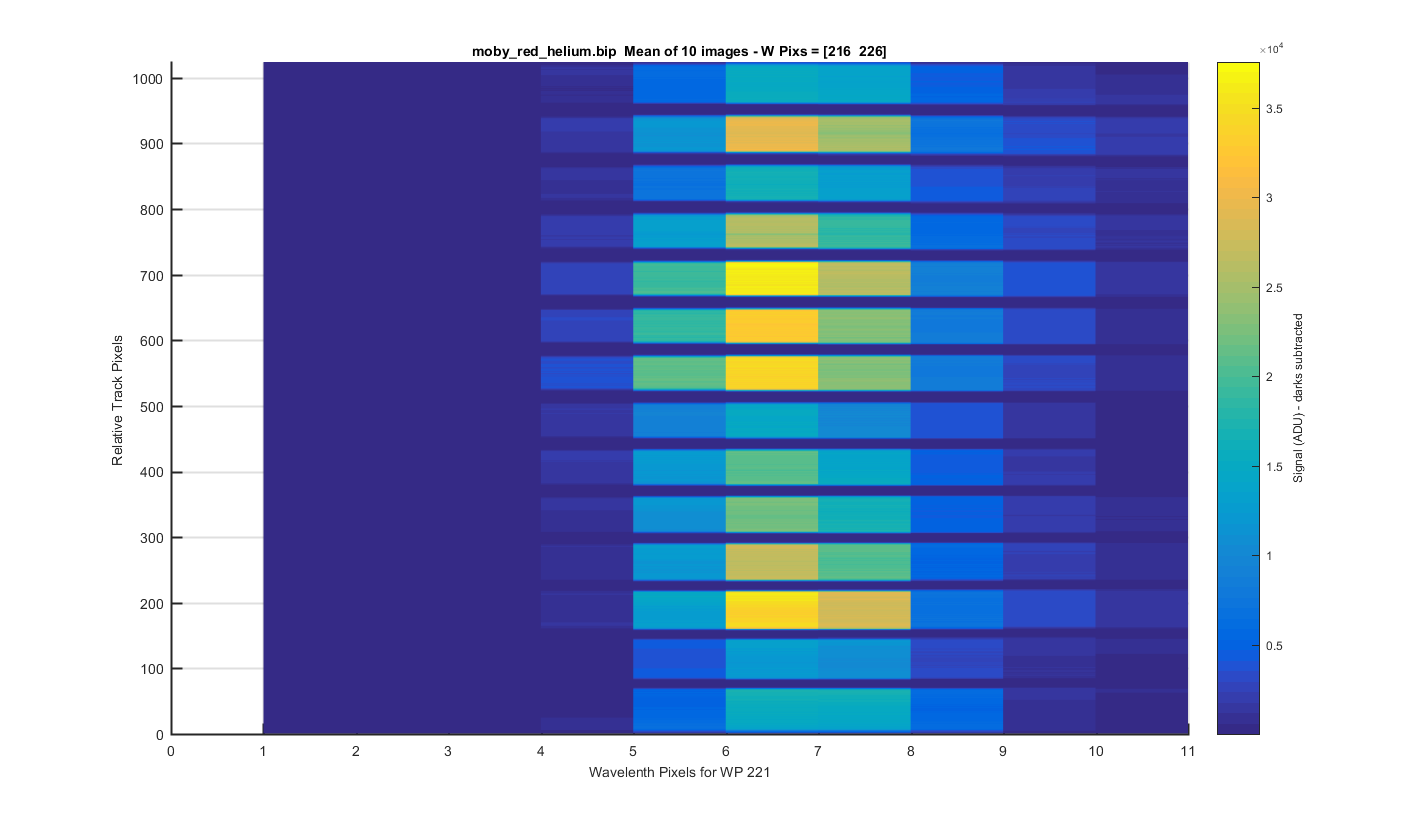
Helimu Peak 1 (at pix 221): The same surface plot but showing how individual helium peaks line up from track to track. Looks pretty good!
Figure 7
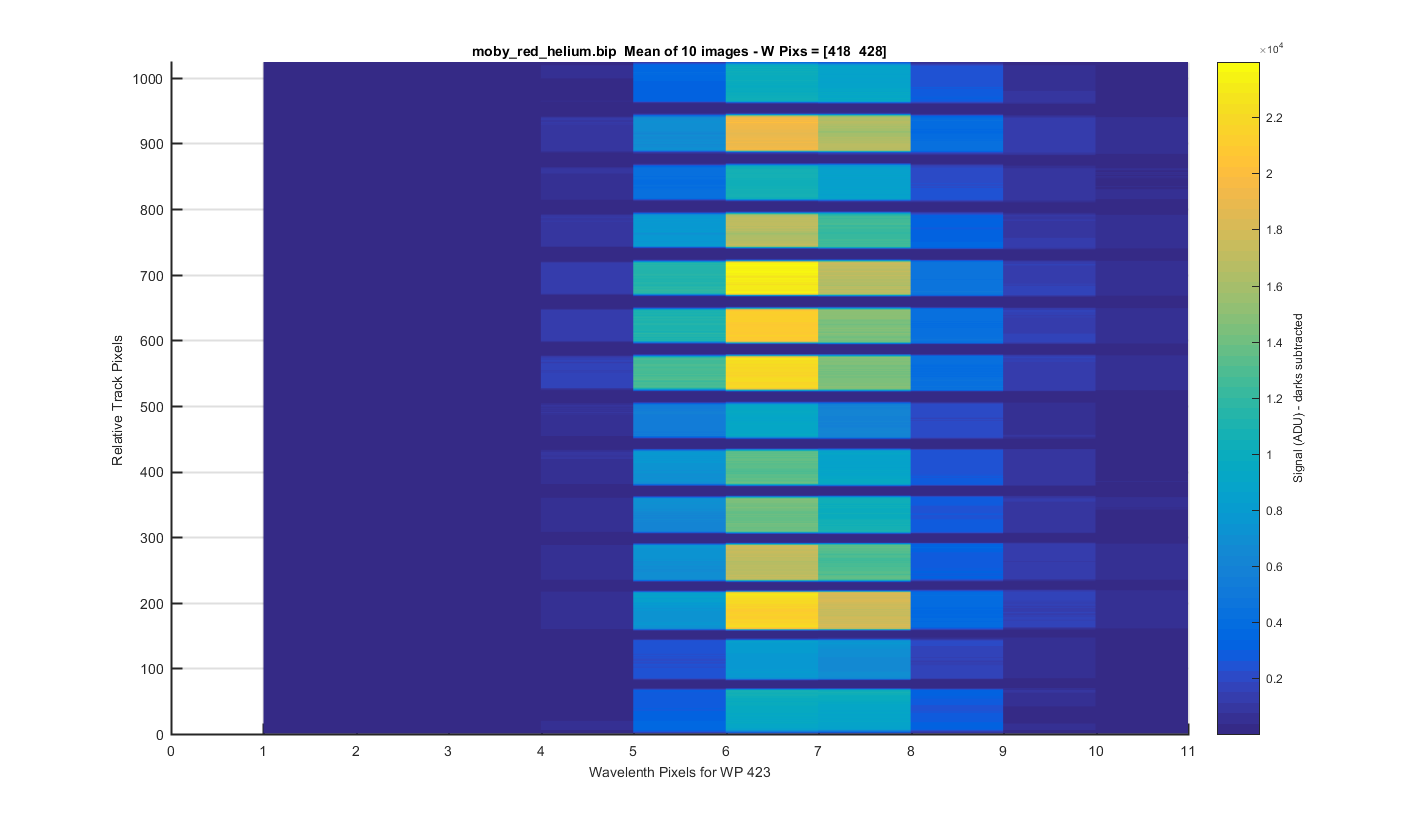
Helimu Peak 2 (at pix 423): The same surface plot but showing how individual helium peaks line up from track to track. Looks pretty good!
Figure 8
Helimu Peak 3 (at pix 520): The same surface plot but showing how individual helium peaks line up from track to track. Looks pretty good!
Figure 9
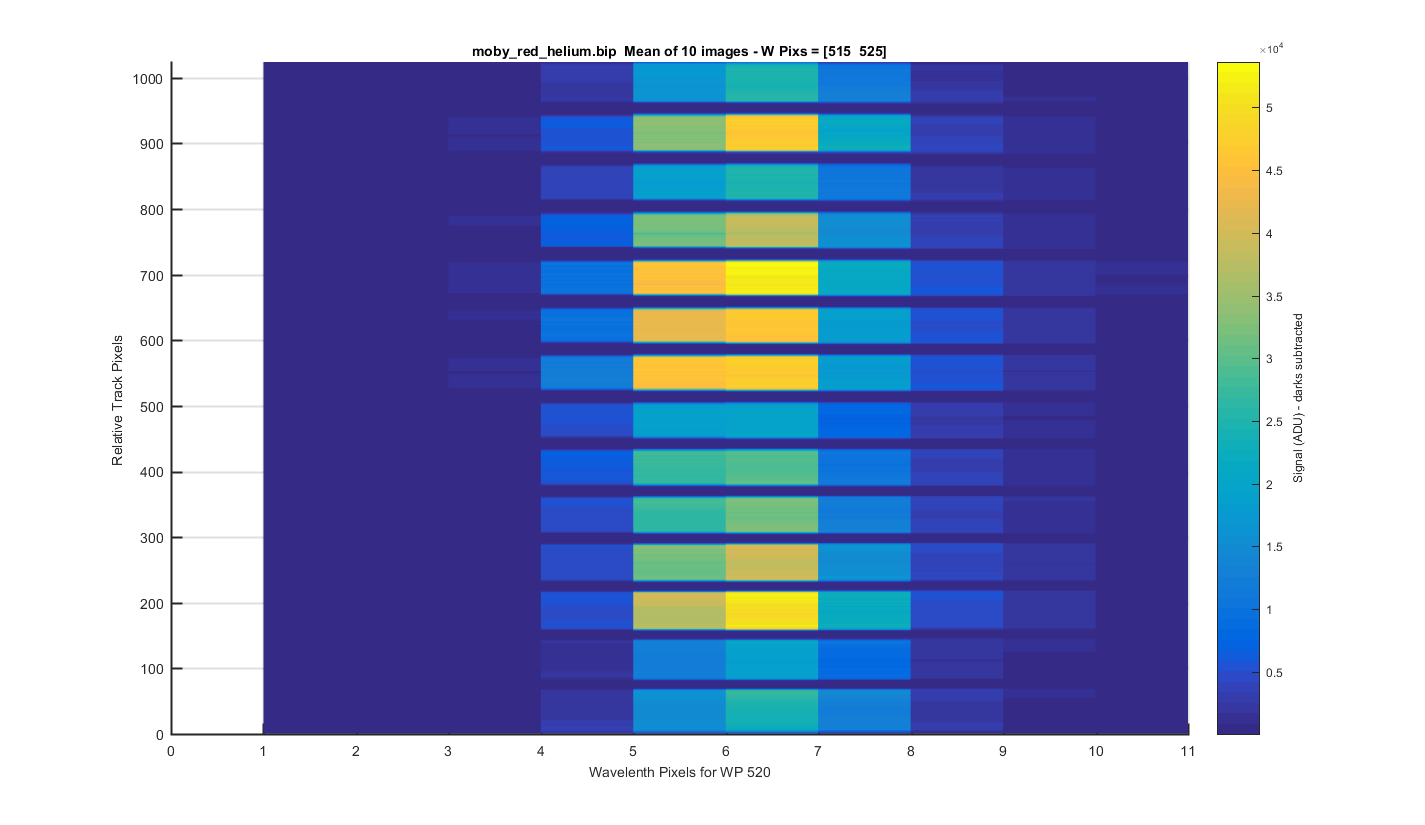
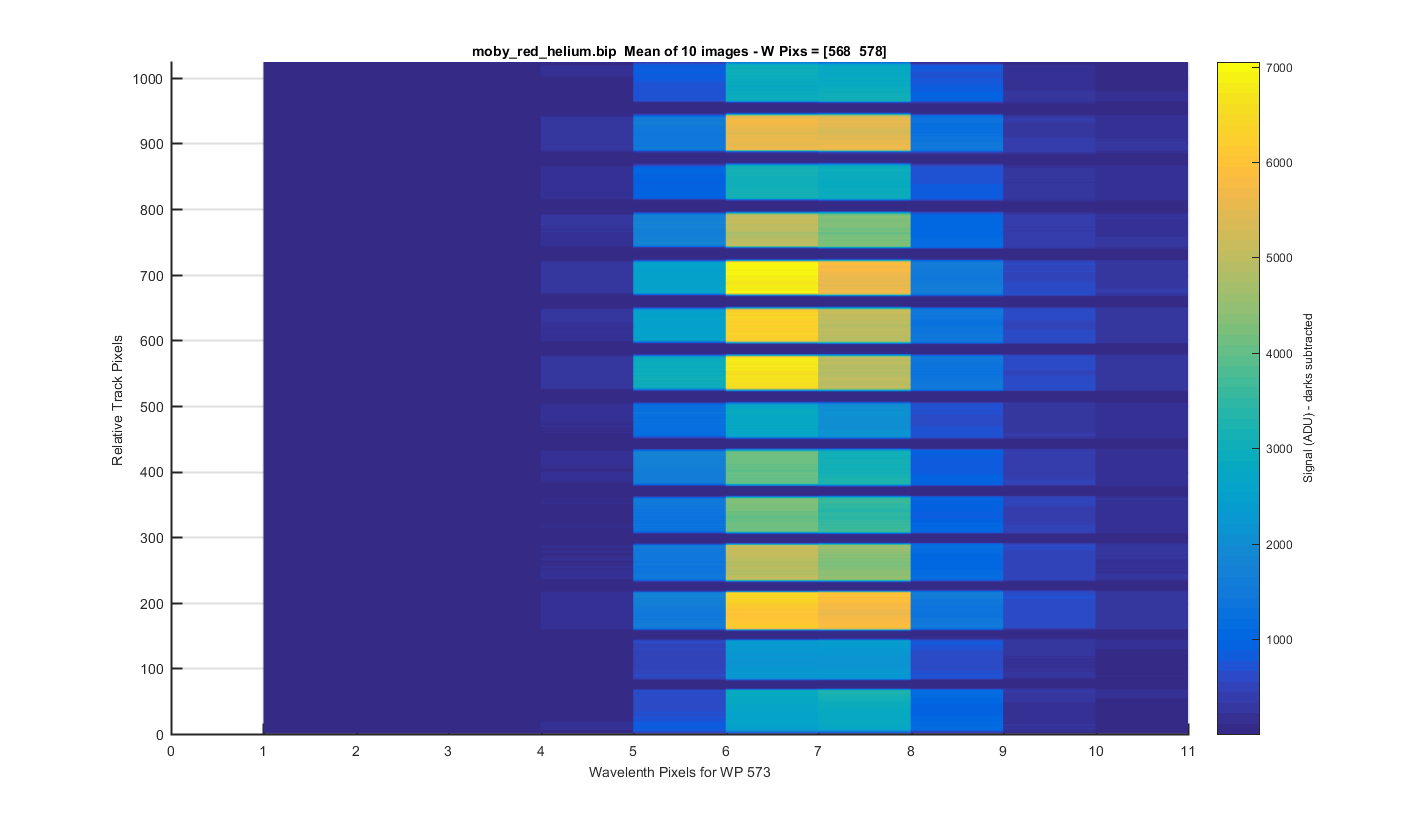
Helimu Peak 4 (at pix 573): The same surface plot but showing how individual helium peaks line up from track to track. Looks pretty good!
Figure 10
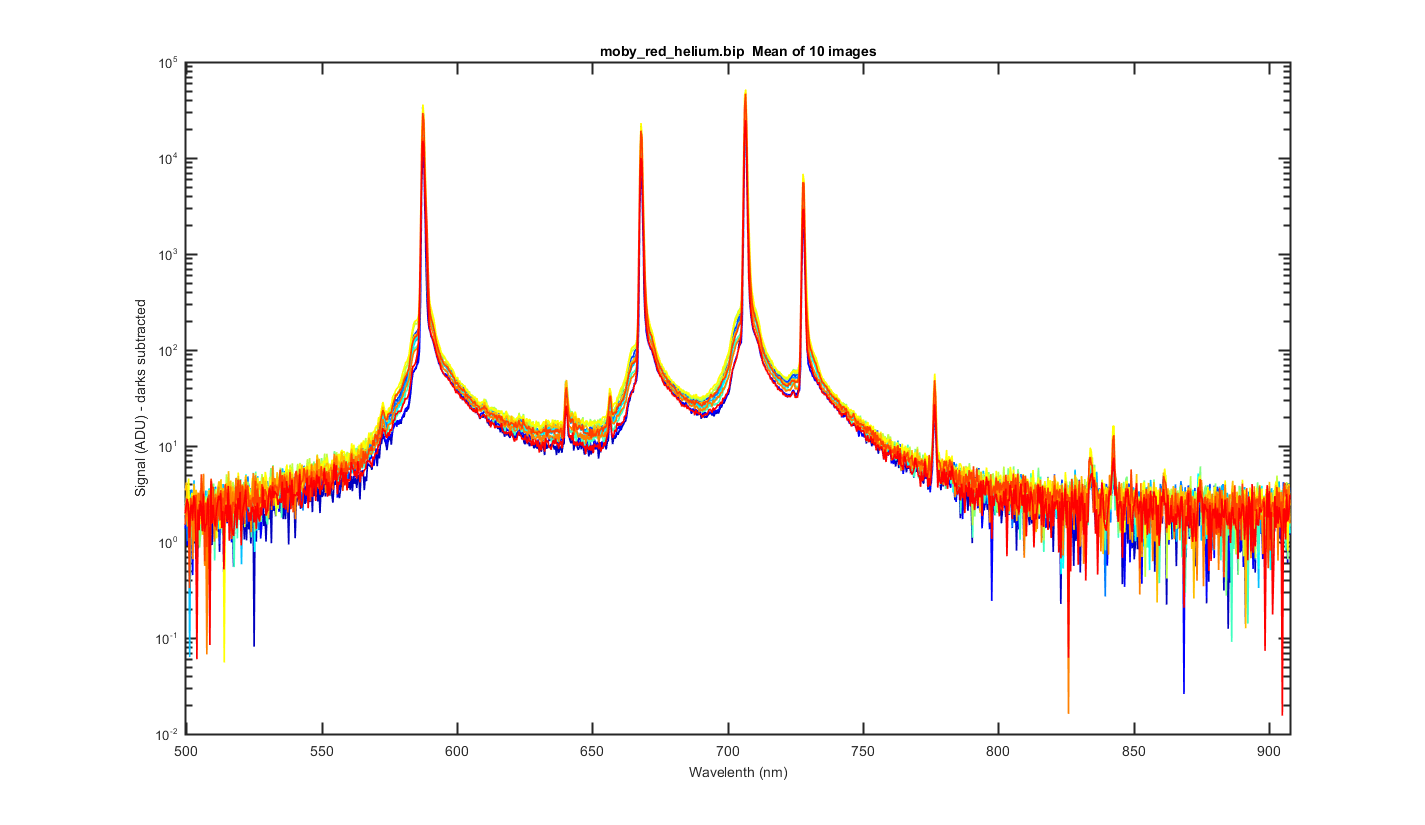
Mean image binned by track, the x-axis is wavelength pixels.
Figure 11
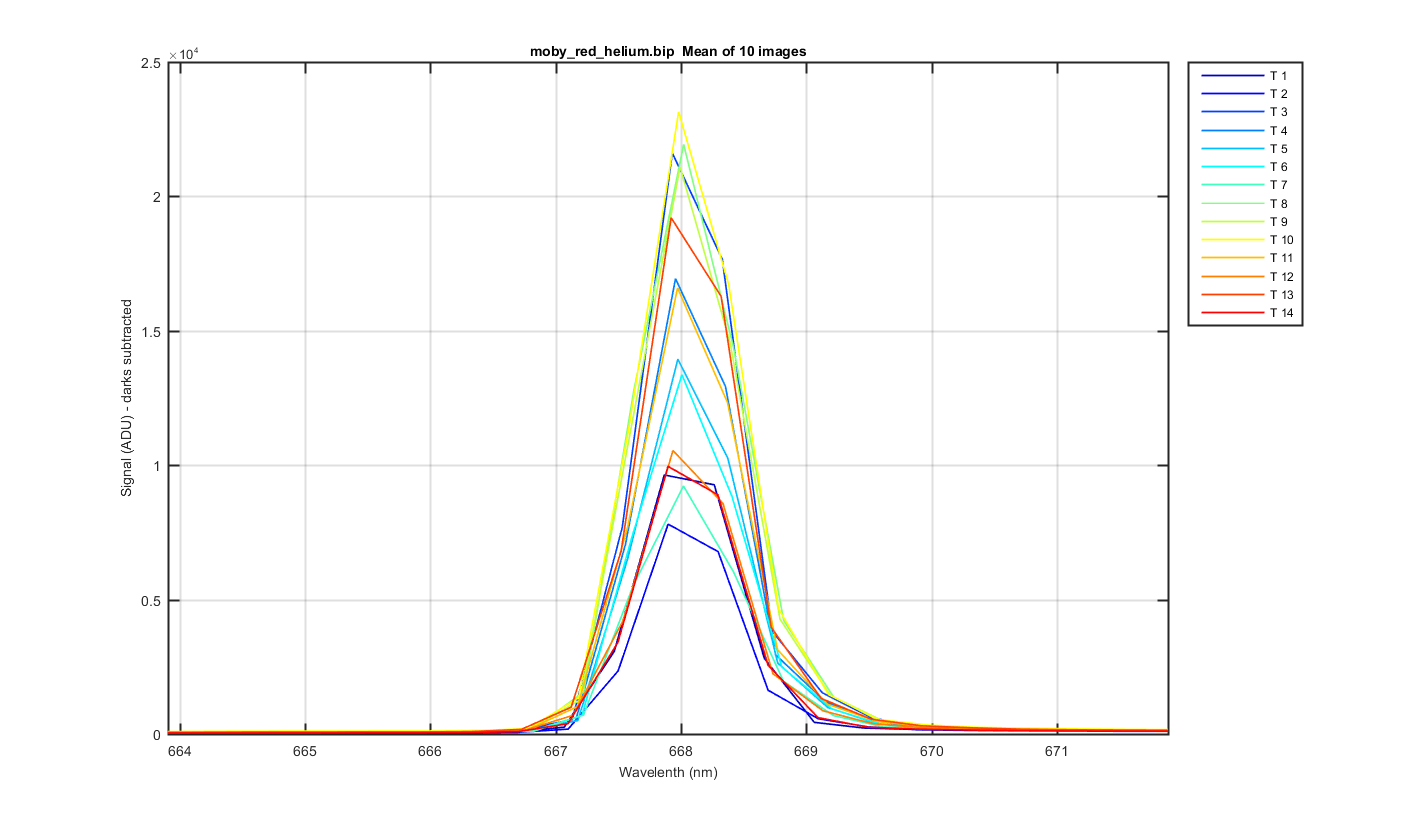
Close up of one of the helium peaks
Figure 12
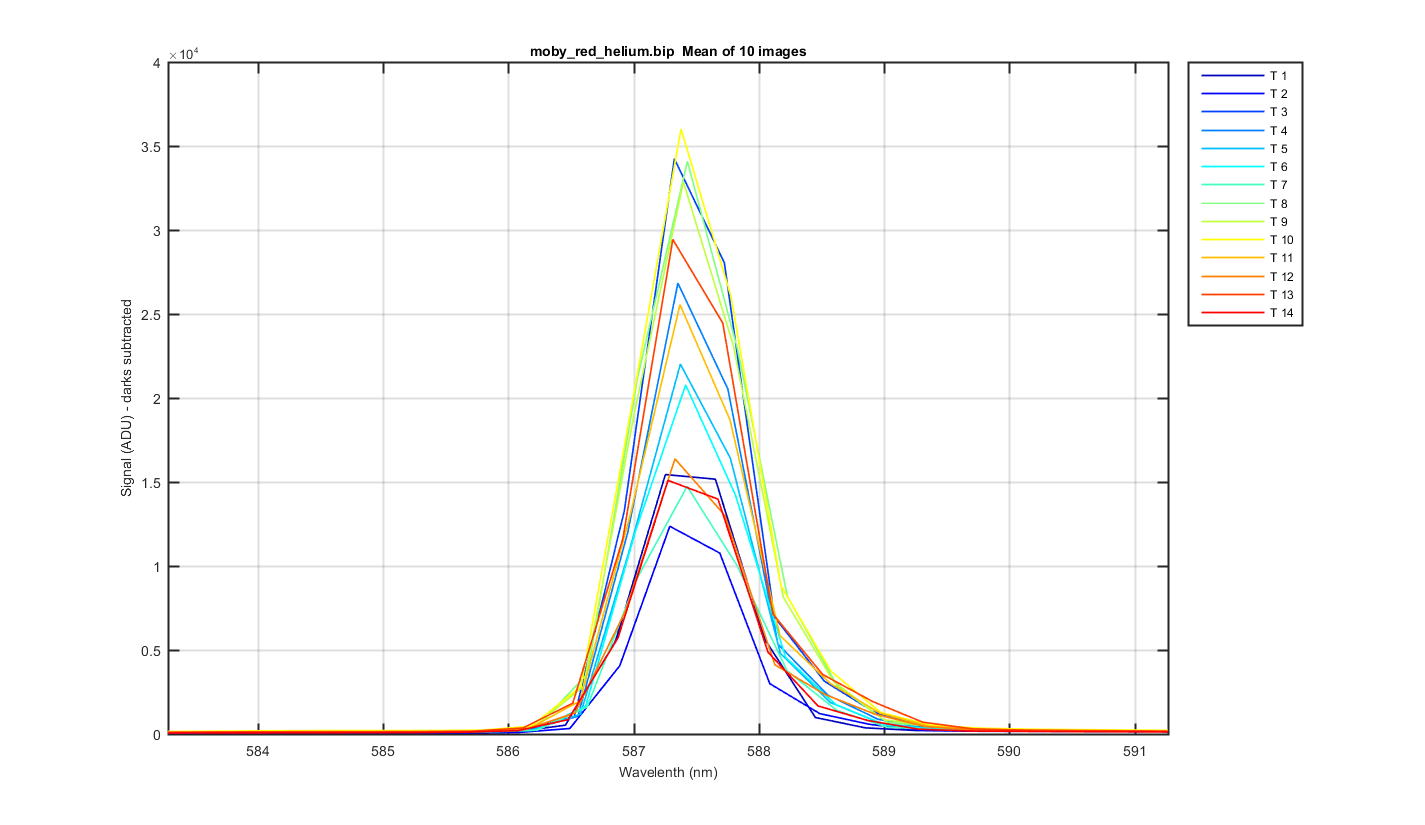
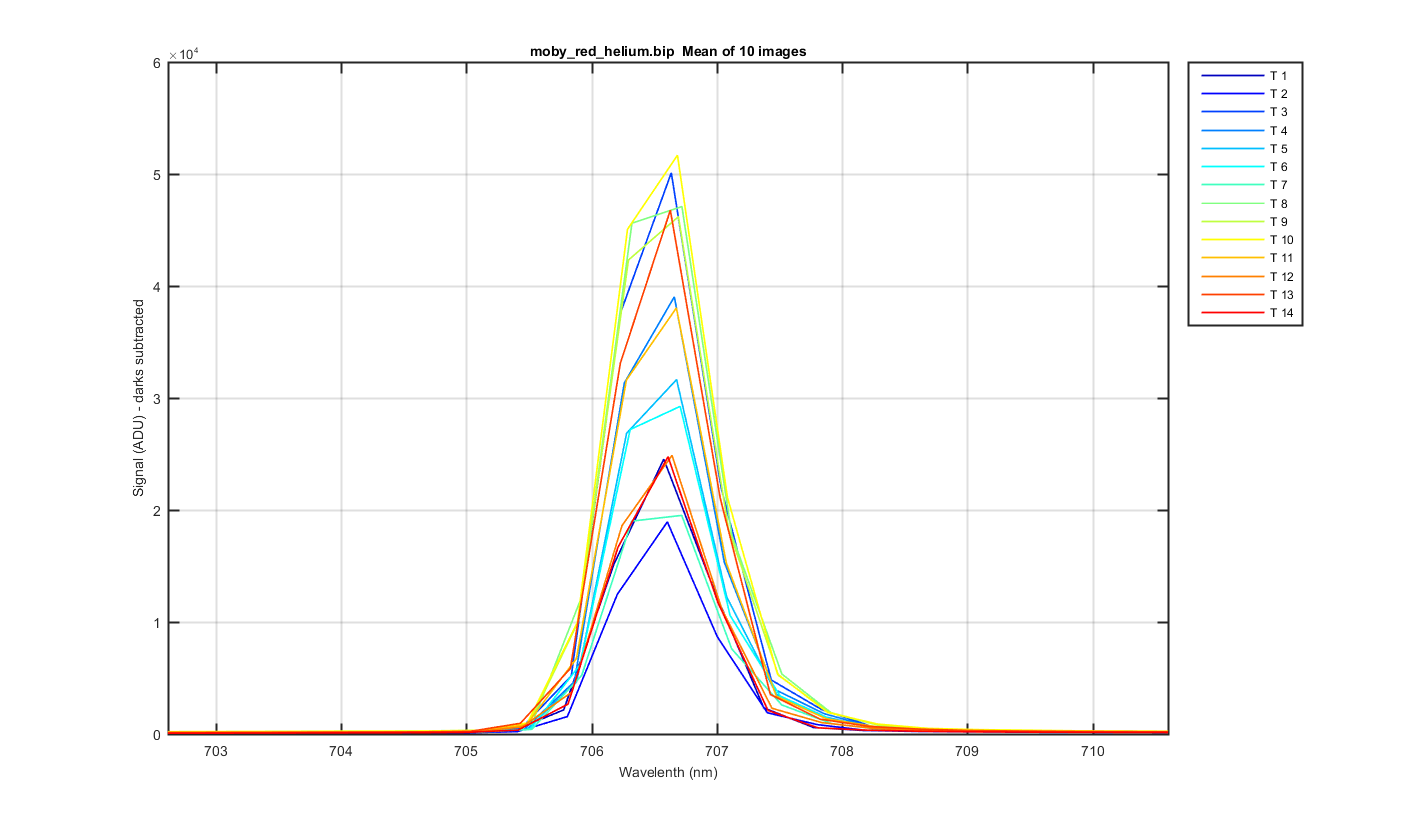
Close up of one of the helium peaks
Figure 13
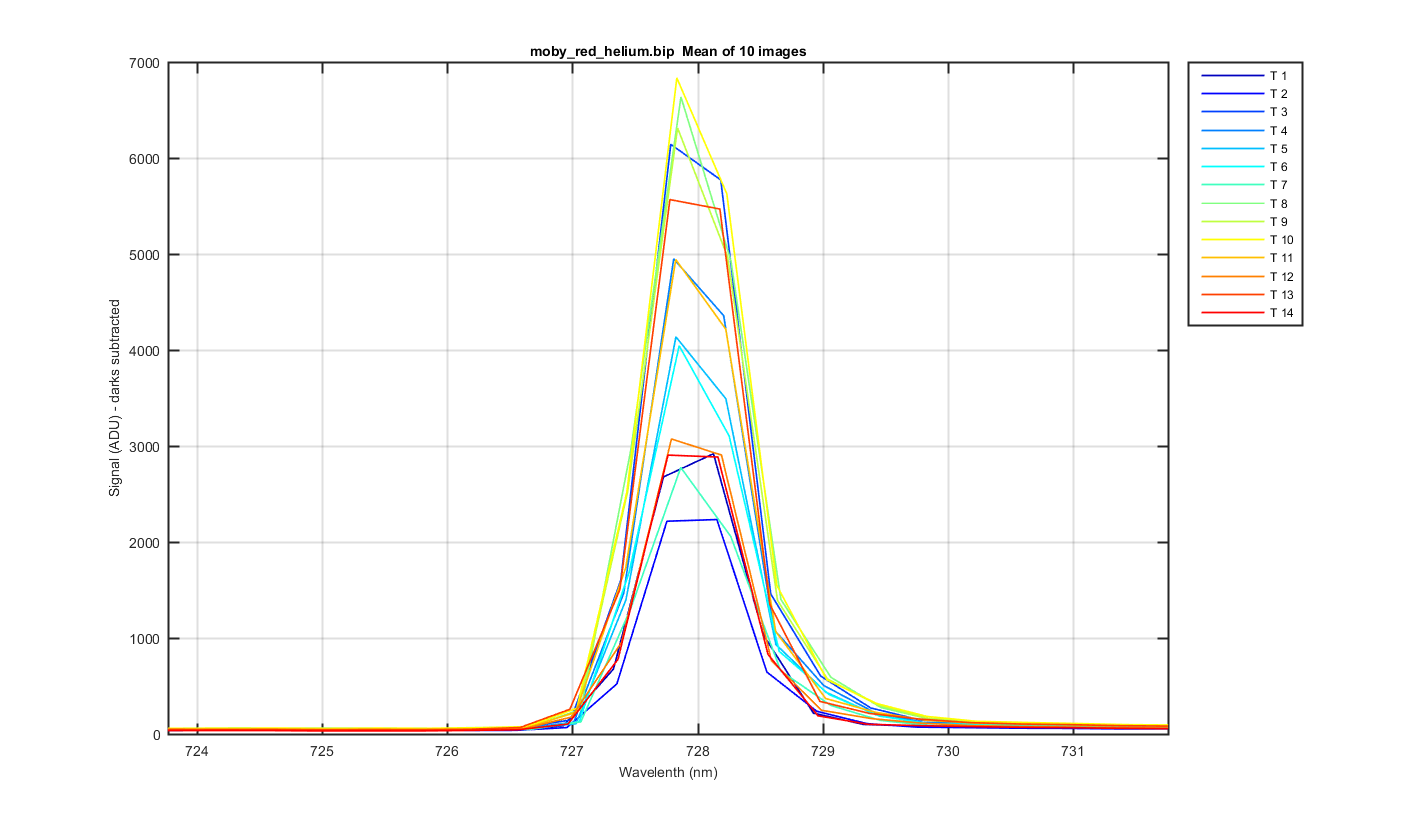
Close up of one of the helium peaks
Figure 14
Close up of one of the helium peaks
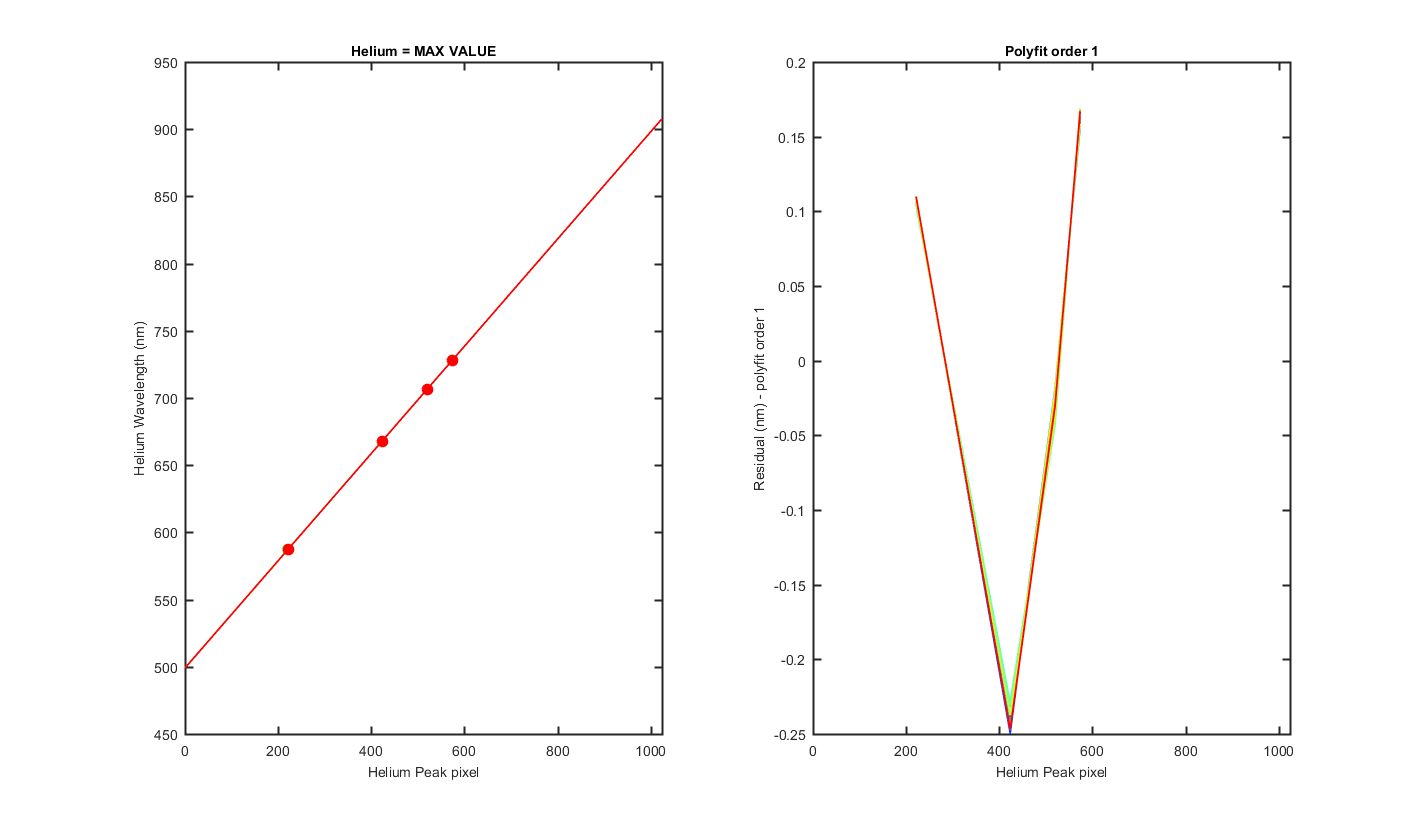
Figure 15
MY VERY ROUGH GUESS AT A WAVELENGTH CAL!!! THIS ASSUMES I GUESS CORRECTLY WHICH PEAKS WHERE WHICH HELIUM LINES. Originally I had ~ 506.51, 921.42, but after Mikes email I drop the peak at 683 and changed from 2nd order to linear. Mikes says "pix #1 = 504.70, pix #1024 = 911.97, with pixel separation = 0.40 nm" And Casey says "The spectral range of the system is 503.7 nm to 911.4 nm"
Track, Min,    Max,     diff,    P
    1, 499.46, 907.71,  0.40   0.399070 499.060035
    2, 499.50, 907.73,  0.40   0.399048 499.100213
    3, 499.54, 907.75,  0.40   0.399032 499.139879
    4, 499.57, 907.77,  0.40   0.399019 499.171244
    5, 499.59, 907.78,  0.40   0.399013 499.191676
    6, 499.64, 907.79,  0.40   0.398968 499.243860
    7, 499.65, 907.80,  0.40   0.398971 499.255480
    8, 499.66, 907.80,  0.40   0.398968 499.257564
    9, 499.62, 907.78,  0.40   0.398982 499.223210
   10, 499.60, 907.79,  0.40   0.399019 499.196288
   11, 499.59, 907.78,  0.40   0.399018 499.188246
   12, 499.54, 907.76,  0.40   0.399035 499.144492
   13, 499.52, 907.75,  0.40   0.399048 499.123581
   14, 499.47, 907.76,  0.40   0.399114 499.070759
Figure 16
  Track = The Resonon Track number
Lwave = Laser Wavelength
Lpix1 = Laser Pixel found using the max value of the track
Lpix2 = Laser Pixel found using mygaussfit to fit the laser peak
| Track | Lwave | Lpix1 | Lpix2 |
|---|---|---|---|
| 1 | 587.5621 | 221 | 221.50 |
| 1 | 667.8151 | 423 | 423.47 |
| 1 | 706.519 | 520 | 519.93 |
| 1 | 728.1349 | 574 | 573.61 |
| 2 | 587.5621 | 221 | 221.41 |
| 2 | 667.8151 | 423 | 423.41 |
| 2 | 706.519 | 520 | 519.85 |
| 2 | 728.1349 | 574 | 573.55 |
| 3 | 587.5621 | 221 | 221.32 |
| 3 | 667.8151 | 423 | 423.34 |
| 3 | 706.519 | 520 | 519.75 |
| 3 | 728.1349 | 573 | 573.48 |
| 4 | 587.5621 | 221 | 221.25 |
| 4 | 667.8151 | 423 | 423.26 |
| 4 | 706.519 | 520 | 519.69 |
| 4 | 728.1349 | 573 | 573.42 |
| 5 | 587.5621 | 221 | 221.21 |
| 5 | 667.8151 | 423 | 423.21 |
| 5 | 706.519 | 520 | 519.65 |
| 5 | 728.1349 | 573 | 573.39 |
| 6 | 587.5621 | 221 | 221.11 |
| 6 | 667.8151 | 423 | 423.09 |
| 6 | 706.519 | 520 | 519.63 |
| 6 | 728.1349 | 573 | 573.29 |
| 7 | 587.5621 | 221 | 221.07 |
| 7 | 667.8151 | 423 | 423.07 |
| 7 | 706.519 | 520 | 519.60 |
| 7 | 728.1349 | 573 | 573.25 |
| 8 | 587.5621 | 221 | 221.07 |
| 8 | 667.8151 | 423 | 423.06 |
| 8 | 706.519 | 520 | 519.60 |
| 8 | 728.1349 | 573 | 573.25 |
| 9 | 587.5621 | 221 | 221.14 |
| 9 | 667.8151 | 423 | 423.15 |
| 9 | 706.519 | 520 | 519.66 |
| 9 | 728.1349 | 573 | 573.32 |
| 10 | 587.5621 | 221 | 221.19 |
| 10 | 667.8151 | 423 | 423.20 |
| 10 | 706.519 | 520 | 519.63 |
| 10 | 728.1349 | 573 | 573.36 |
| 11 | 587.5621 | 221 | 221.21 |
| 11 | 667.8151 | 423 | 423.22 |
| 11 | 706.519 | 520 | 519.67 |
| 11 | 728.1349 | 573 | 573.37 |
| 12 | 587.5621 | 221 | 221.30 |
| 12 | 667.8151 | 423 | 423.31 |
| 12 | 706.519 | 520 | 519.76 |
| 12 | 728.1349 | 573 | 573.44 |
| 13 | 587.5621 | 221 | 221.35 |
| 13 | 667.8151 | 423 | 423.35 |
| 13 | 706.519 | 520 | 519.80 |
| 13 | 728.1349 | 573 | 573.47 |
| 14 | 587.5621 | 221 | 221.44 |
| 14 | 667.8151 | 423 | 423.42 |
| 14 | 706.519 | 520 | 519.85 |
| 14 | 728.1349 | 573 | 573.51 |