REVISION DATE: 23-Apr-2018 13:37:11
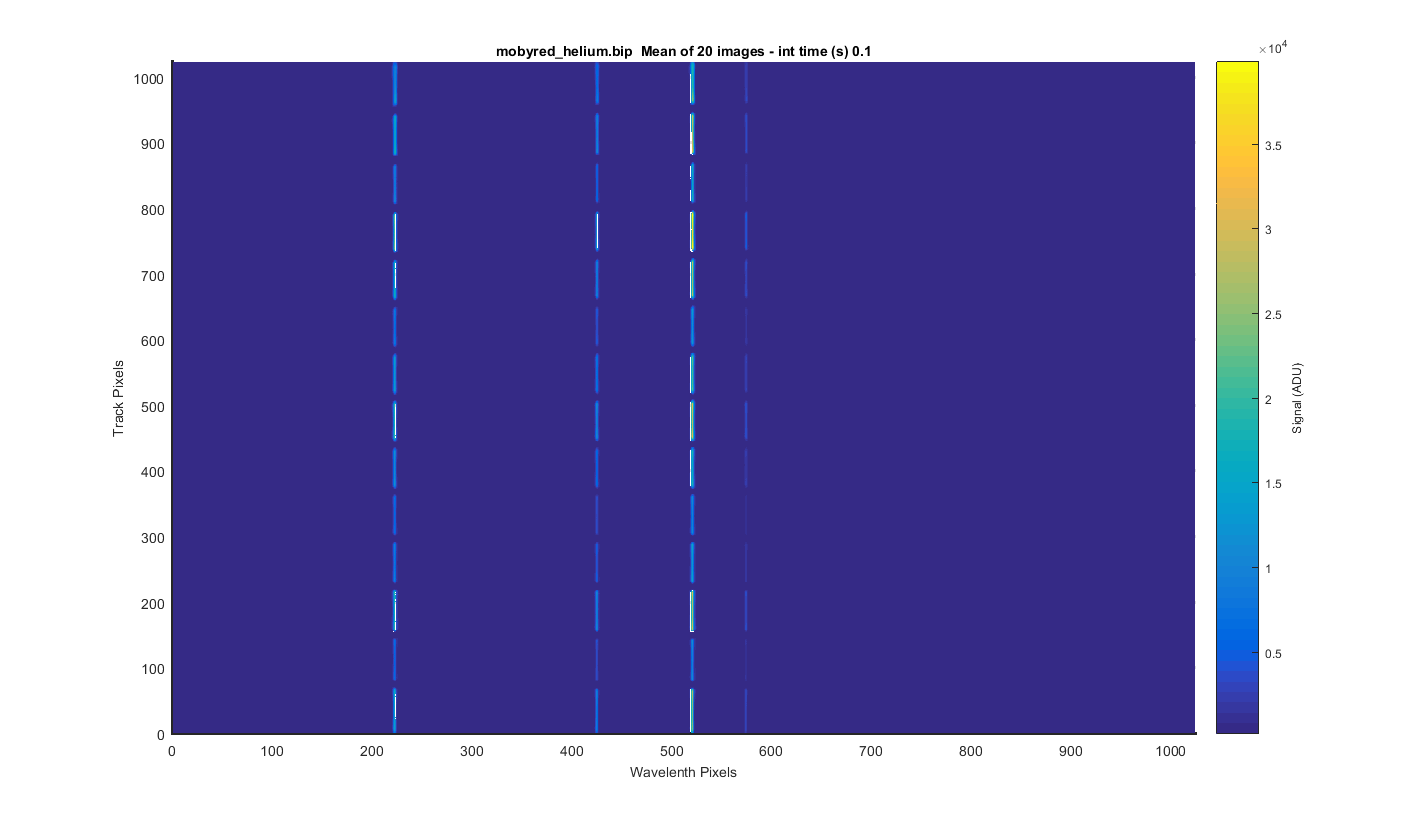
Below are my graphs of the helium.bip file. The file contains 20 dark images at 0.1 sec Note some graphs are dark corrected and some are not so check the axis labels to know what you are looking at.
I should also note that the darks used to subtract had some faint helium lines in them. The helium lines in the darks where very small and are not likely to significanly effect the data.
I took the 20 images and meaned them to get the surface plot below.
Figure 1
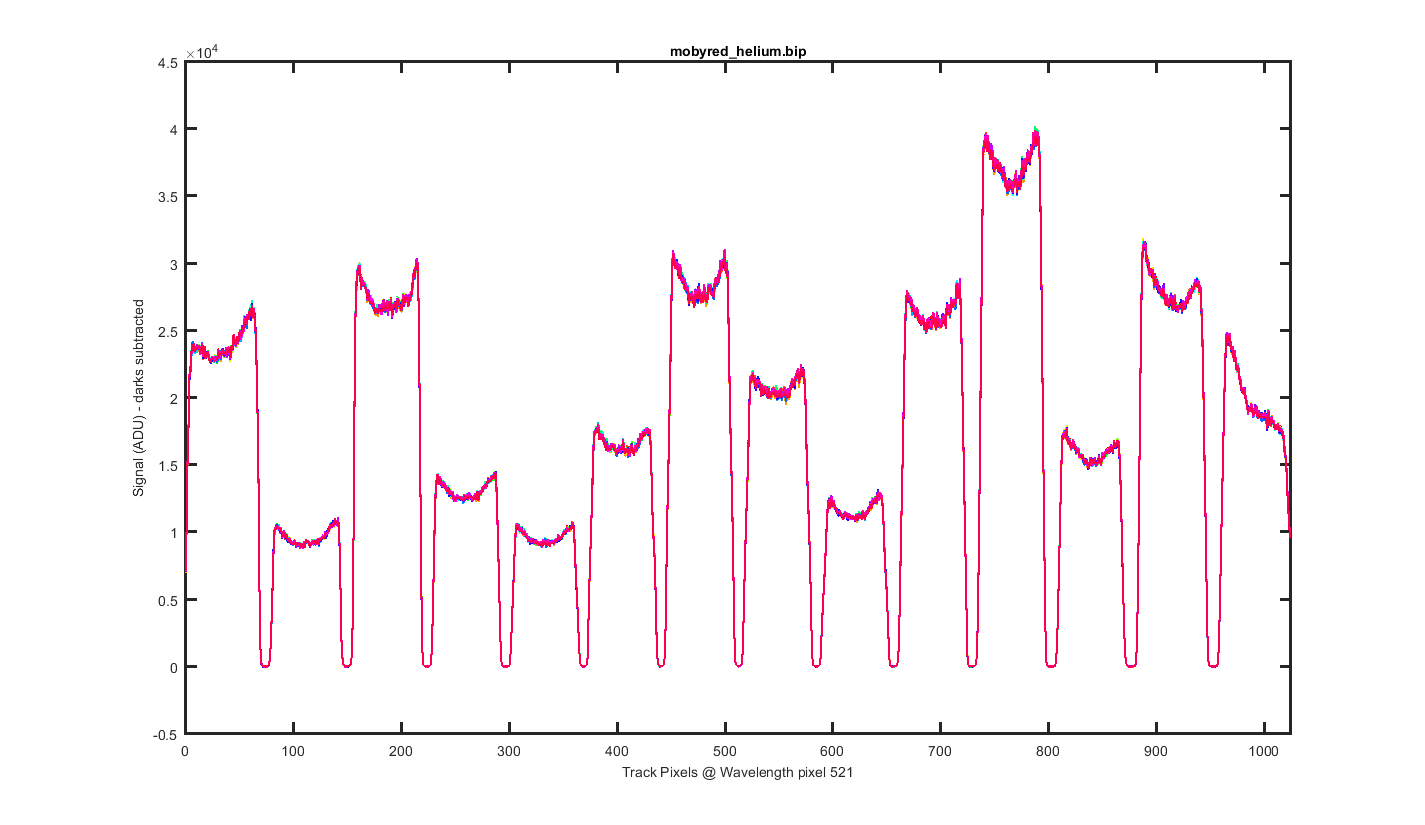
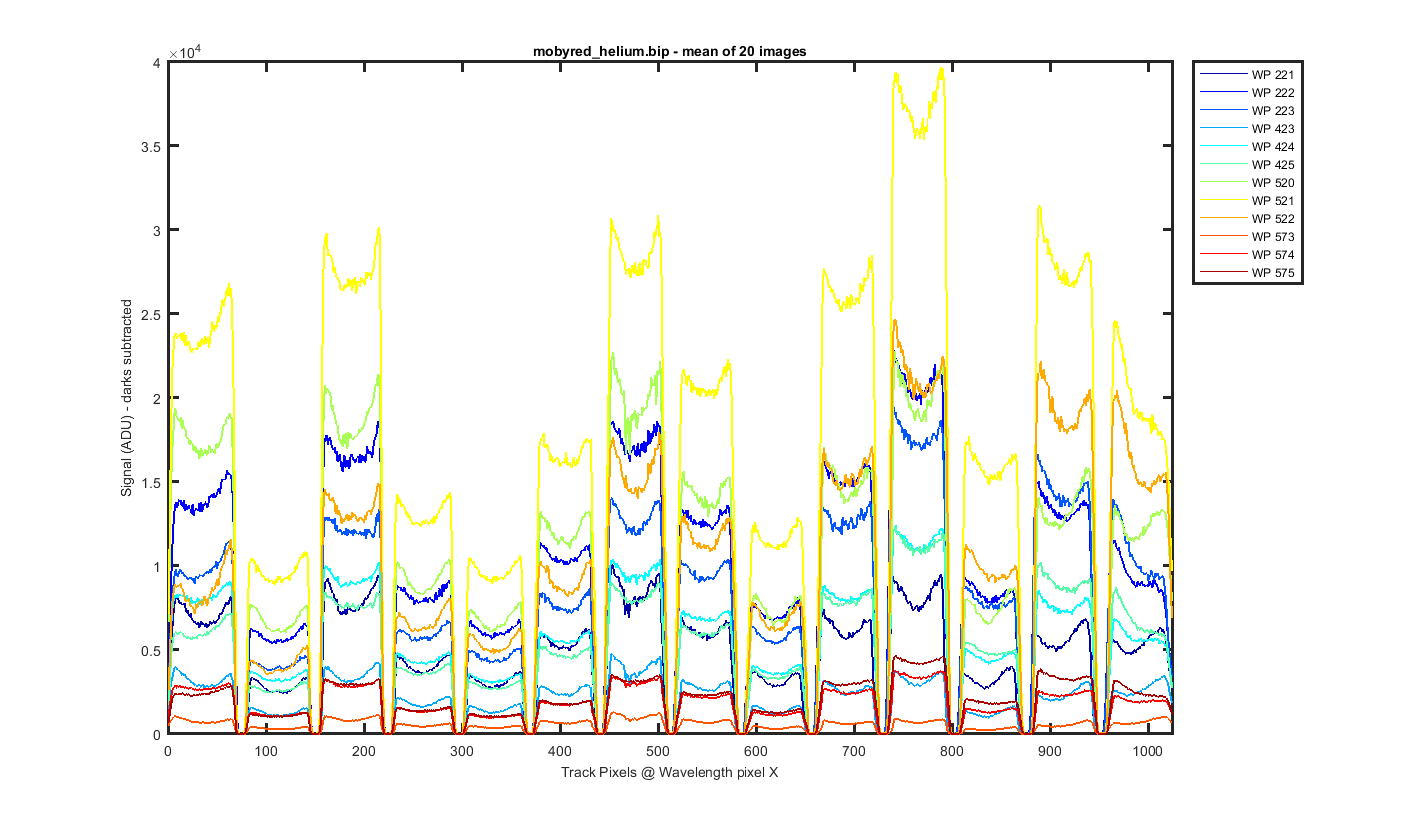
This is a cross section through the tracks at wavelength pixel 521, with one line for each of the 20 images. The tracks and their shapes look really stable.
Figure 2
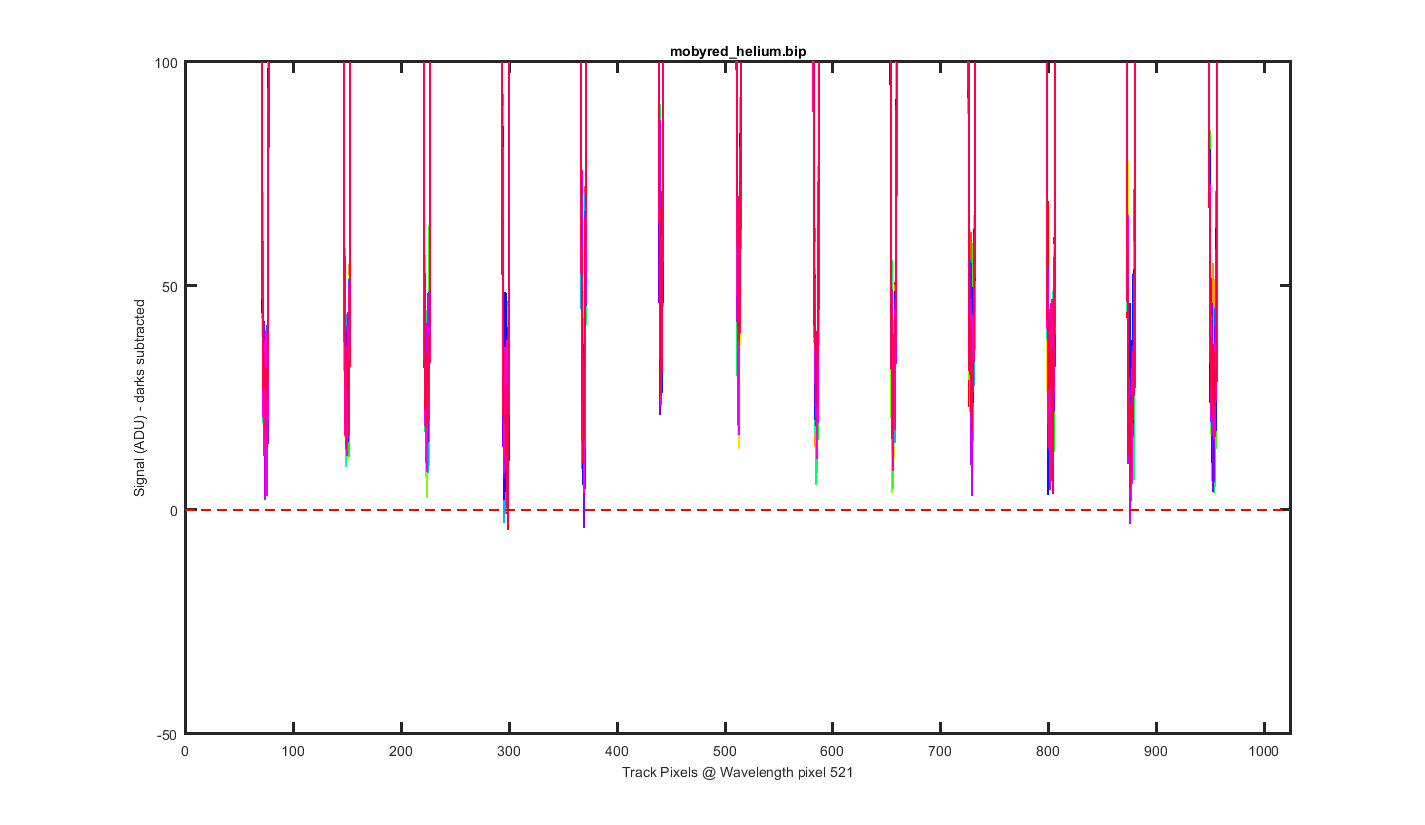
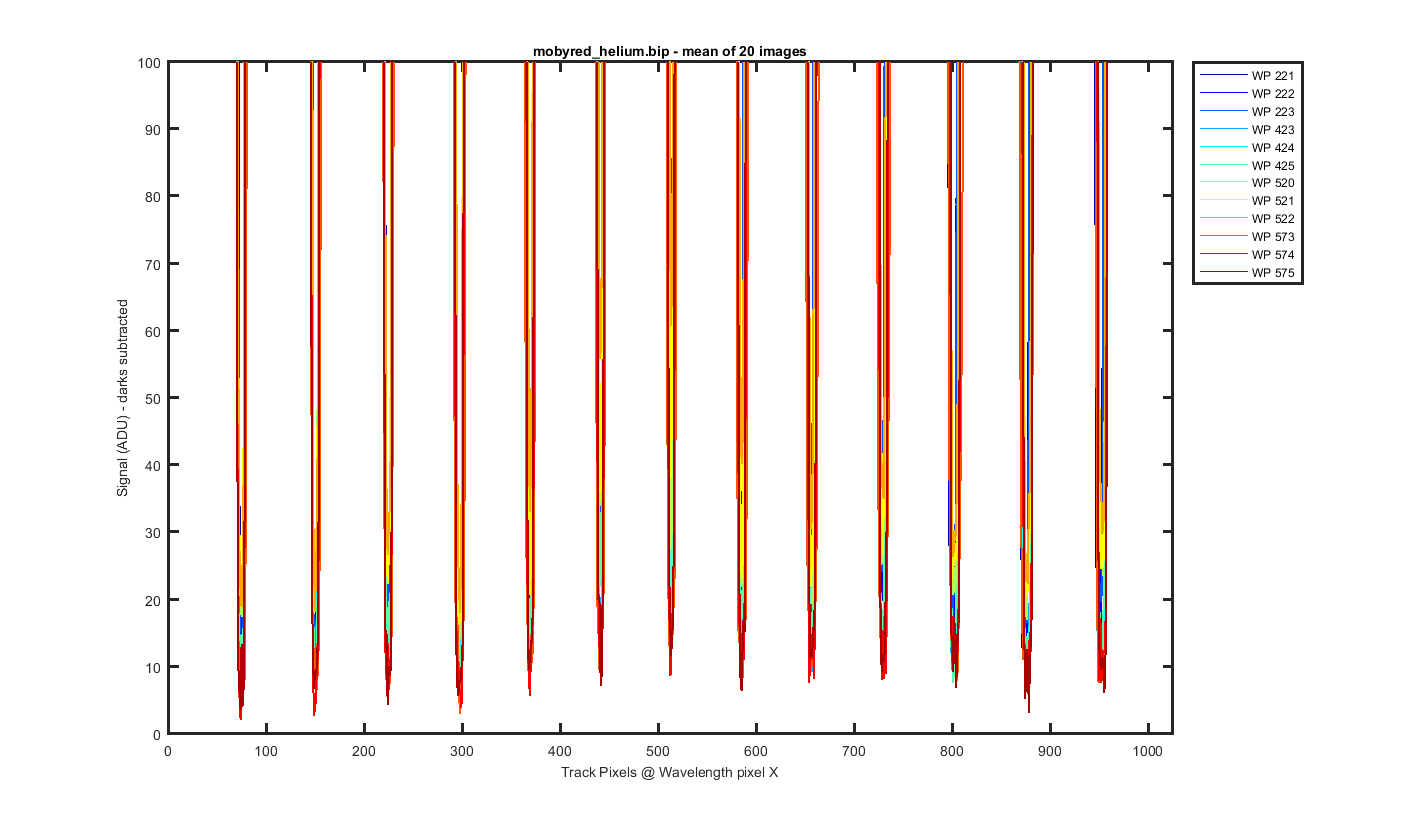
Same as the previous graph but zoomed into the bottom to see the level of the darks between the tracks.
Figure 3
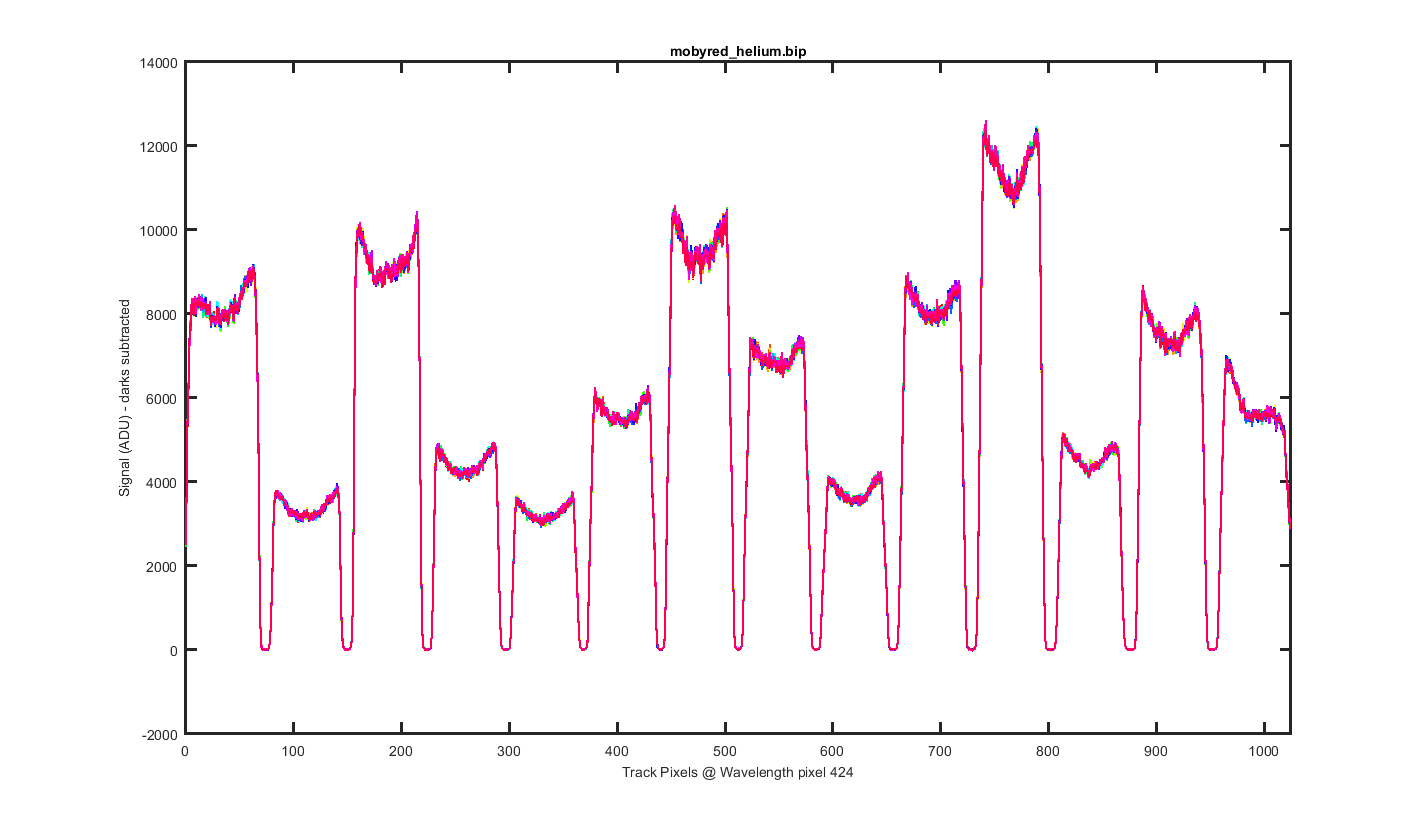
Same as figure 2 but for Wavelength pixel 424.
Figure 4
Again this is the mean image with slices thought the image at different wavelength pixels. The pixels choosen are where the helium peaks are and +- pixel pixel around them.
Figure 5
Same as figure 5 but zoomed to the bottom so you can see the darks between the tracks.
Figure 6
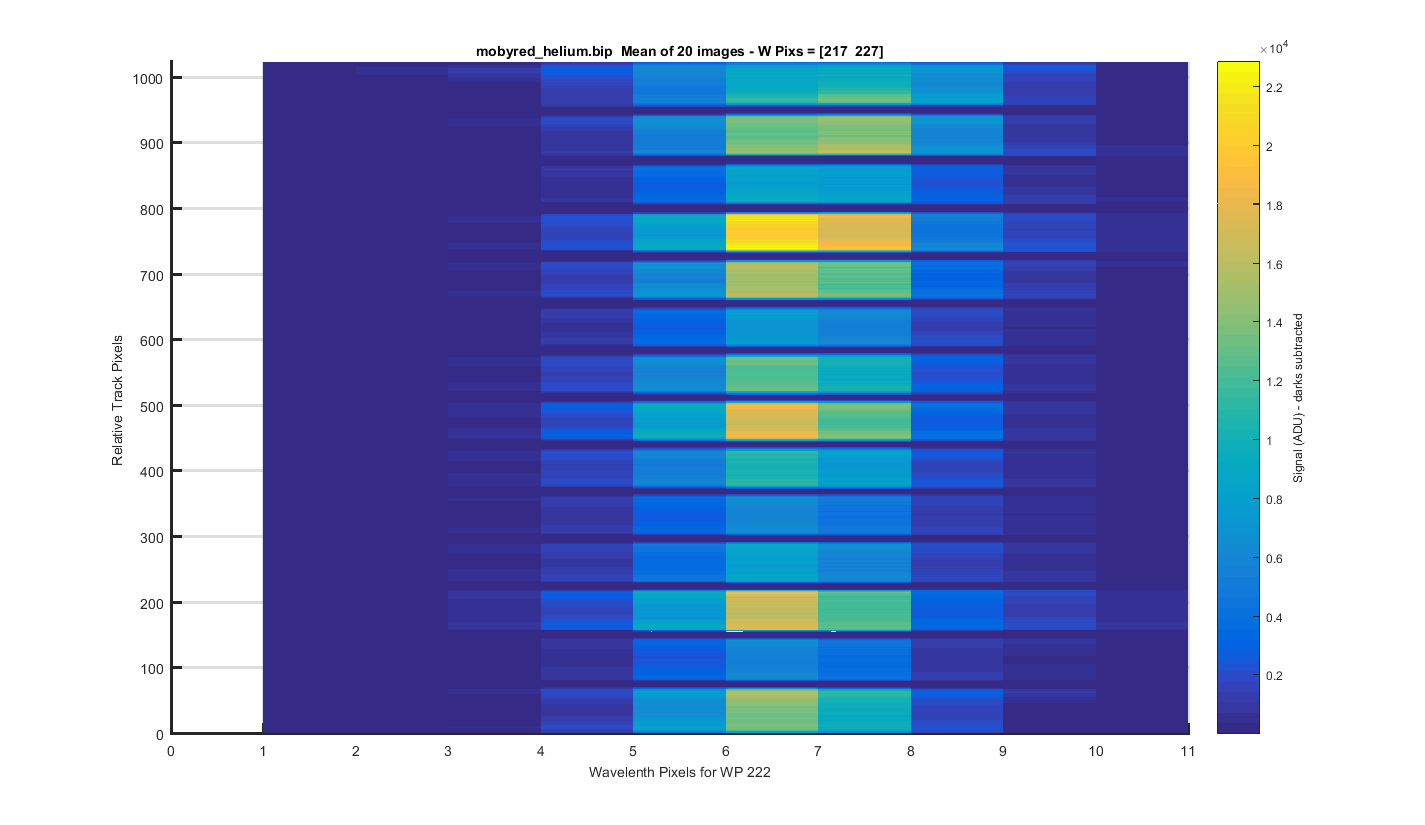
Helium Peak 1 (at pix 222): The same surface plot but showing how individual helium peaks line up from track to track. Looks pretty good!
Figure 7
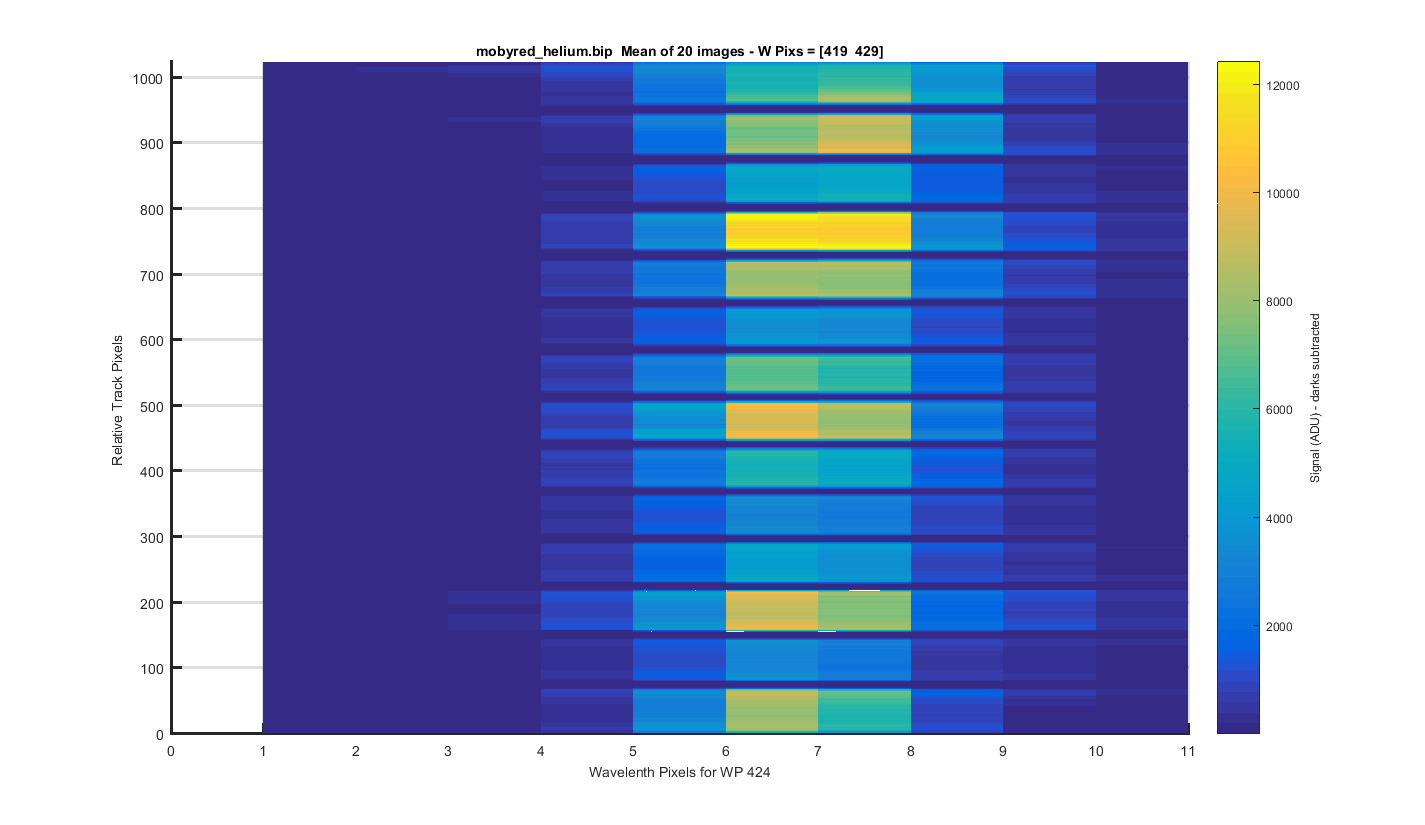
Helium Peak 2 (at pix 424): The same surface plot but showing how individual helium peaks line up from track to track. Looks pretty good!
Figure 8
Helium Peak 3 (at pix 521): The same surface plot but showing how individual helium peaks line up from track to track. Looks pretty good!
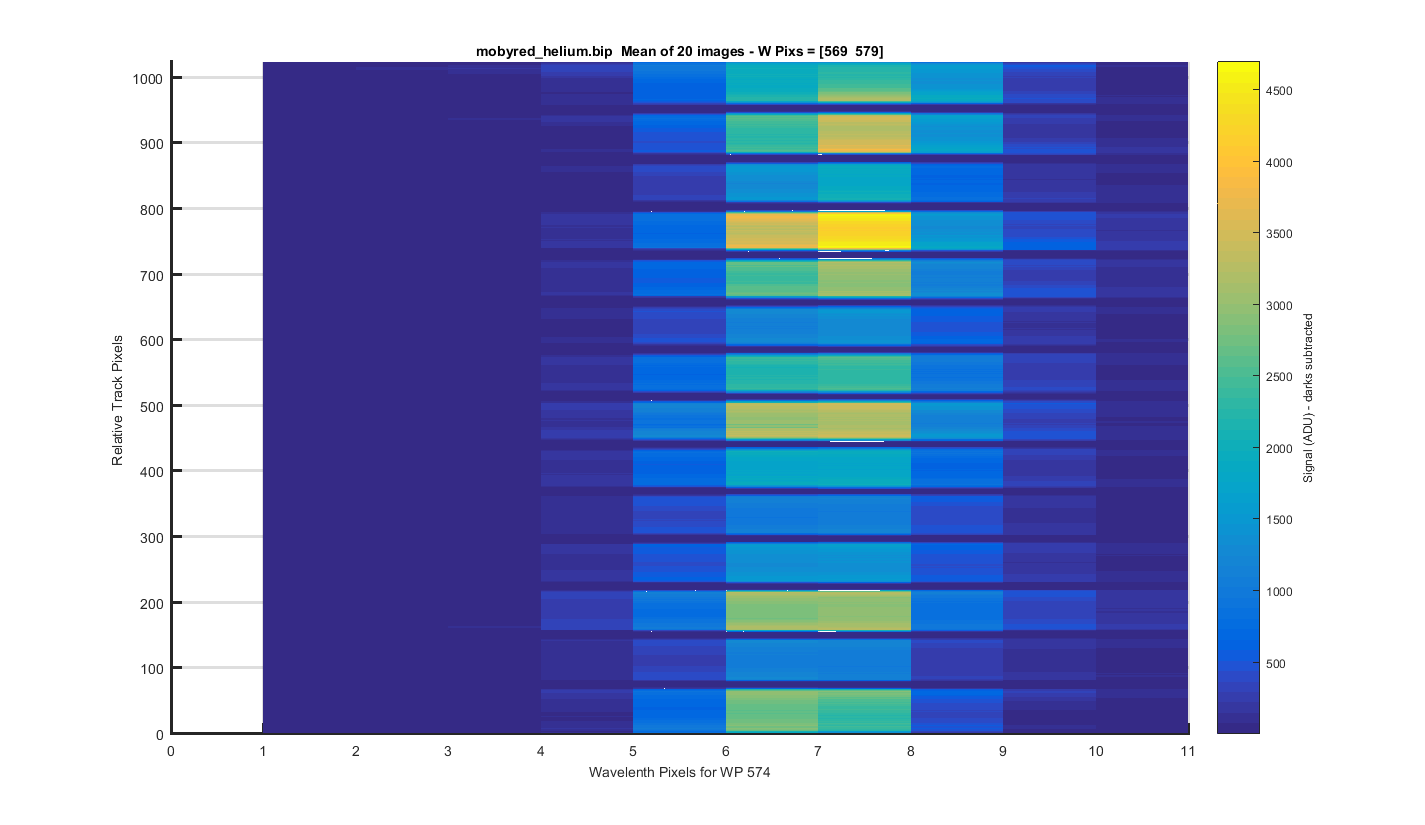
Figure 9
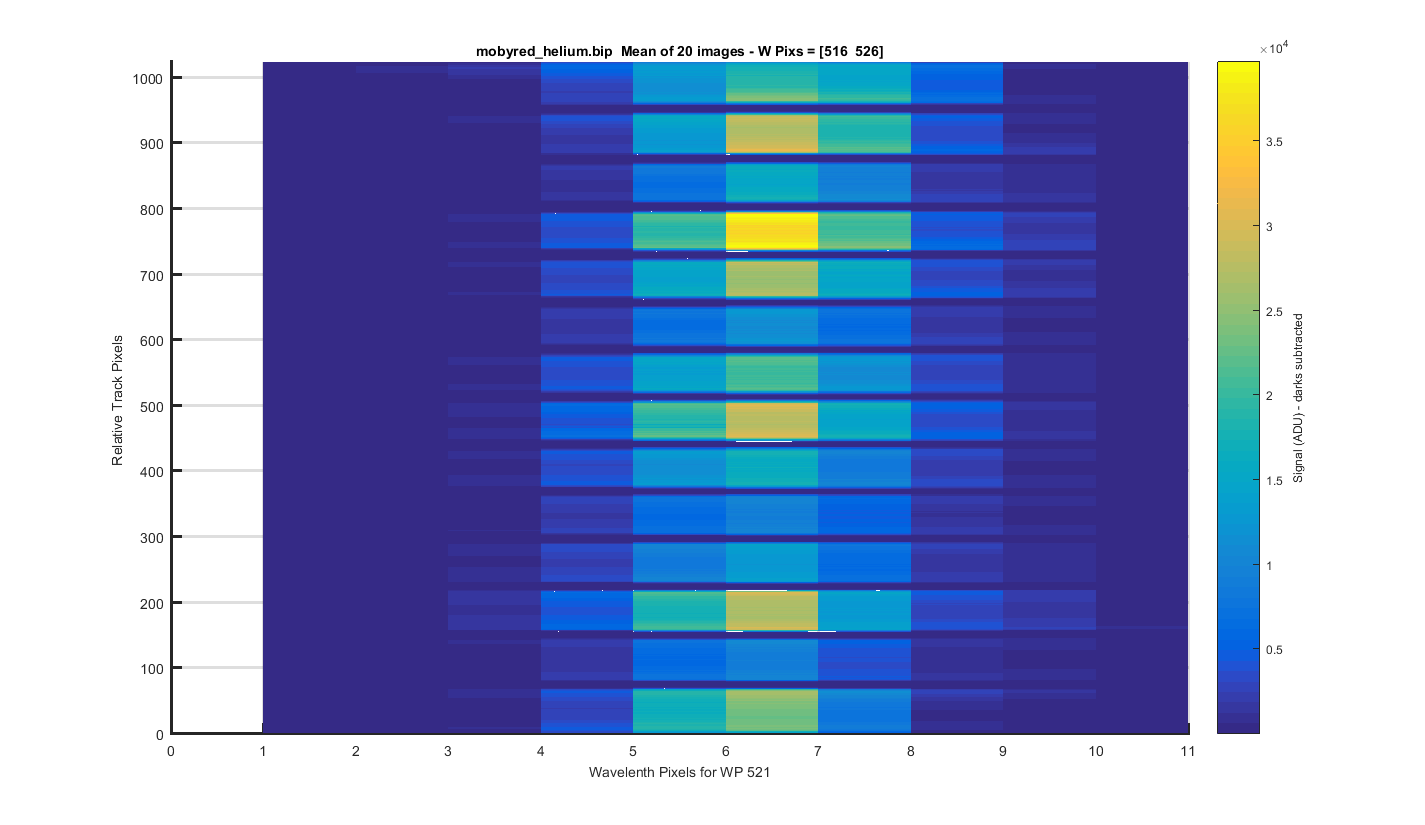
Helium Peak 4 (at pix 574): The same surface plot but showing how individual helium peaks line up from track to track. Looks pretty good!
Figure 10
Mean image binned by track, the x-axis is wavelength pixels.
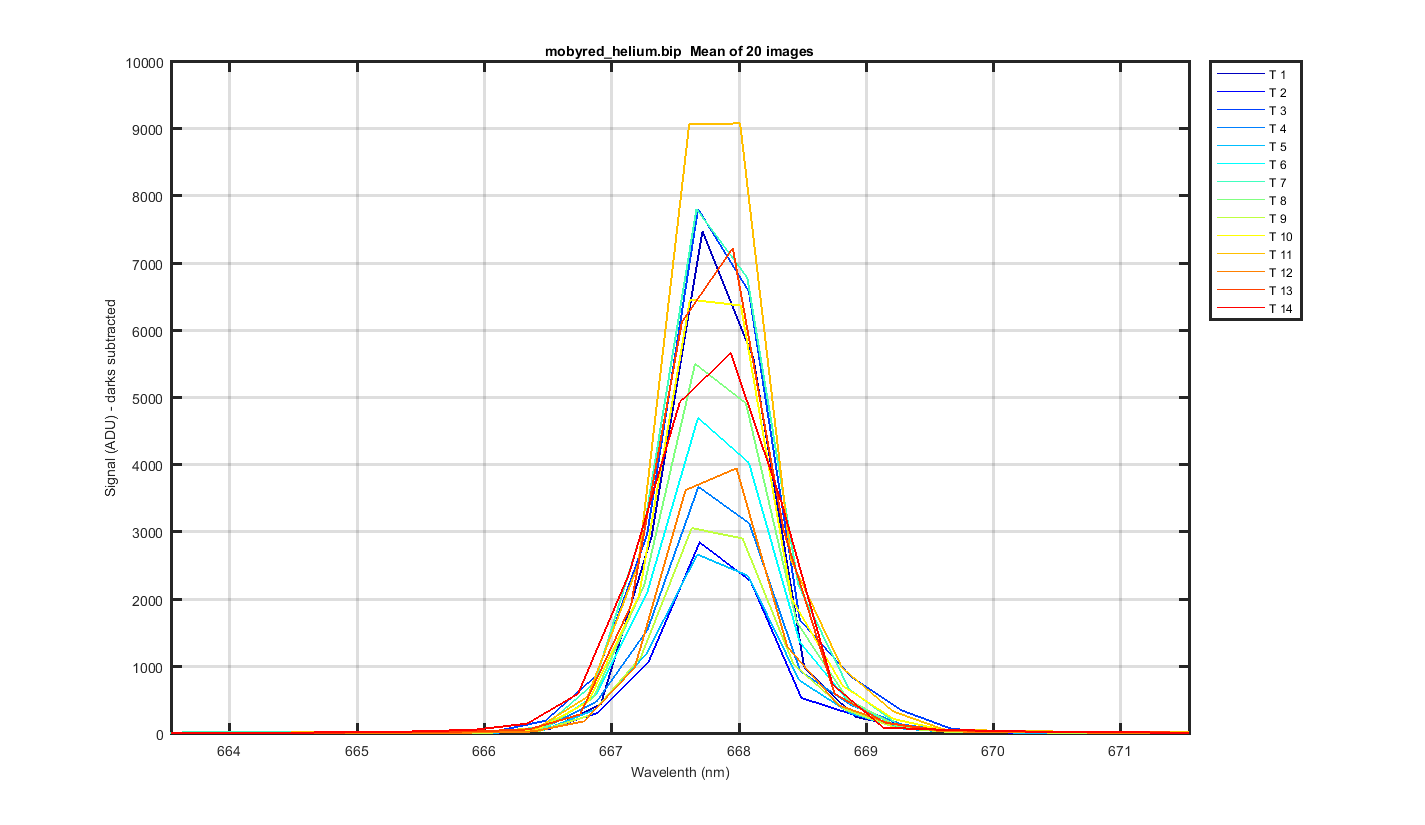
Figure 11
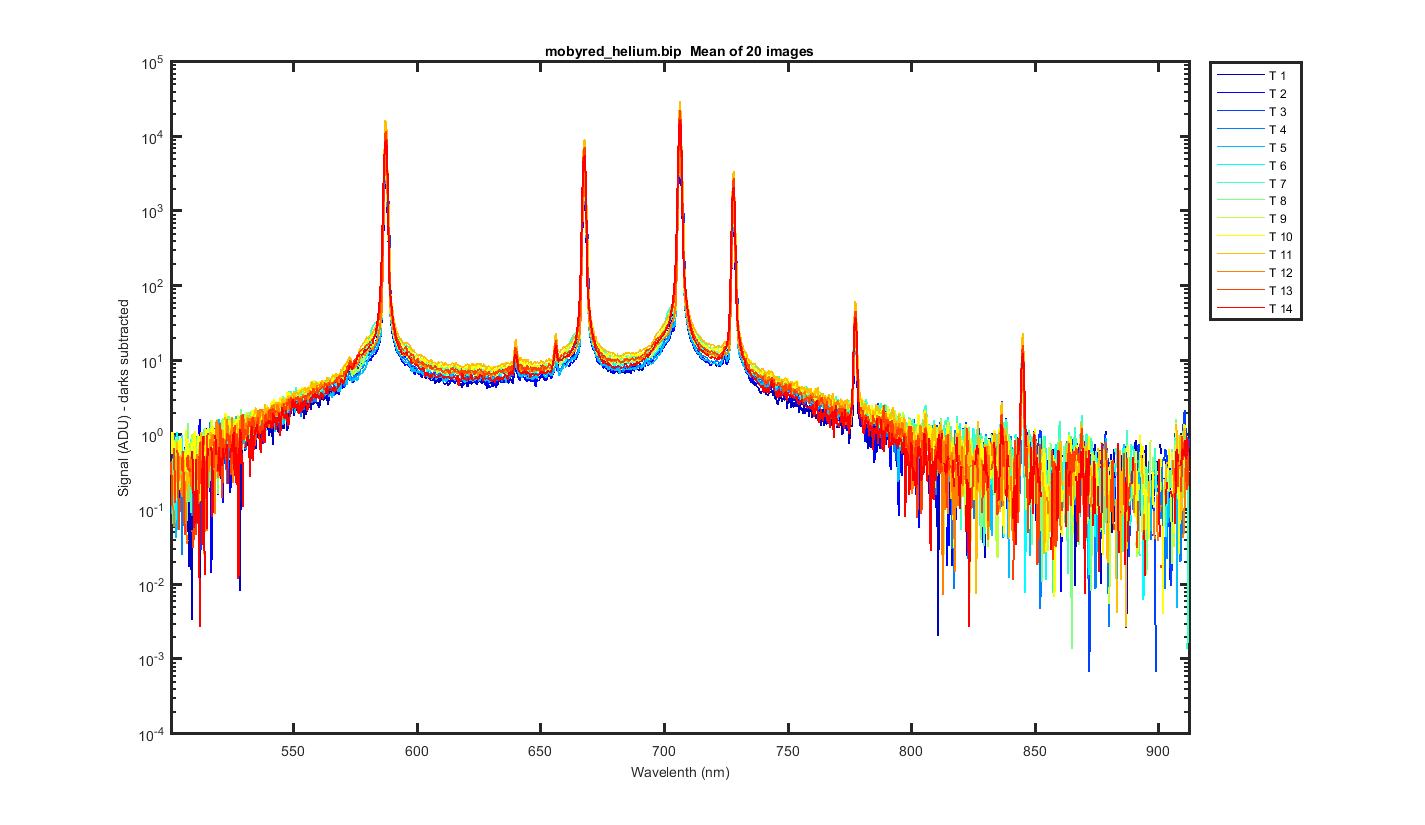
Close up of one of the helium peaks
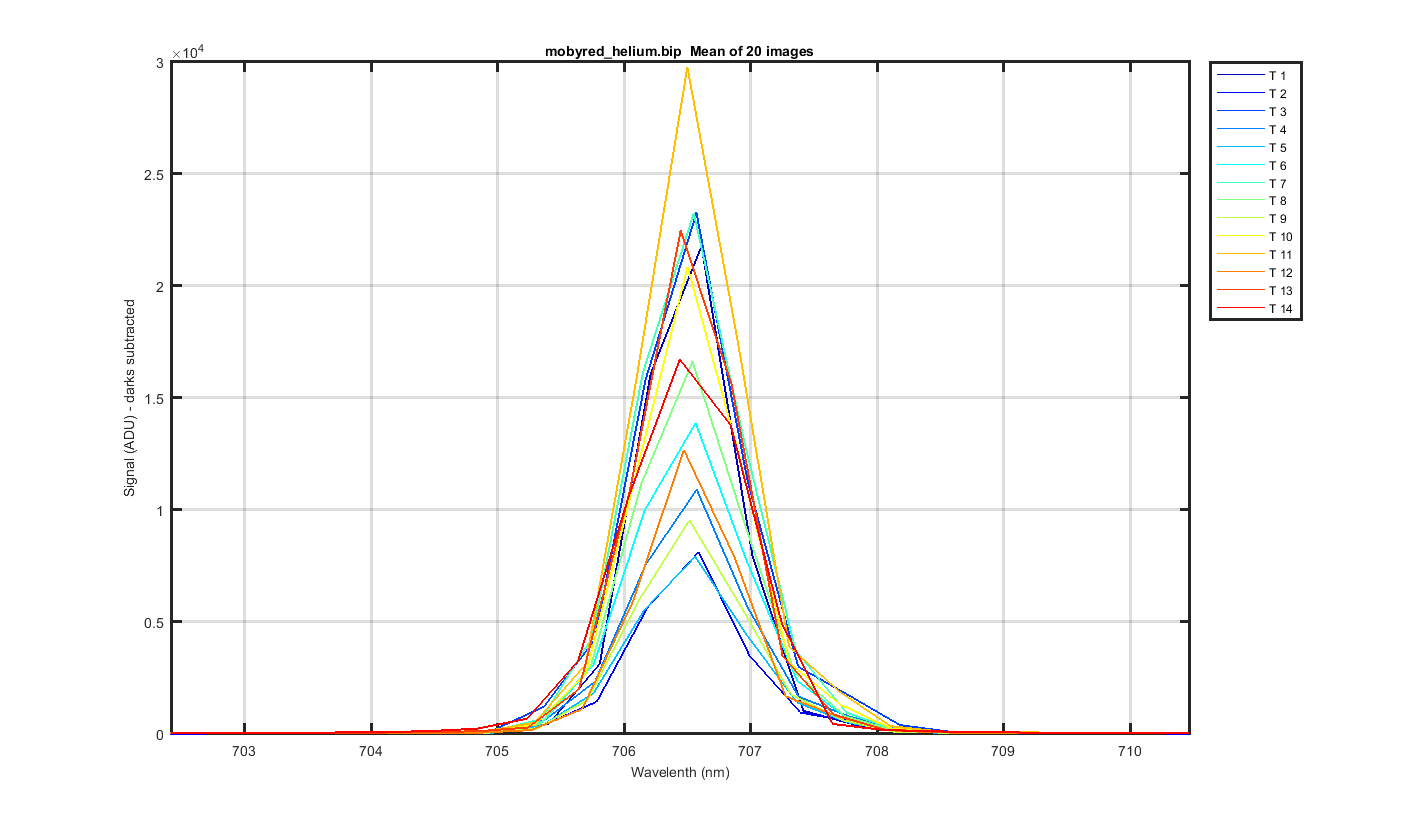
Figure 12
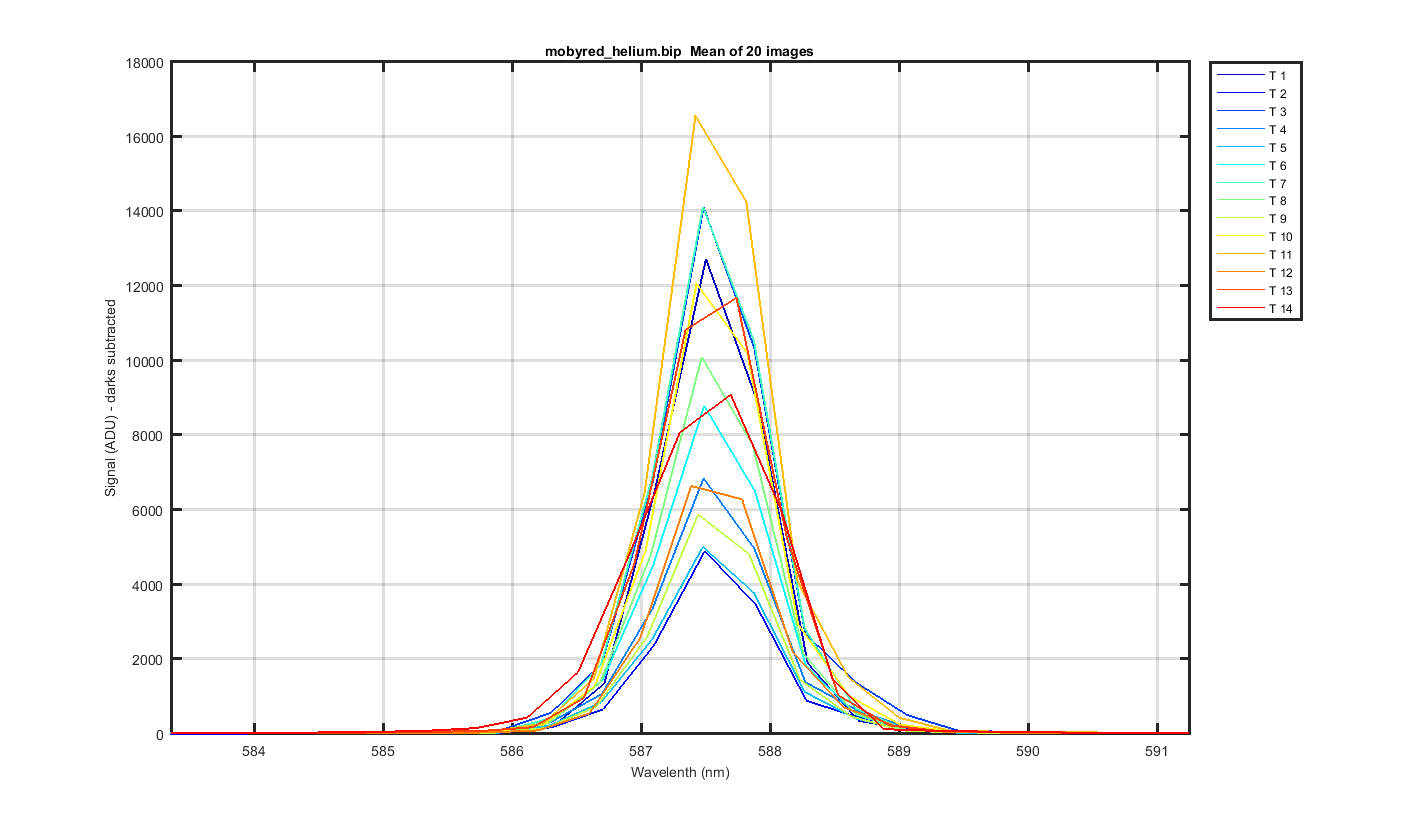
Close up of one of the helium peaks
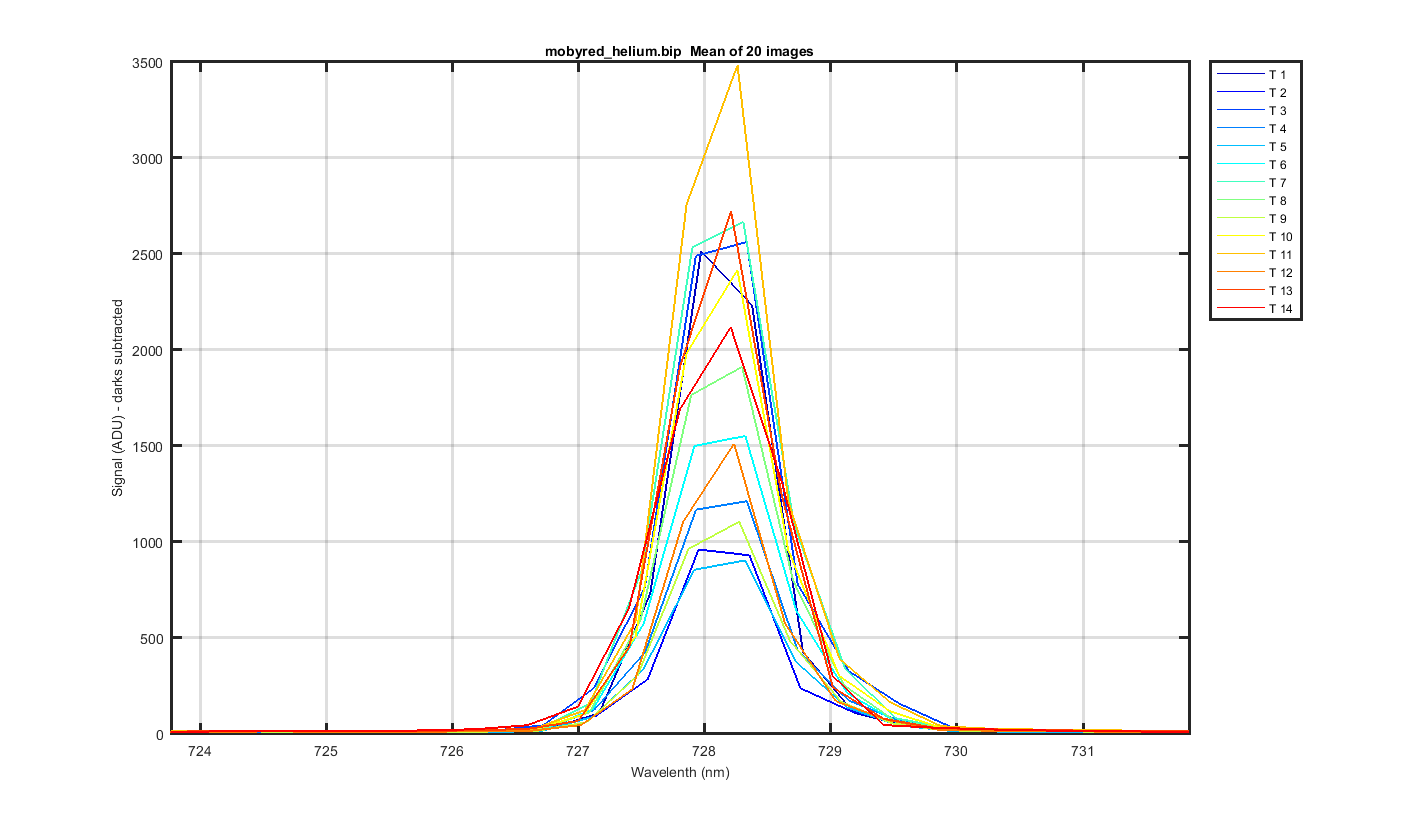
Figure 13
Close up of one of the helium peaks
Figure 14
Close up of one of the helium peaks
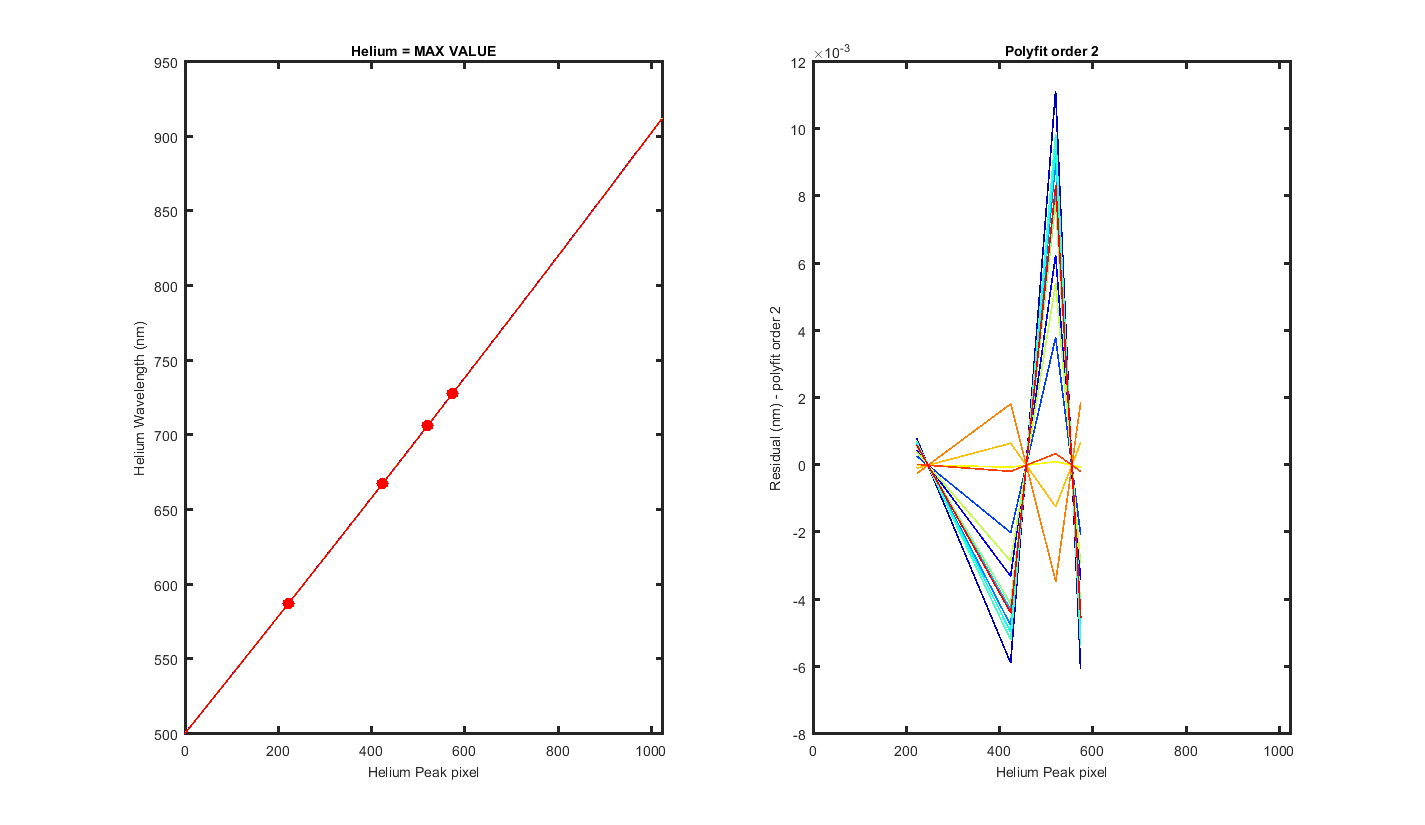
Figure 15
MY VERY ROUGH GUESS AT A WAVELENGTH CAL!!! THIS ASSUMES I GUESS CORRECTLY WHICH PEAKS WHERE WHICH HELIUM LINES. Originally I had ~ 506.51, 921.42, but after Mikes email I drop the peak at 683 and changed from 2nd order to linear. Mikes says "pix #1 = 504.70, pix #1024 = 911.97, with pixel separation = 0.40 nm"
Track, Min,    Max,     diff,    P
    1, 500.97, 912.29,  0.40   0.000013 0.388628  500.578839
    2, 500.99, 912.34,  0.40   0.000013 0.388416  500.605504
    3, 500.98, 912.25,  0.40   0.000013 0.388488  500.586599
    4, 500.96, 912.23,  0.40   0.000013 0.388560  500.575309
    5, 500.96, 912.19,  0.40   0.000013 0.388560  500.570863
    6, 500.97, 912.18,  0.40   0.000013 0.388548  500.585225
    7, 500.96, 912.14,  0.40   0.000013 0.388559  500.575257
    8, 500.96, 912.14,  0.40   0.000013 0.388530  500.570366
    9, 500.93, 912.15,  0.40   0.000013 0.388501  500.546038
   10, 500.92, 912.12,  0.40   0.000013 0.388504  500.533347
   11, 500.92, 912.17,  0.40   0.000013 0.388452  500.531647
   12, 500.88, 912.14,  0.40   0.000013 0.388490  500.491883
   13, 500.81, 912.11,  0.40   0.000013 0.388625  500.423232
   14, 500.72, 912.10,  0.40   0.000013 0.388868  500.332355
Figure 16
  Track = The Resonon Track number
Lwave = Laser Wavelength
Lpix1 = Laser Pixel found using the max value of the track
Lpix2 = Laser Pixel found using mygaussfit to fit the laser peak
| Track | Lwave | Lpix1 | Lpix2 |
|---|---|---|---|
| 1 | 587.56 | 222.00 | 222.15 |
| 1 | 667.82 | 424.00 | 424.26 |
| 1 | 706.52 | 521.00 | 520.73 |
| 1 | 728.13 | 574.00 | 574.41 |
| 2 | 587.56 | 222.00 | 222.18 |
| 2 | 667.82 | 424.00 | 424.31 |
| 2 | 706.52 | 521.00 | 520.80 |
| 2 | 728.13 | 574.00 | 574.46 |
| 3 | 587.56 | 222.00 | 222.20 |
| 3 | 667.82 | 424.00 | 424.34 |
| 3 | 706.52 | 521.00 | 520.85 |
| 3 | 728.13 | 575.00 | 574.51 |
| 4 | 587.56 | 222.00 | 222.20 |
| 4 | 667.82 | 424.00 | 424.34 |
| 4 | 706.52 | 521.00 | 520.83 |
| 4 | 728.13 | 575.00 | 574.51 |
| 5 | 587.56 | 222.00 | 222.21 |
| 5 | 667.82 | 424.00 | 424.36 |
| 5 | 706.52 | 521.00 | 520.86 |
| 5 | 728.13 | 575.00 | 574.54 |
| 6 | 587.56 | 222.00 | 222.19 |
| 6 | 667.82 | 424.00 | 424.35 |
| 6 | 706.52 | 521.00 | 520.85 |
| 6 | 728.13 | 575.00 | 574.54 |
| 7 | 587.56 | 222.00 | 222.21 |
| 7 | 667.82 | 424.00 | 424.38 |
| 7 | 706.52 | 521.00 | 520.88 |
| 7 | 728.13 | 575.00 | 574.58 |
| 8 | 587.56 | 222.00 | 222.24 |
| 8 | 667.82 | 424.00 | 424.40 |
| 8 | 706.52 | 521.00 | 520.92 |
| 8 | 728.13 | 575.00 | 574.60 |
| 9 | 587.56 | 222.00 | 222.31 |
| 9 | 667.82 | 424.00 | 424.47 |
| 9 | 706.52 | 521.00 | 520.98 |
| 9 | 728.13 | 575.00 | 574.65 |
| 10 | 587.56 | 222.00 | 222.34 |
| 10 | 667.82 | 424.00 | 424.49 |
| 10 | 706.52 | 521.00 | 521.03 |
| 10 | 728.13 | 575.00 | 574.68 |
| 11 | 587.56 | 222.00 | 222.36 |
| 11 | 667.82 | 425.00 | 424.51 |
| 11 | 706.52 | 521.00 | 521.04 |
| 11 | 728.13 | 575.00 | 574.68 |
| 12 | 587.56 | 222.00 | 222.45 |
| 12 | 667.82 | 425.00 | 424.57 |
| 12 | 706.52 | 521.00 | 521.11 |
| 12 | 728.13 | 575.00 | 574.75 |
| 13 | 587.56 | 223.00 | 222.55 |
| 13 | 667.82 | 425.00 | 424.65 |
| 13 | 706.52 | 521.00 | 521.17 |
| 13 | 728.13 | 575.00 | 574.81 |
| 14 | 587.56 | 223.00 | 222.67 |
| 14 | 667.82 | 425.00 | 424.70 |
| 14 | 706.52 | 521.00 | 521.16 |
| 14 | 728.13 | 575.00 | 574.83 |