REVISION DATE: 03-Apr-2018 17:04:07
CONFIG 10: 13-Feb-2018 to 07-Mar-2018
In Line PSBS custom made by Mark, aligned on laser bench Pier 35, S/N 2. Test to eliminate PDBS and Fold mirror as source of instability. We took out the PDBS and the fold mirror. PD2 is connected to the through channel and PD1 has a 9V battery. FISH Fibers, SIRCUS Sphere, Yuqin Zong's white LED source, monitor with Si PD and SEI. * E1 = Day 1: 13-Feb-2018 22degC, 30% RH, no SEI today; chamber humidity went out of control and then recovered. * E2 = Day 2: 14-Feb-2018 22degC, 30% RH; Labview crashed in the middle, creating data gap. * E3 = Day 3: 15-Feb-2018 30degC, 30% RH; humidity control went out of spec at 19:38 then recovered; chamber logging program was finished by then. * E4 = Day 4: 16-Feb-2018 20degC, 30% RH; (forgot I really wanted 22deg C). * E5 = Day 5: 20-Feb-2018 20degC, 30% RH. * E6 = Day 6: 21-Feb-2018 22degC, 40% RH. * E7 = Day 7: 22-Feb-2018 22/30/22degC, 30% RH. * E8 = Day 8: 23-Feb-2018 22degC, 30/40/30% RH. * E9 = Day 9: 26-Feb-2018 22degC, 30% RH, repeat initial runs. The chamber RH took off by itself near the end of the run, so I extended the collection time almost an hour longer to capture re-euqilibrium. * E10 = Day 10: 05-Mar-2018, Chamber door was cracked open over the weekend, was shut for test, but chamber was OFF. Does the initial rate of change of the PD vs the monitor indicate spectral differences? * E11 = Day 11: 06-Mar-2018, 22/30/22 deg C at 30% RH, darks before and after. Time profile was 90/120/90 min * E12 = Day 12: 07-Mar-2018, 22 deg C at 30/40/30 % RH, darks before and after. Time profile was 90/120/90 min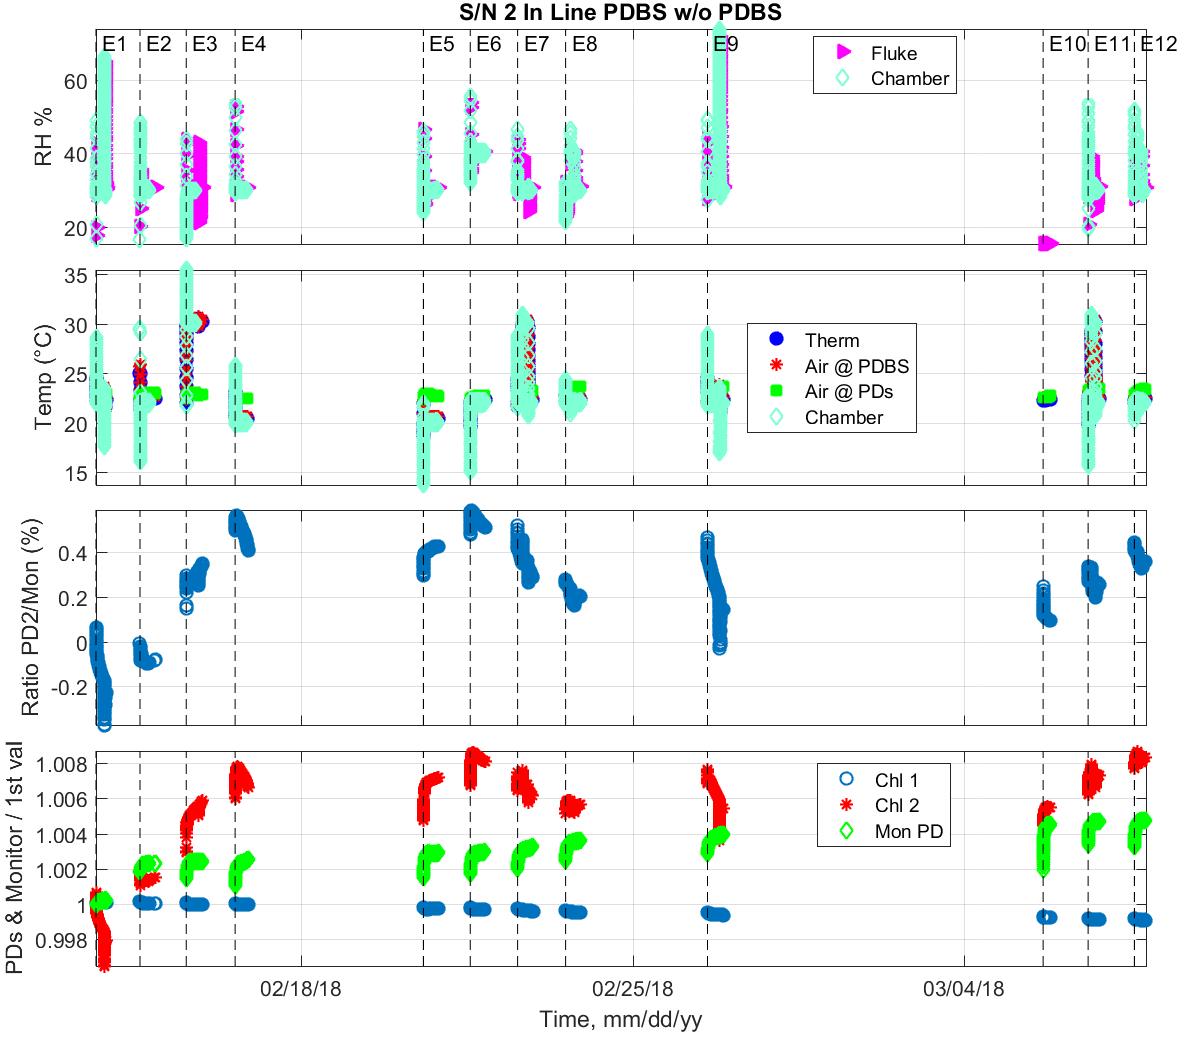
Figure 1: All data in this Configuration to date. PD signals are normalized to the monitor. Ratio PD1/PD2, Monitor, and normalized Signals all normalized to the initial value.
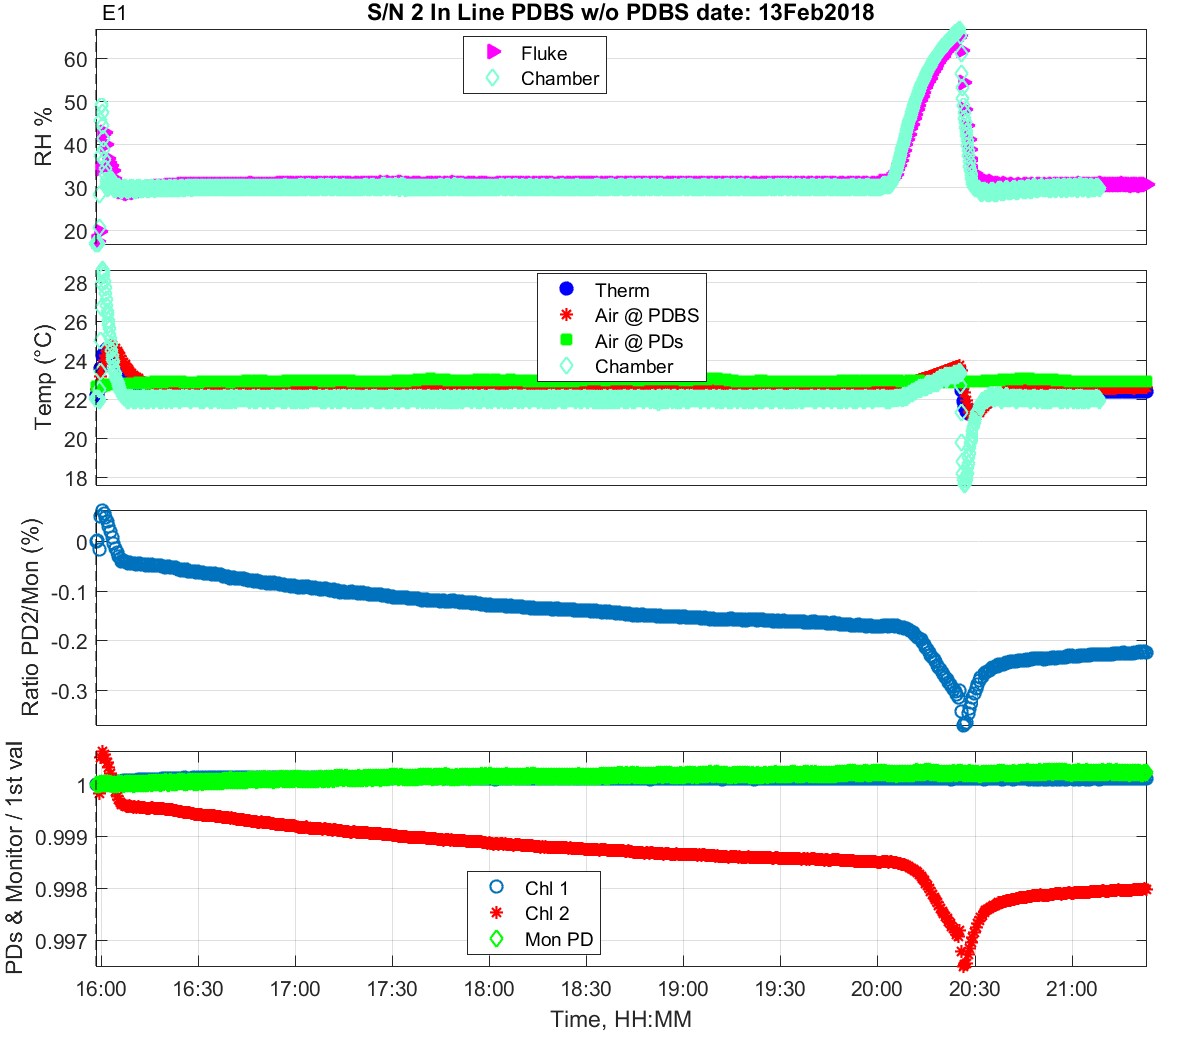
Figure 2: Zoomed in look at Day 1
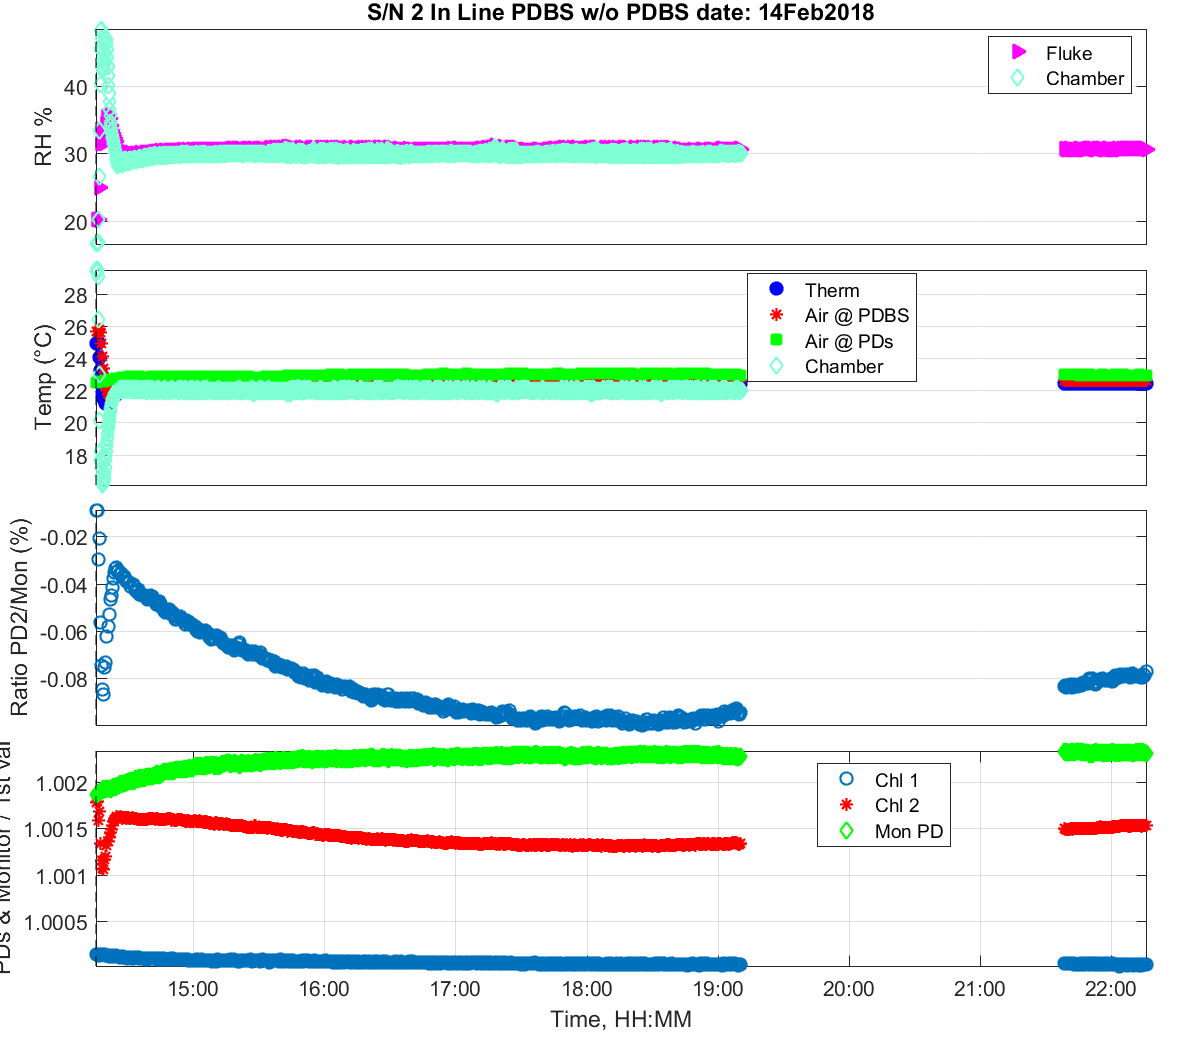
Figure 3: Zoomed in look at Day 2
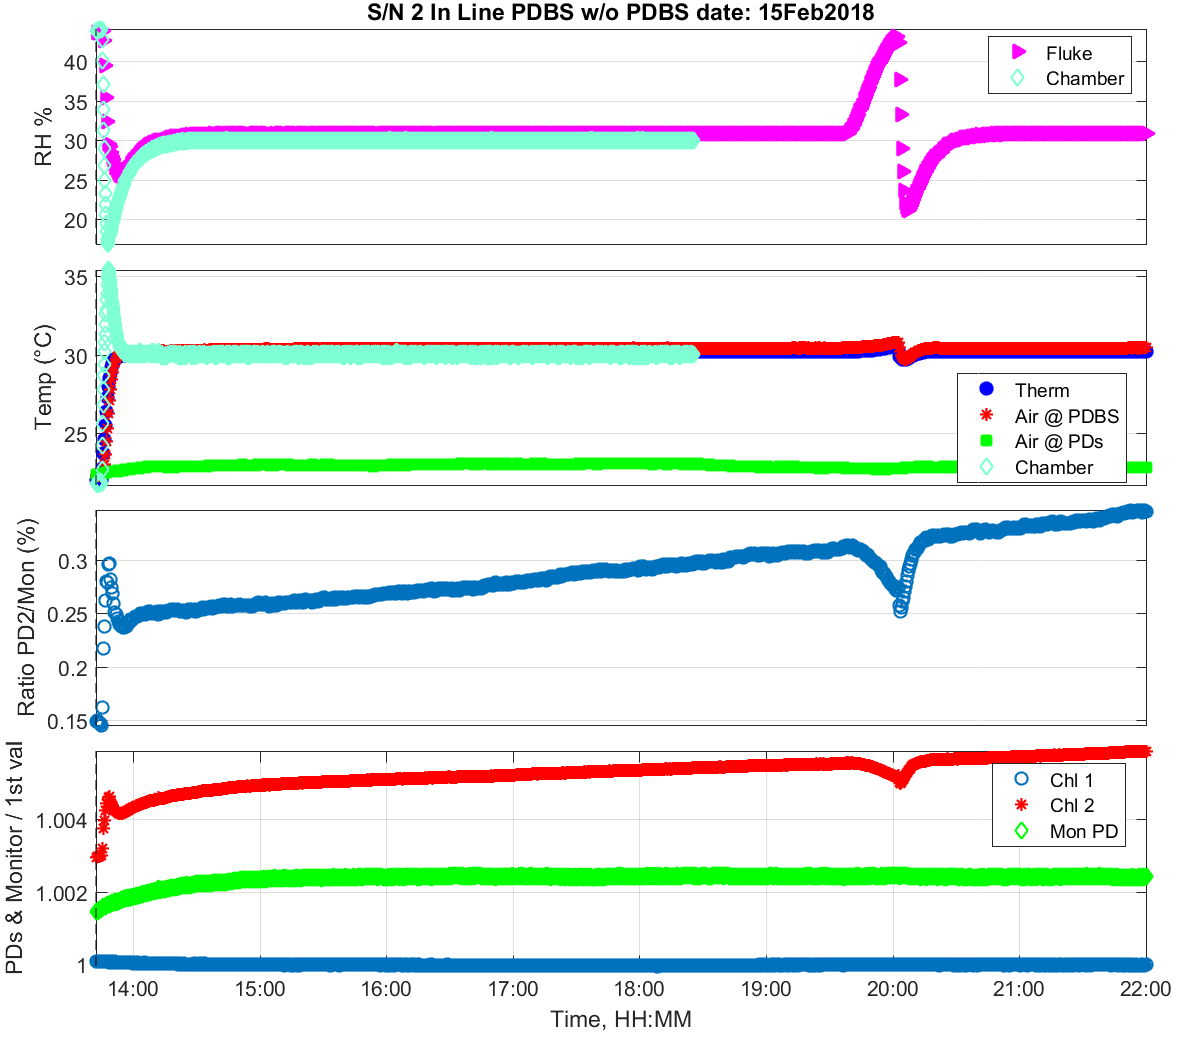
Figure 4: Zoomed in look at Day 3
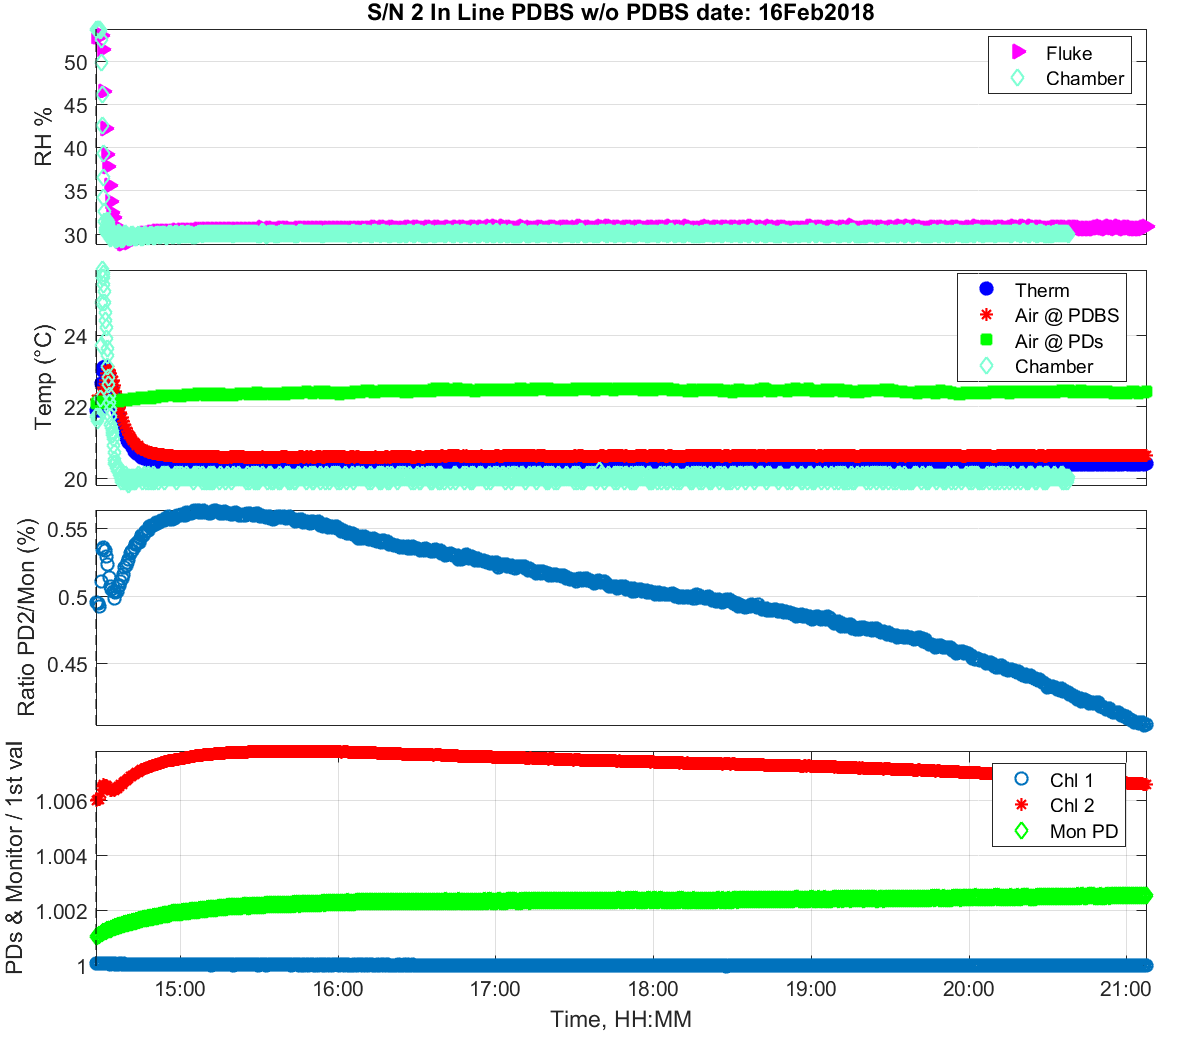
Figure 5: Zoomed in look at Day 4
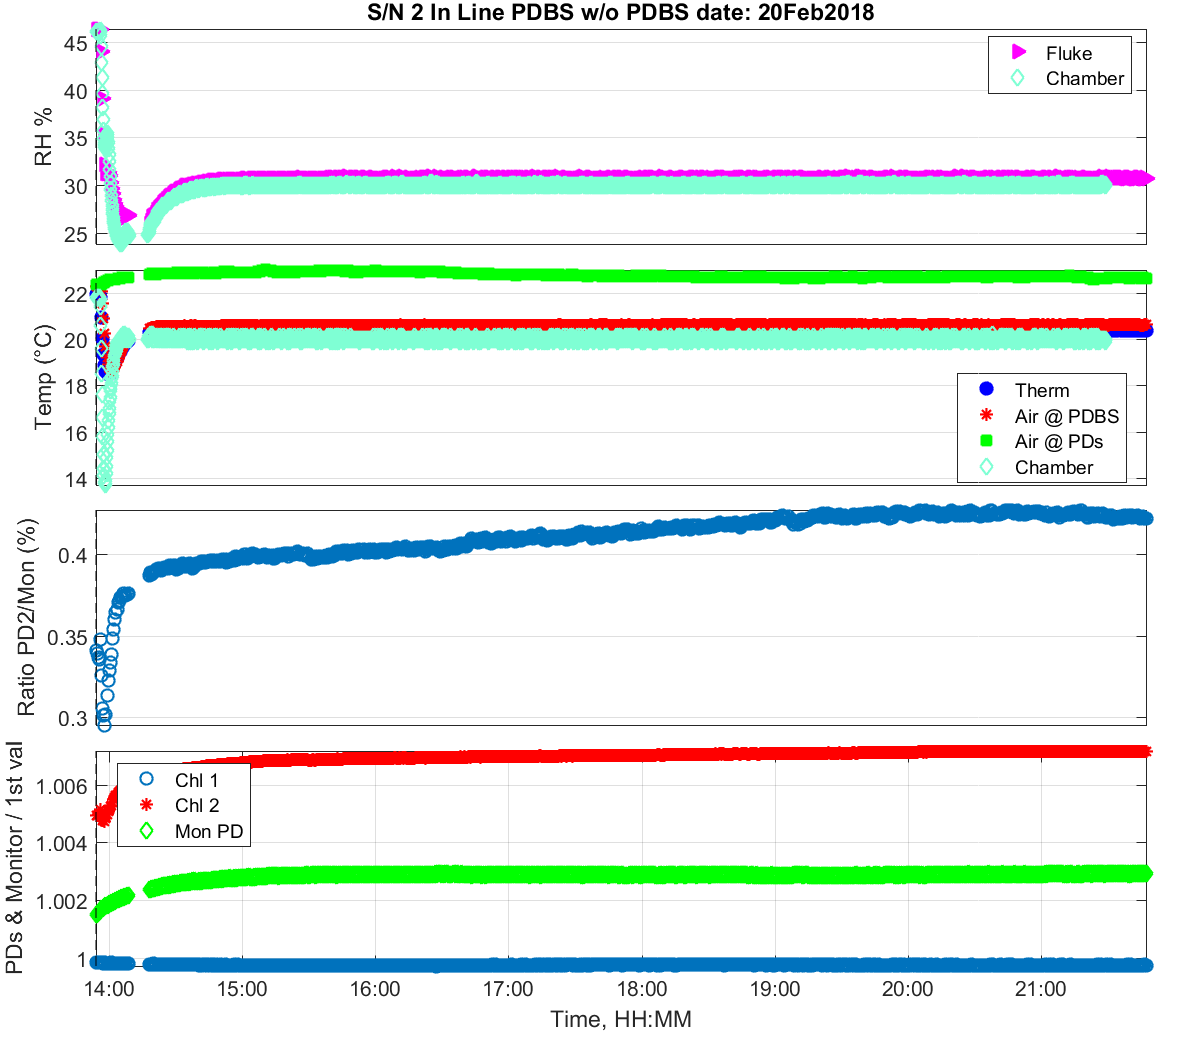
Figure 6: Zoomed in look at Day 5
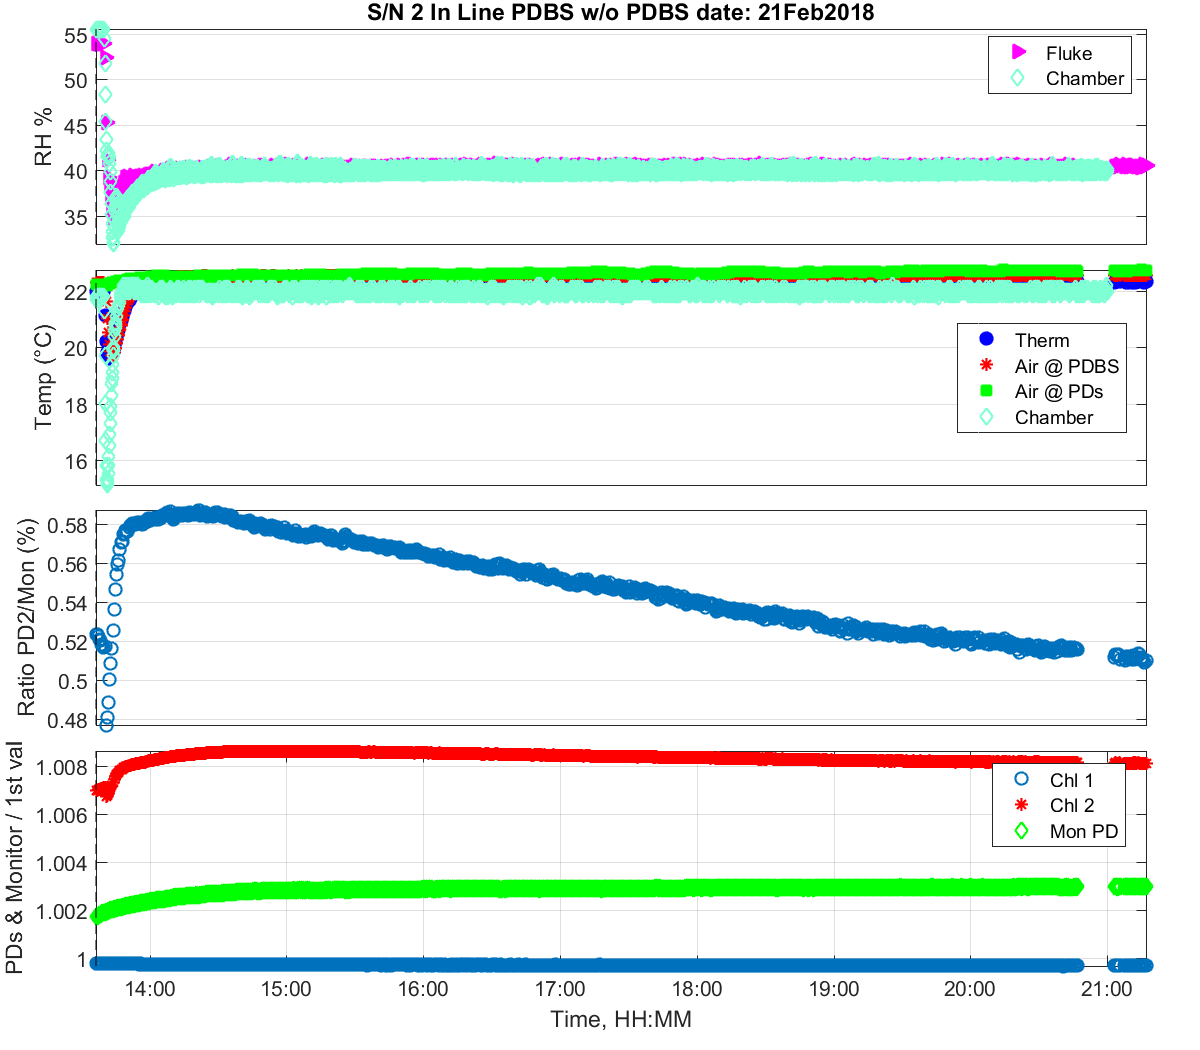
Figure 7: Zoomed in look at Day 6
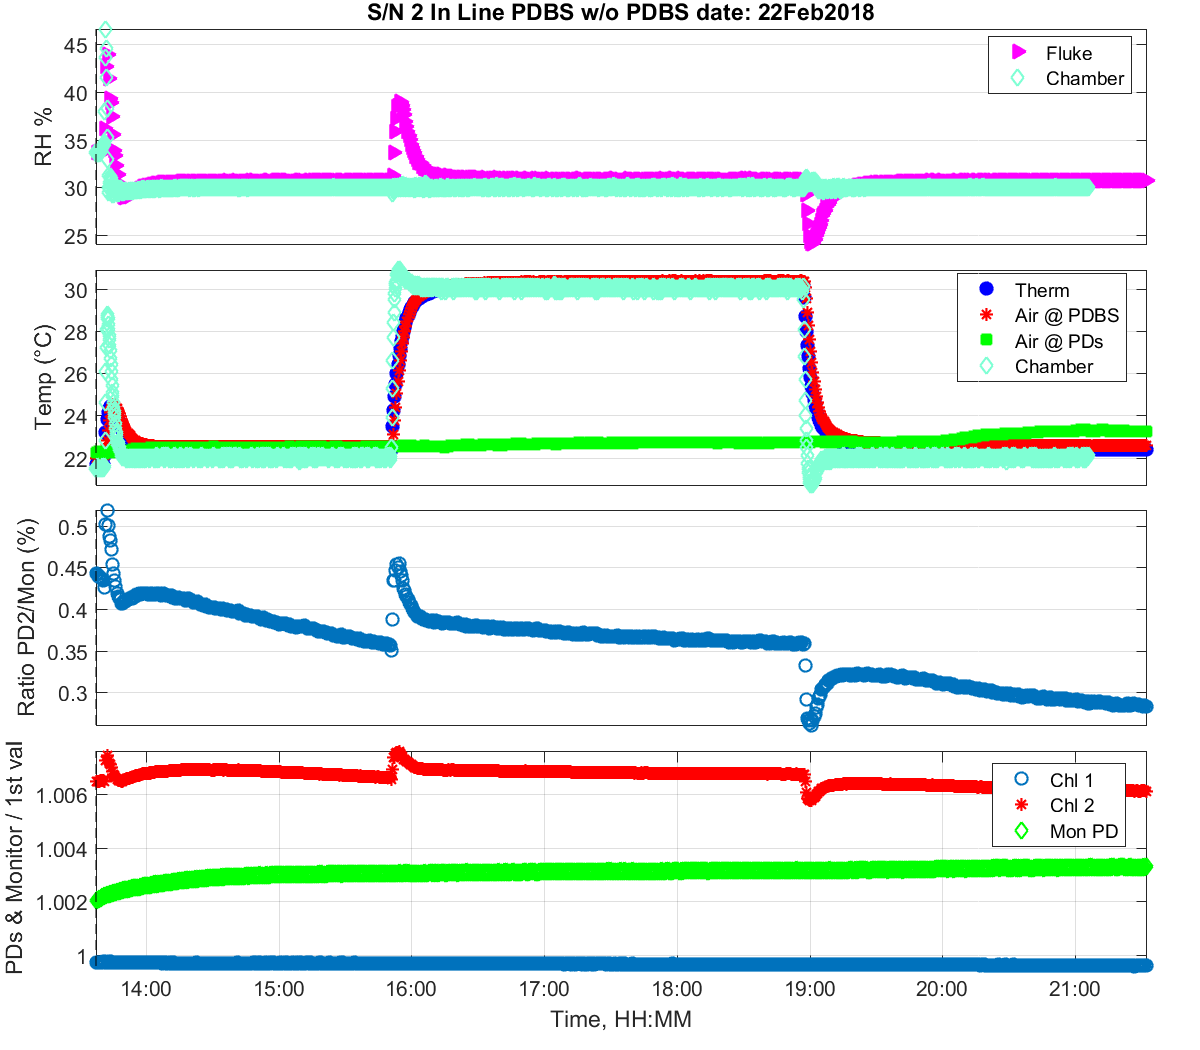
Figure 8: Zoomed in look at Day 7
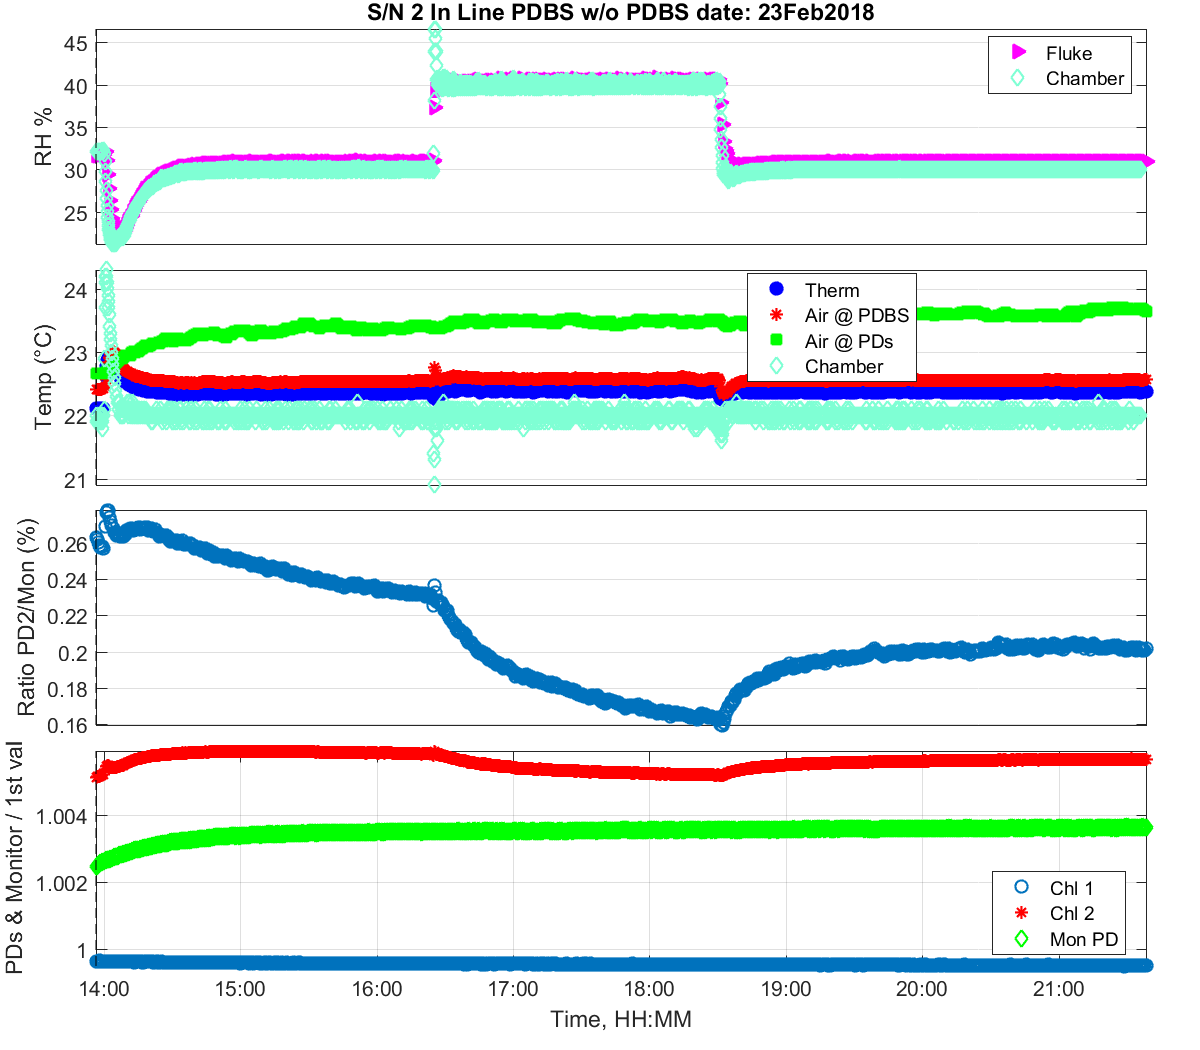
Figure 9: Zoomed in look at Day 8
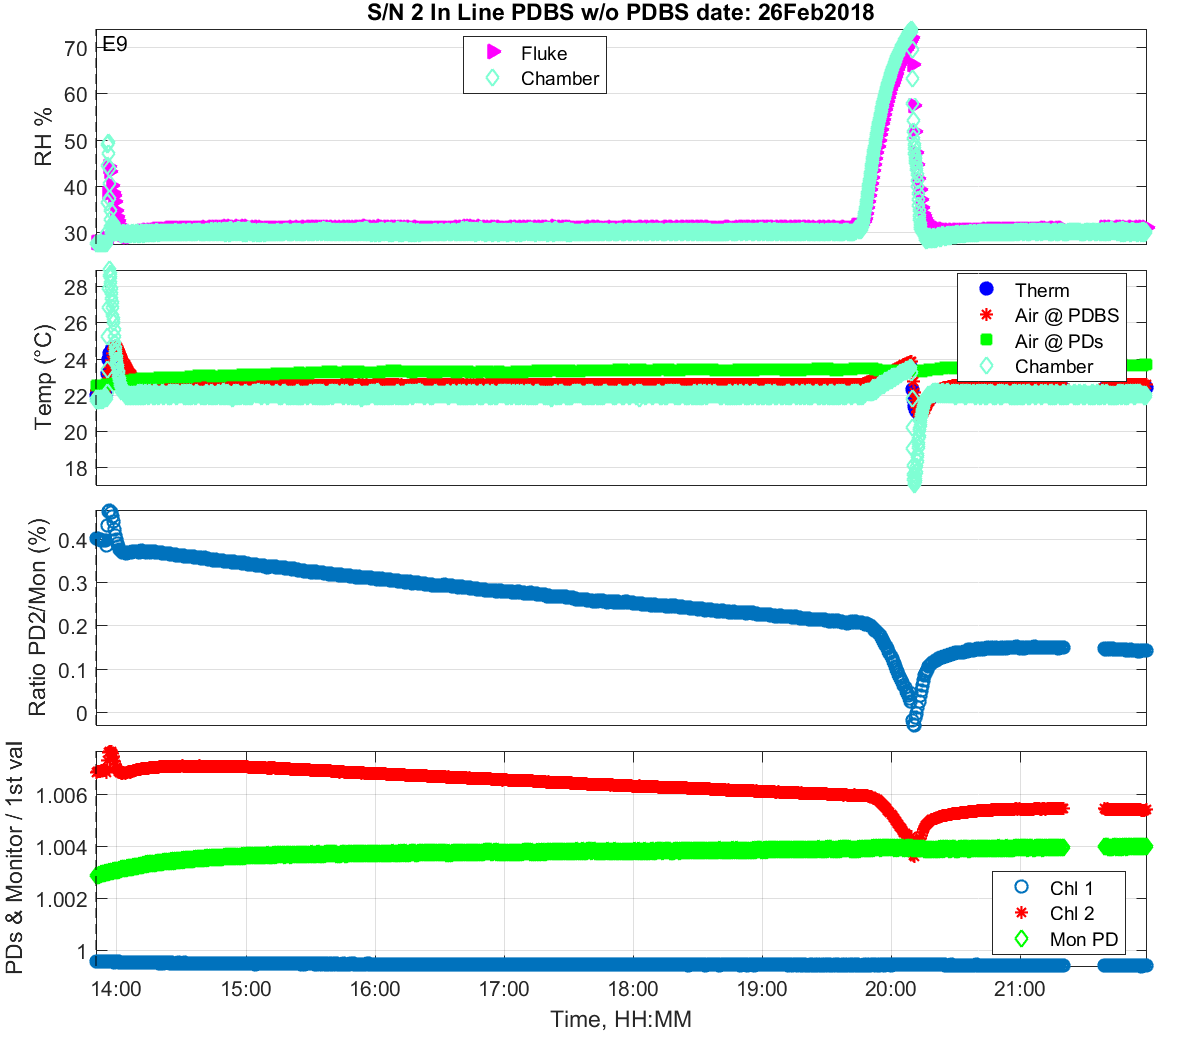
Figure 10: Zoomed in look at Day 9
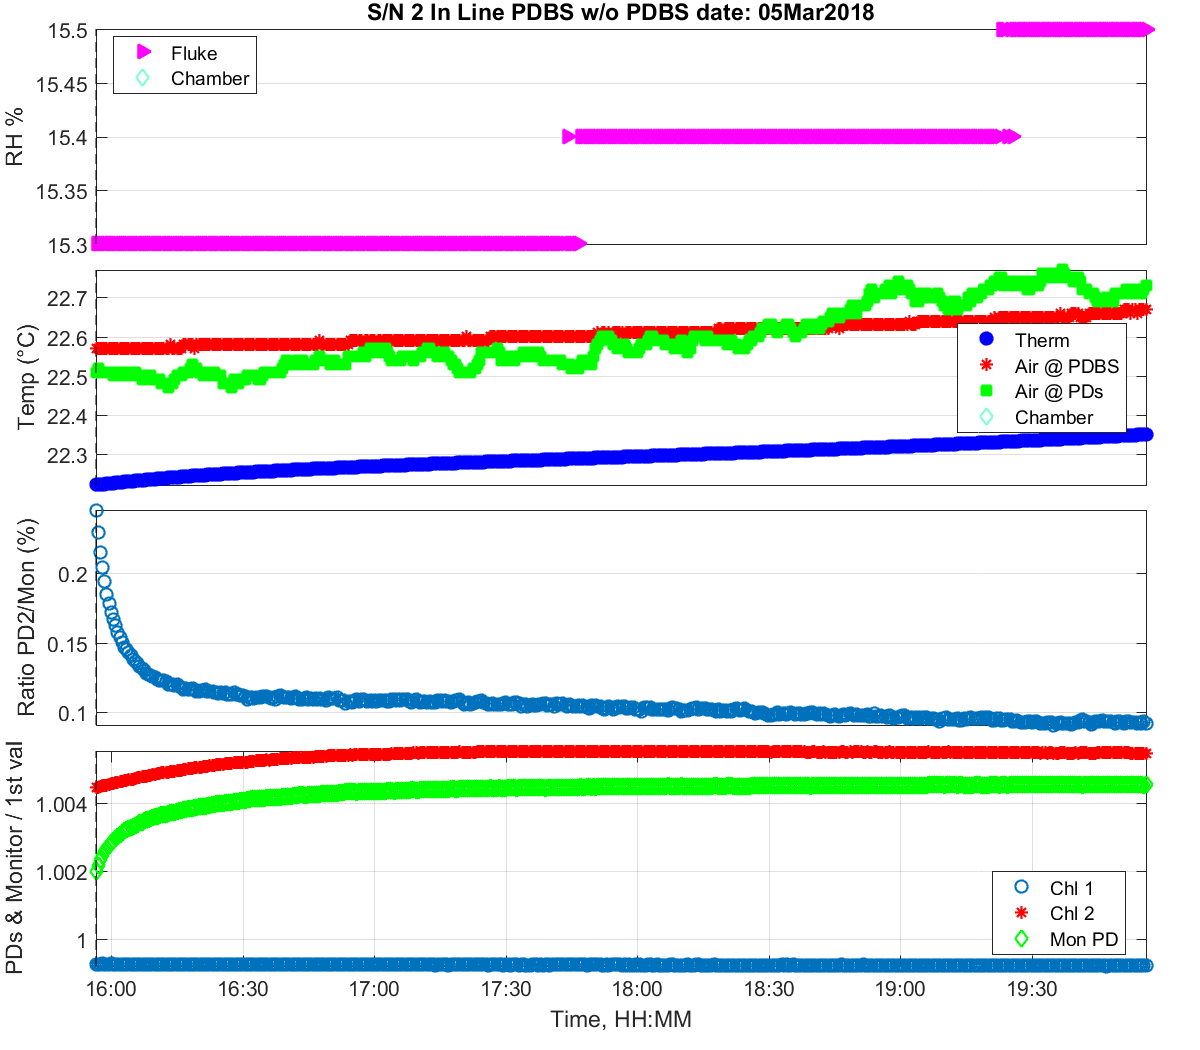
Figure 11: Zoomed in look at Day 10
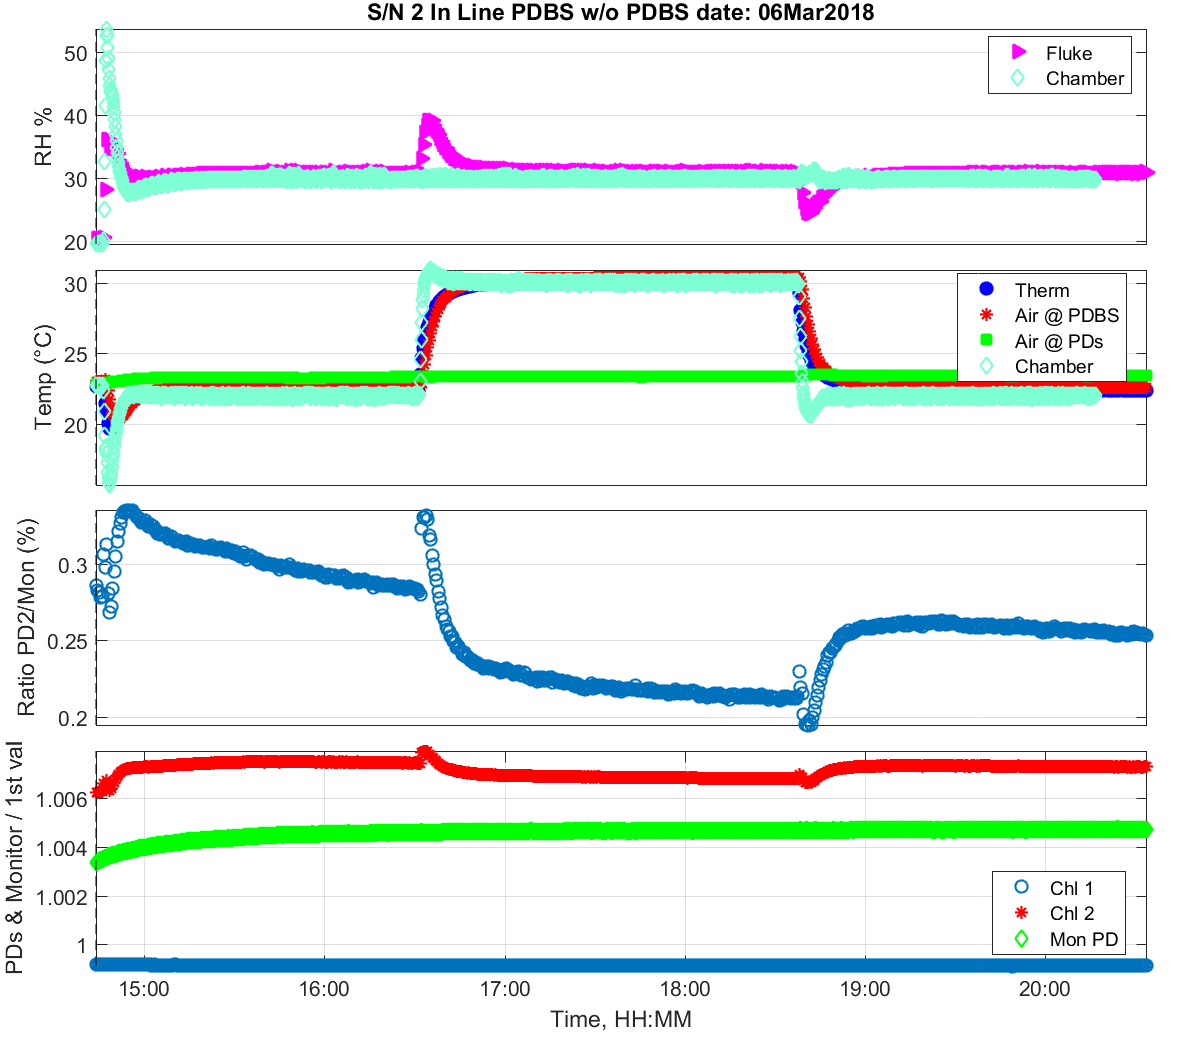
Figure 12: Zoomed in look at Day 11
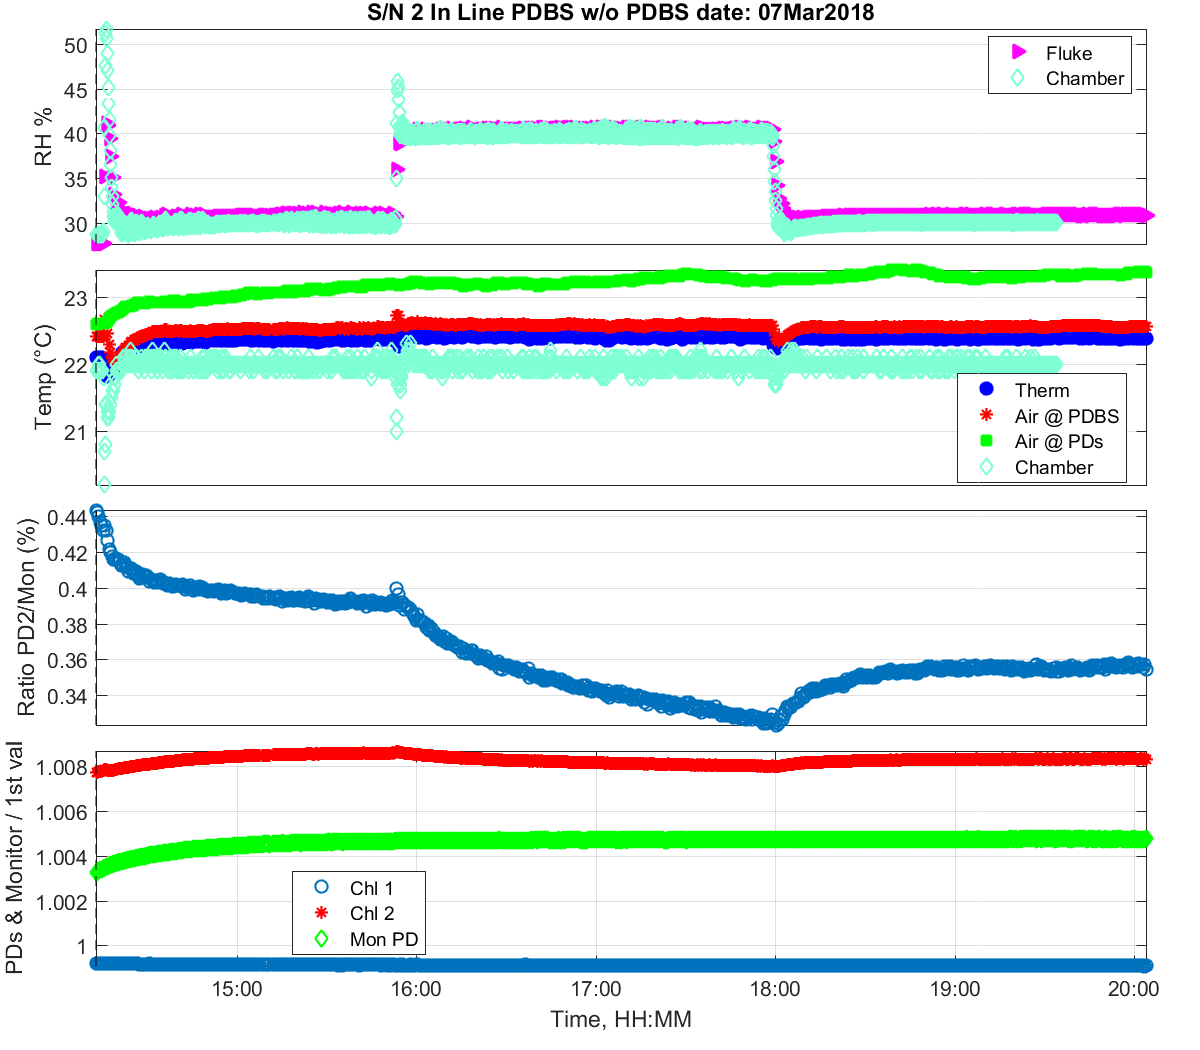
Figure 13: Zoomed in look at Day 12