REVISION DATE: 31-Jan-2018 15:59:25
We are testing the prototype of the In Line PDBS for Mark. This is S/N 2. S/N 1 was tested and did not perform so well, which Mark thought was because it had not been well-aligned. It has been sent back to MOBY. S/N 2 was aligned using his laser on a bench. This is a prototype in terms of the PDBS, that is, Mark ground the PDBS to fit the machined part. The machined part is intended for the final Refresh, for which custom PDBS mirrors would be ordered. The In Line PDBS has an FC fiber input connector, the PDBS at 45deg, and two output channels, also FC. Light in the straight through channel transmits the PDBS. Light in the “PDBS/Mirror” channel is reflected off the PDBS (AOI = 45deg) and then off a turning mirror (AOI = 45 deg) so the output is parallel, but offset from, the through channel. Collimator lenses collimate the input onto the PDBS and then refocus the output channels onto two separate fibers.
The NIST configuration is using our CSZ chamber, with interior dimensions of approximately 1m x 1m x 1m. There is a pair of 6” diam holes in the two side walls that are colinear. We have insulating plugs in these ports, modified with a slit to feed the fibers through. The light source is a white LED that belongs to Yuqin Zong at NIST. It is temperature stabilized and outside the chamber. The LED chip is butted up to the input port on the side of a small (1.5” or so) Spectralon integrating sphere we borrowed from SIRCUS. An SMA connector in the top of the sphere connects to our SEI 4500 spectroradiometer, which serves as a hyperspectral monitor. The SEI is set to acquire data every 10 min or 12 min, and the files are saved in dated folders (unfortunately, the same names are created by the commercial software the way we’ve got it configured). 90deg from the input port, an unfiltered Si photodiode is mounted to the sphere, the photocurrent converted to voltage, and output logged by a Labview Program written by Tom Larason that creates the log file “DVM_YYYYMMDD_xxx.txt”. On the third face of the sphere (also 90 deg to the input), Fiber 31 from FISH (FC both ends) takes the output of the sphere to the input of the PDBS. The two outputs are coupled, also using FISH fibers, to two Si PDs that are logged (along with temperature and humidity) by a second Labview Program, saving data files “FIBER_YYYYMMDD_xxx.txt”. Finally, the chamber, when it is controlling, saves a log file but I don’t use this so far – the transducers are on the wall, well away from the PDBS that is in the middle of the chamber.
Summary: of Set up for these results:
We time the runs to last the business day if possible. To date, we have been turning off the chamber at night, along with the LED source, but leaving everything else on. In the morning, the humidity has increased above ambient.
Summary of testing to date:
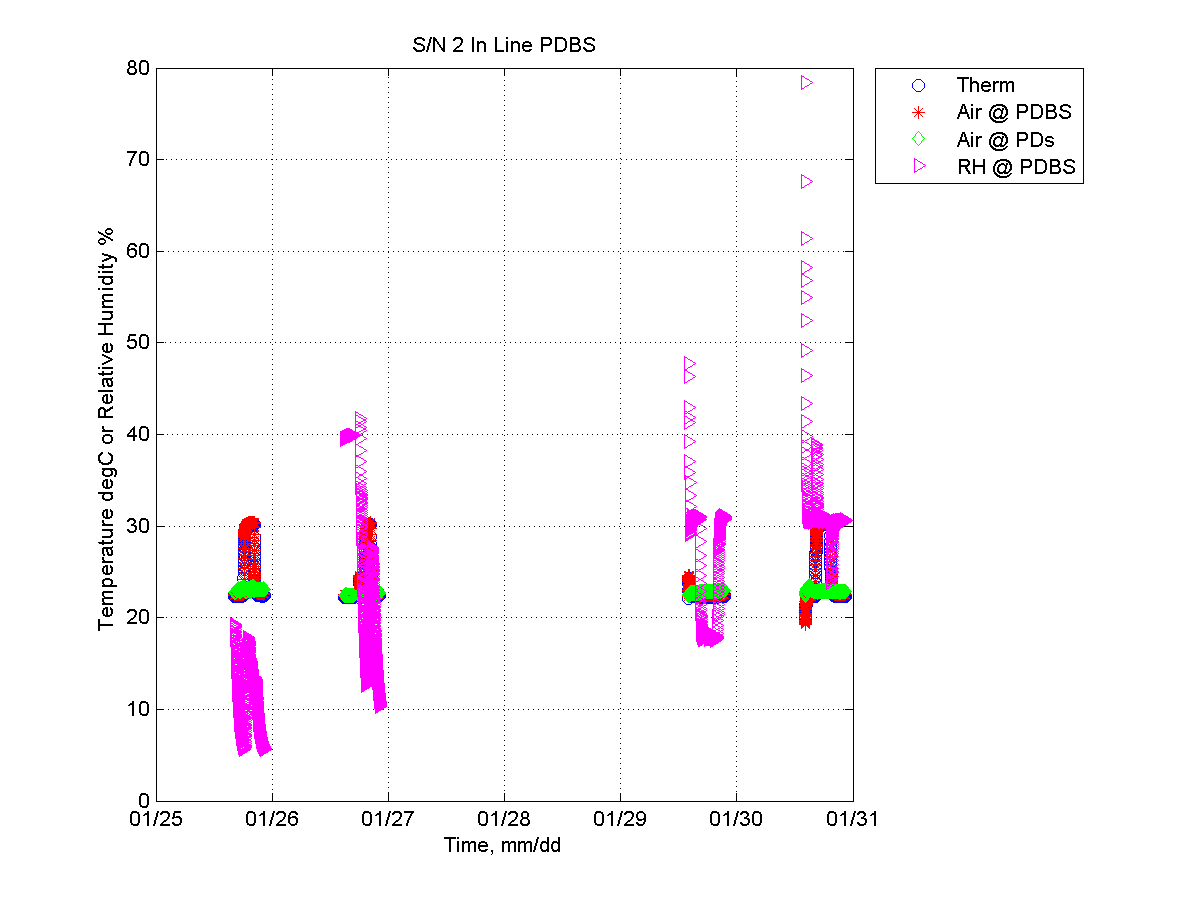
Figure 1: Time series of the temperature and humidity values, to date, from the Fluke and the thermistor. X axis is Time in 2018, Y axis is both temperature in deg C or RH in percent.
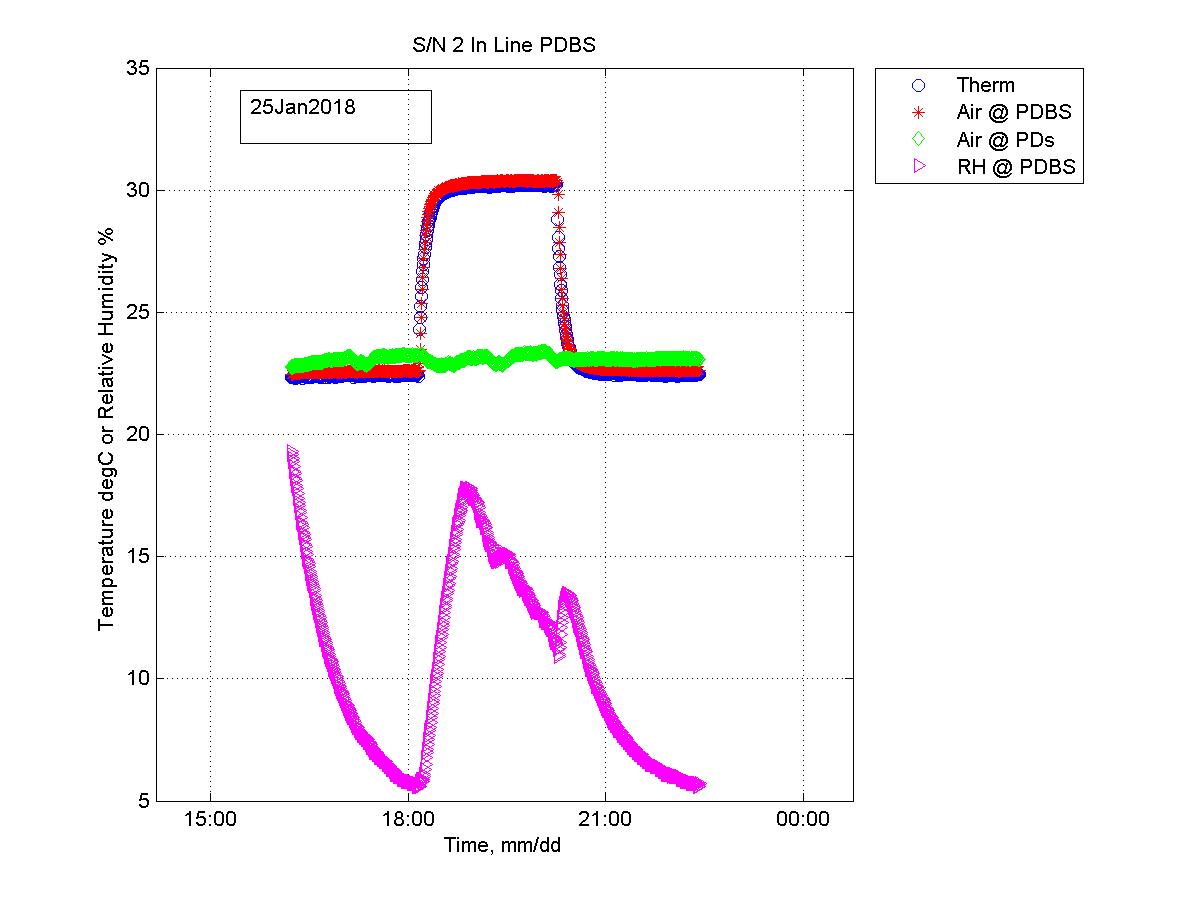
Figure 2: Zoomed Time series for temperatures and RH zoomed in for each day
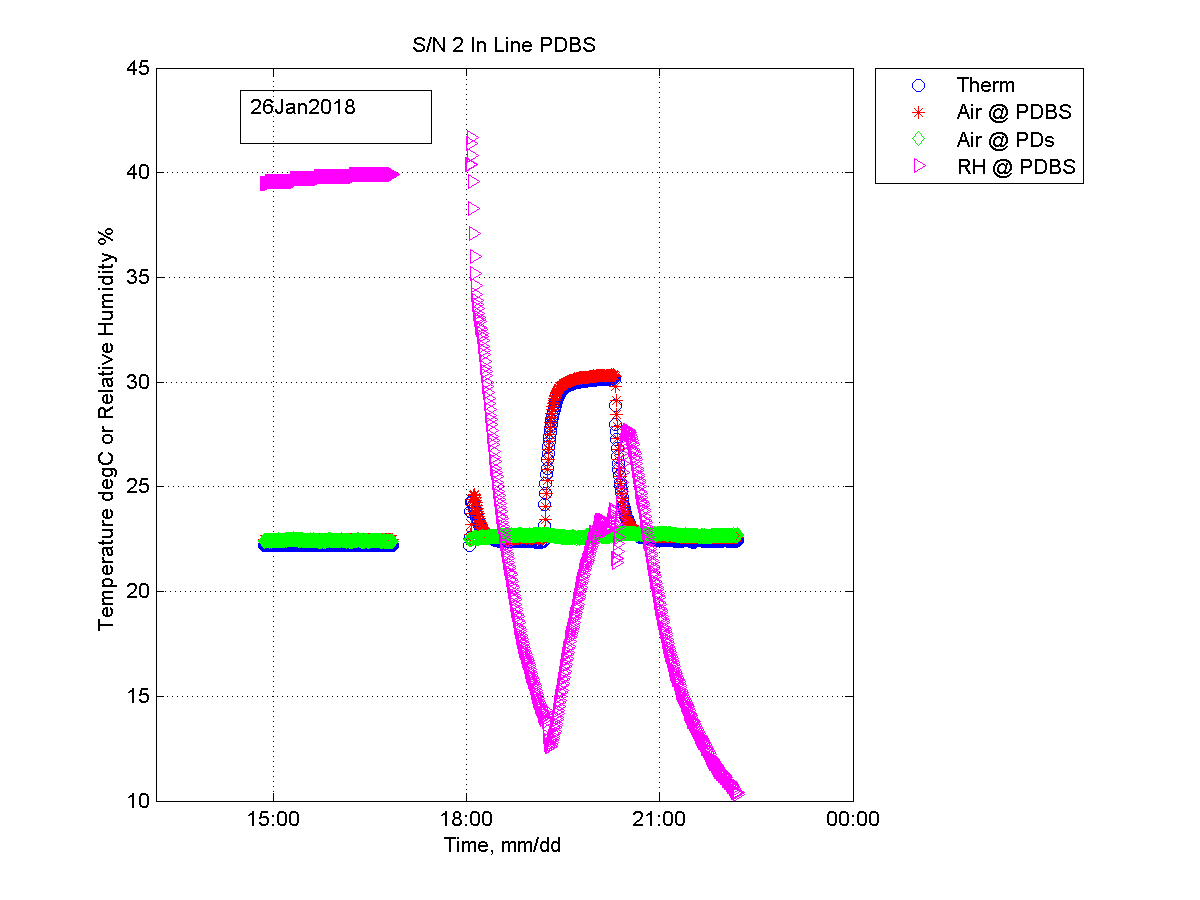
Figure 3: Zoomed Time series for temperatures and RH zoomed in for each day
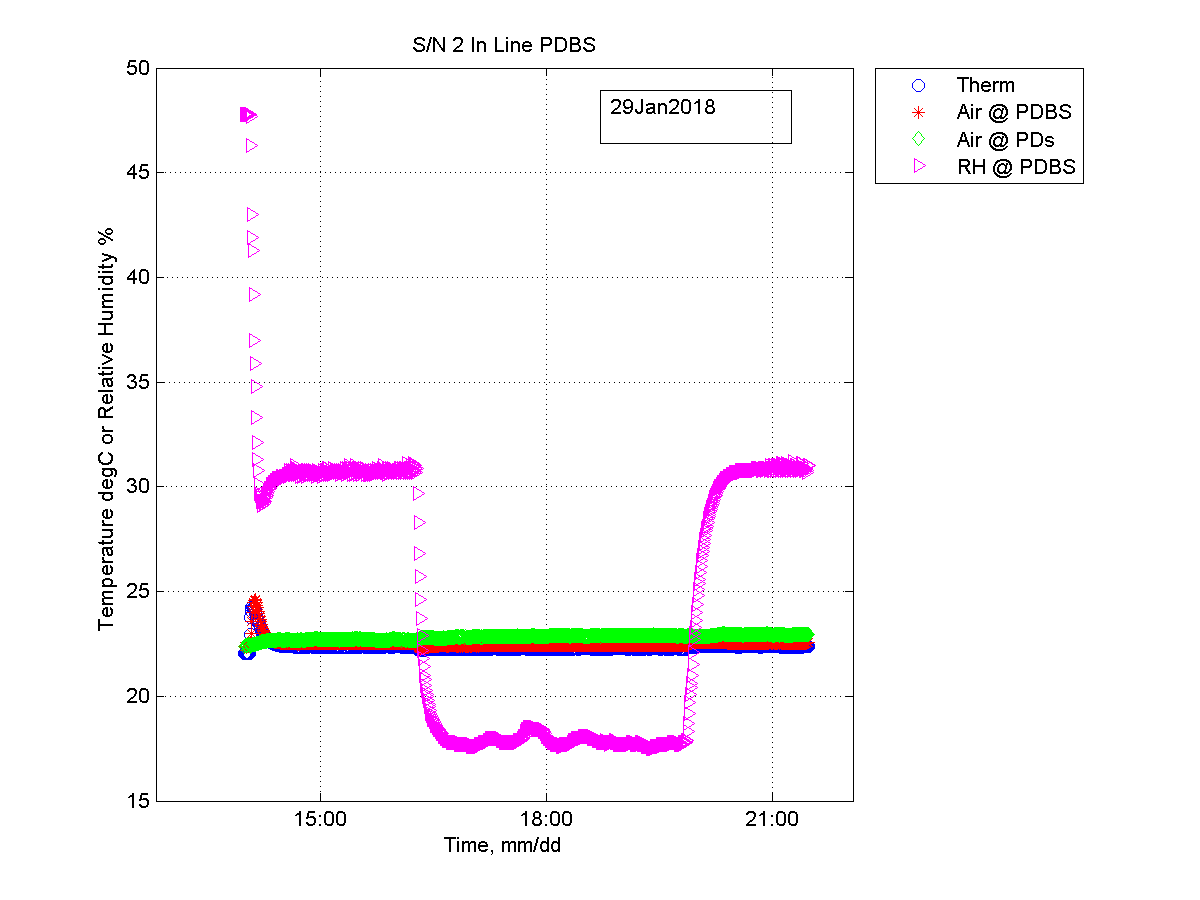
Figure 4: Zoomed Time series for temperatures and RH zoomed in for each day
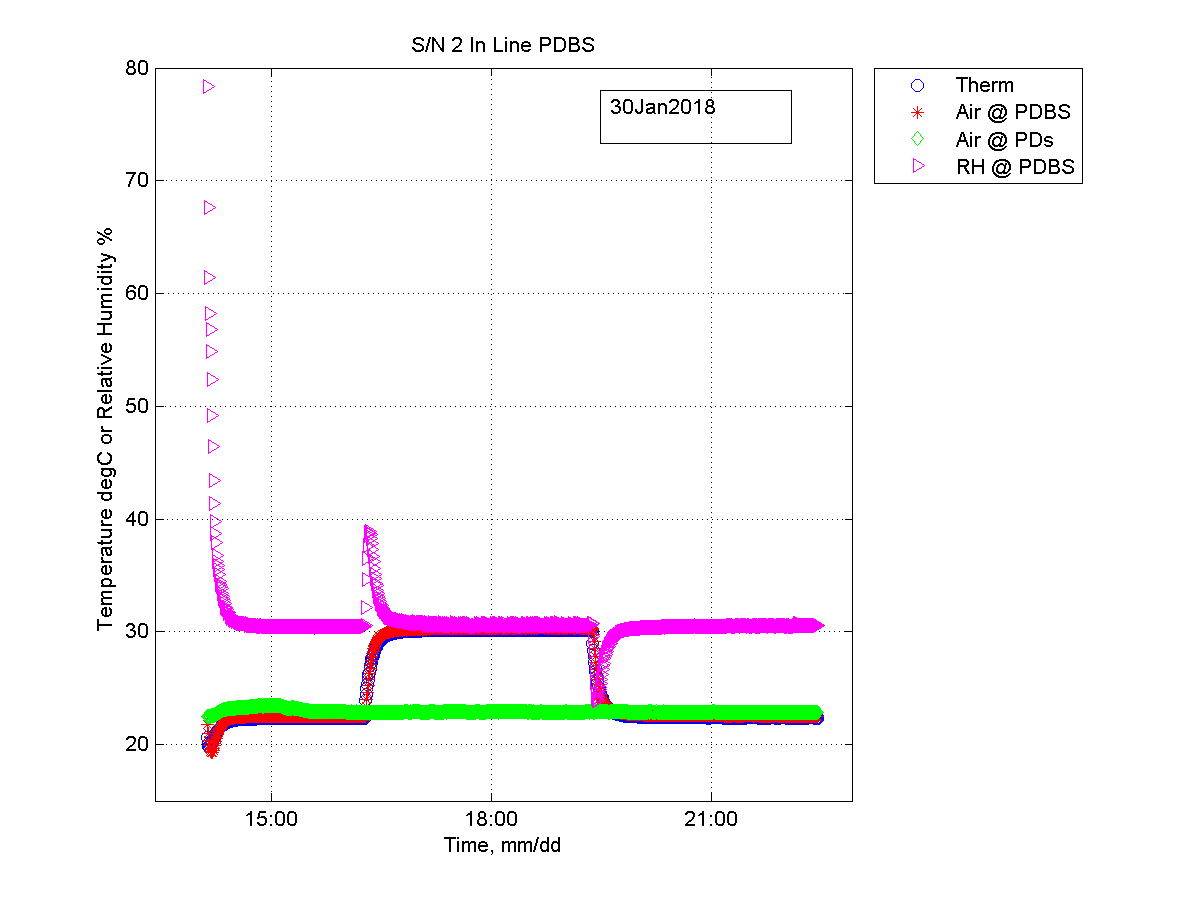
Figure 5: Zoomed Time series for temperatures and RH zoomed in for each day
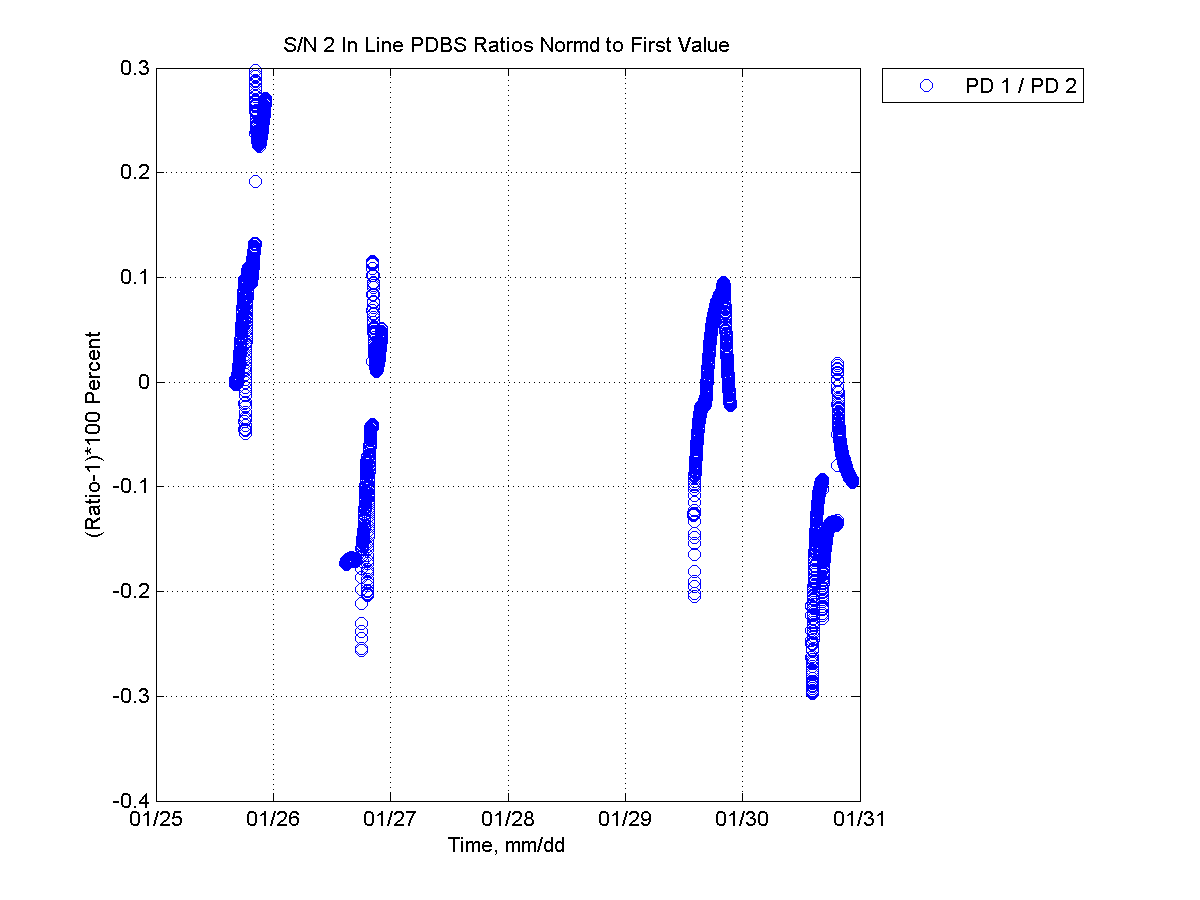
Figure 6: The ratio Chl 1 / Chl 2, or the reflective PDBS/Mirror channel divided by the through PDBS channel. Typical values (at gain 10^7 for the S2281’s) are 170 mV and 700 mV. The ratios were normalized by the first value on 25-Jan-2018 and converted to percent (y axis).
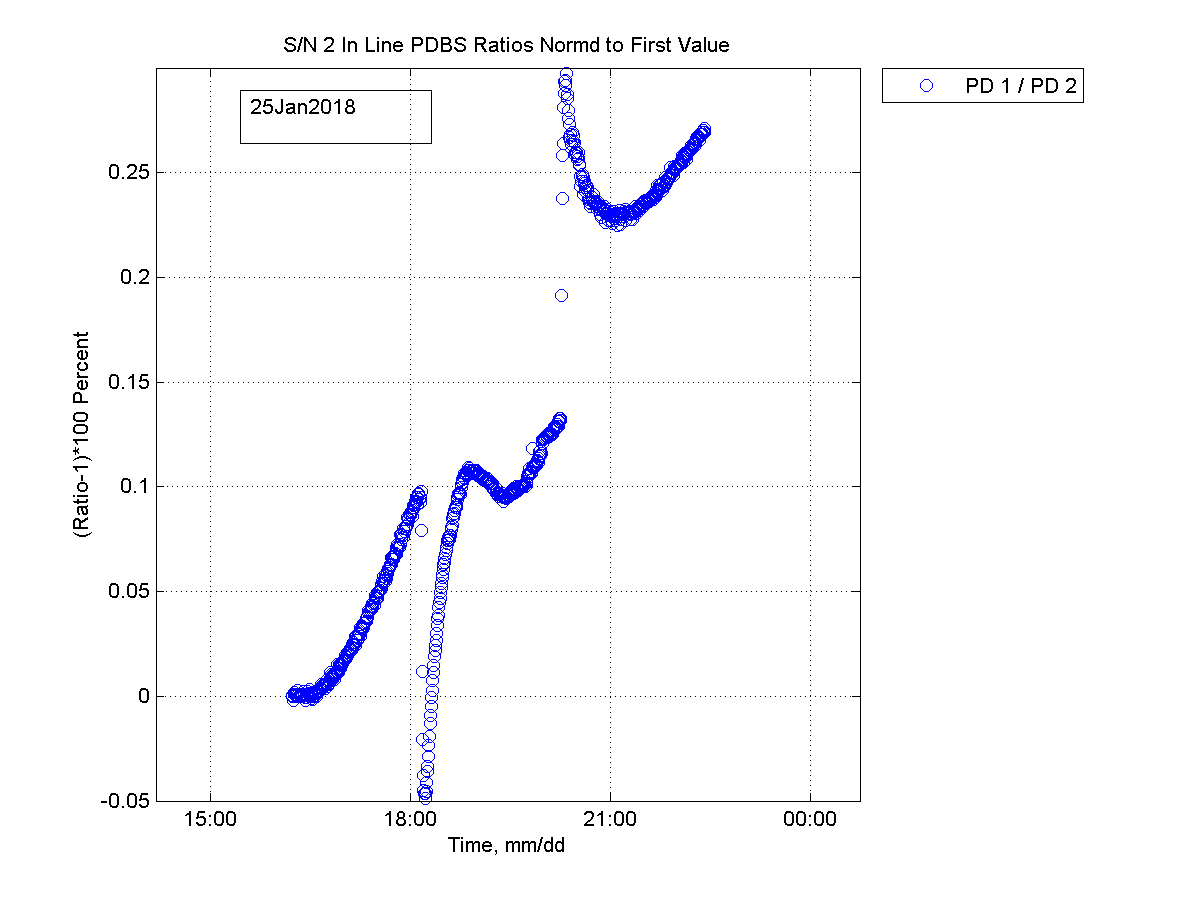
Figure 7: zoomed Time series of ratios for each day
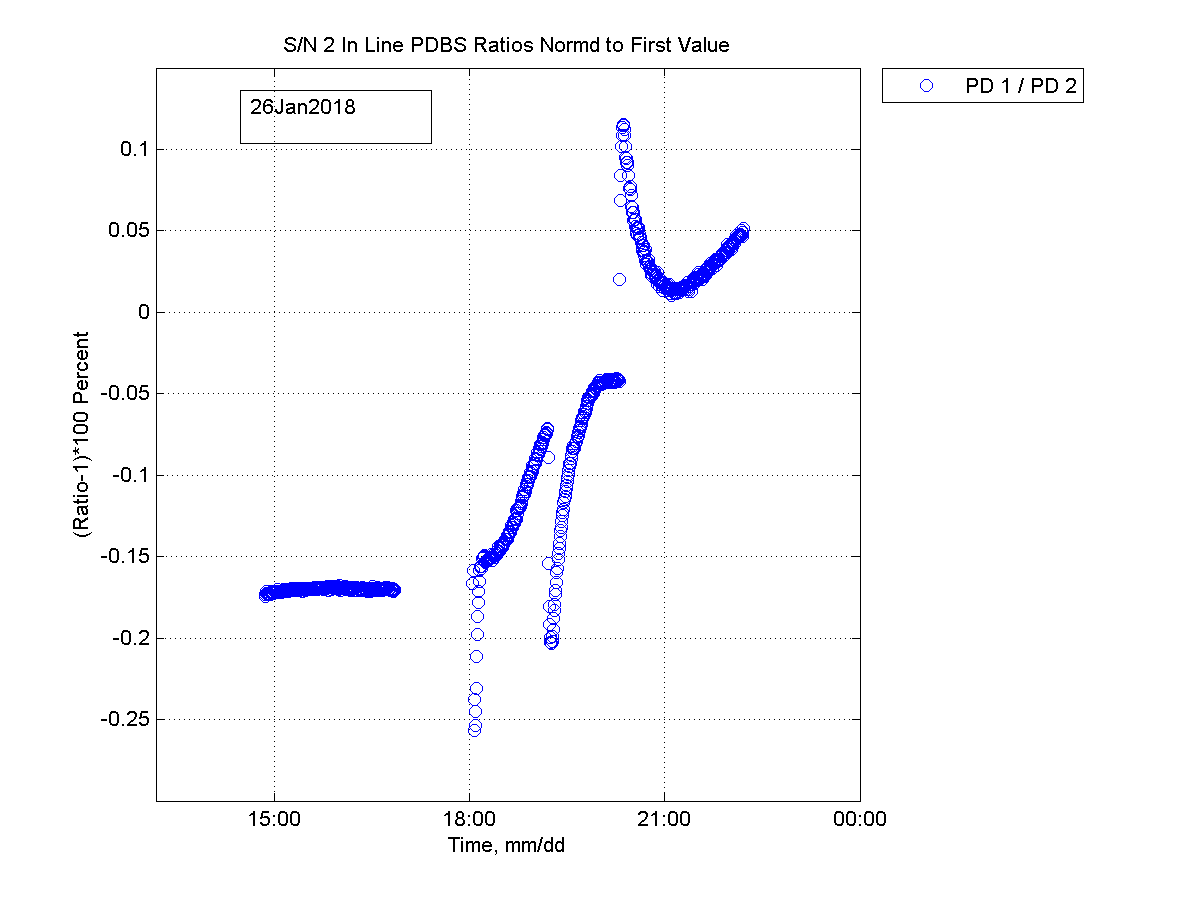
Figure 8: zoomed Time series of ratios for each day
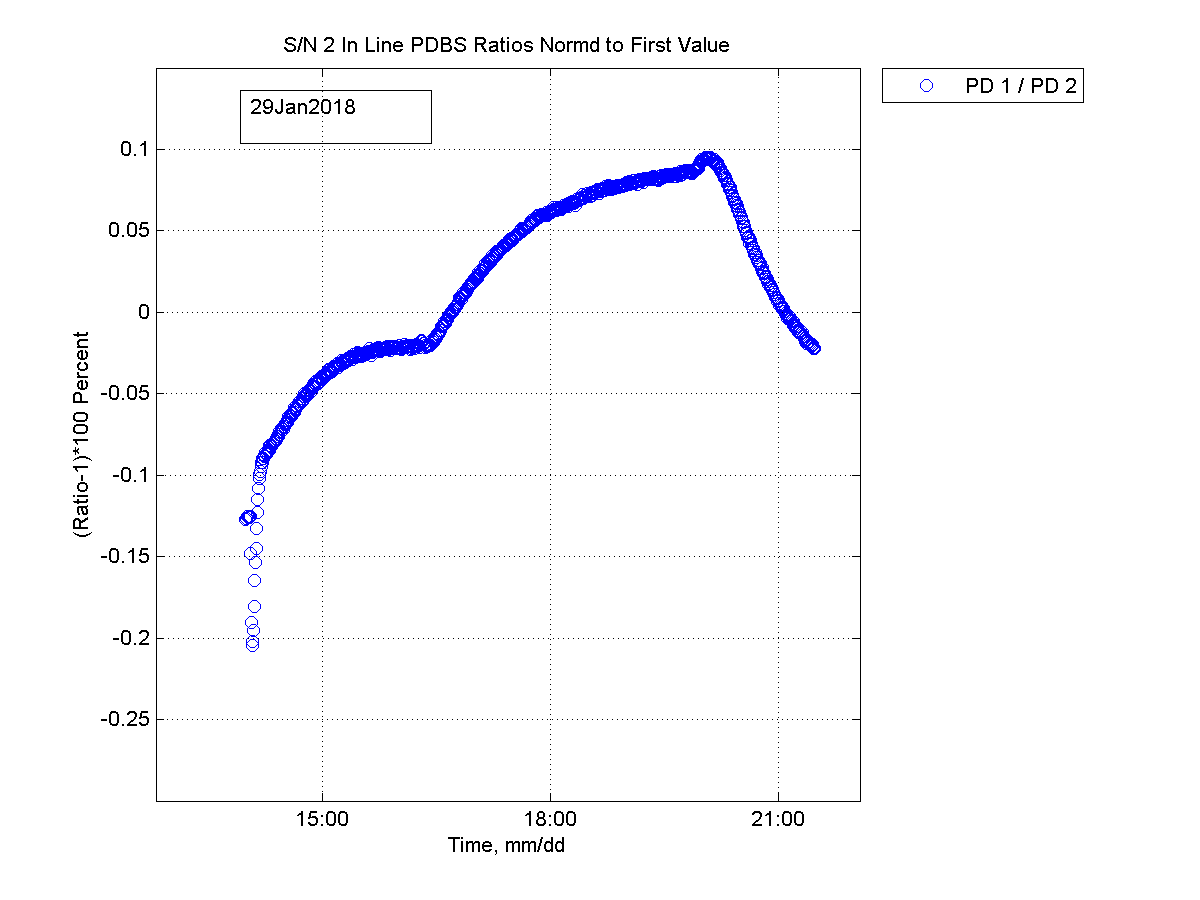
Figure 9: zoomed Time series of ratios for each day
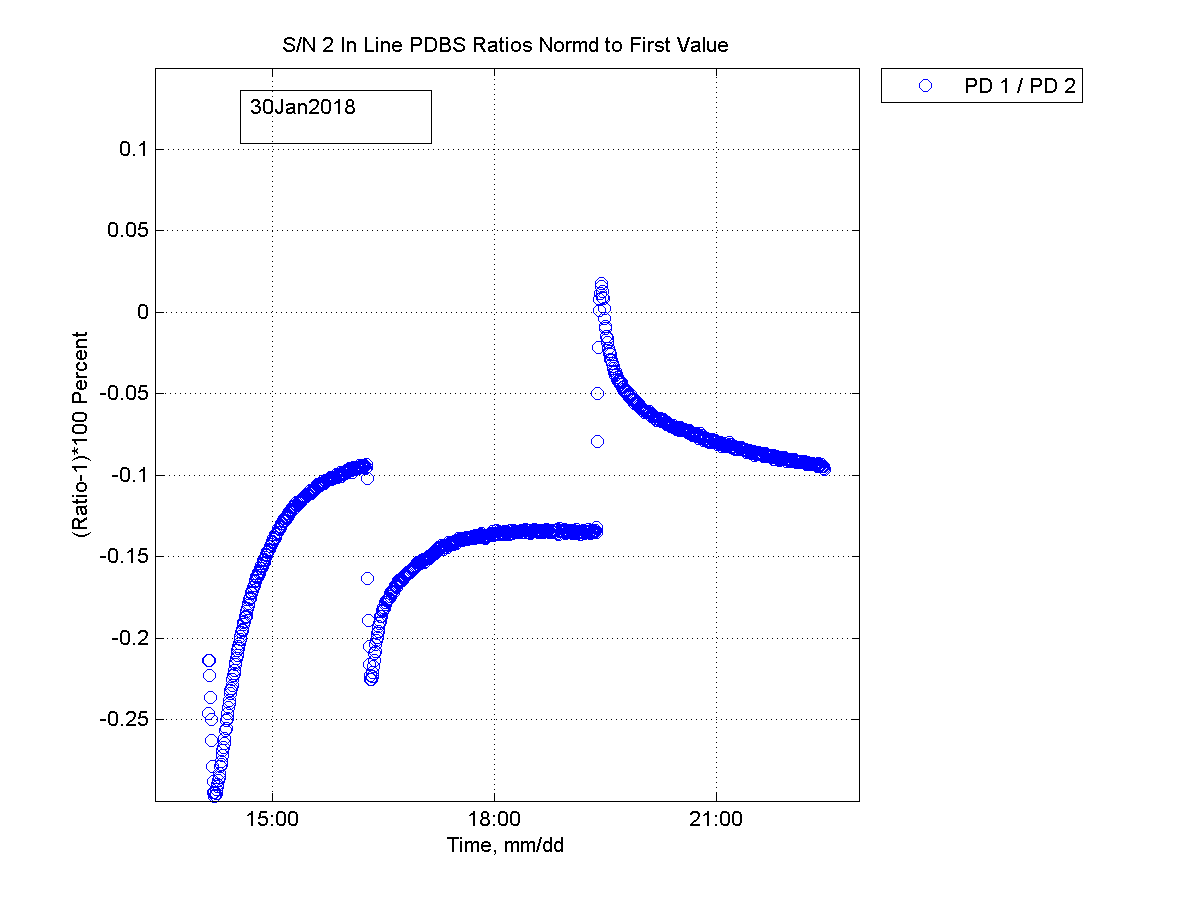
Figure 10: zoomed Time series of ratios for each day
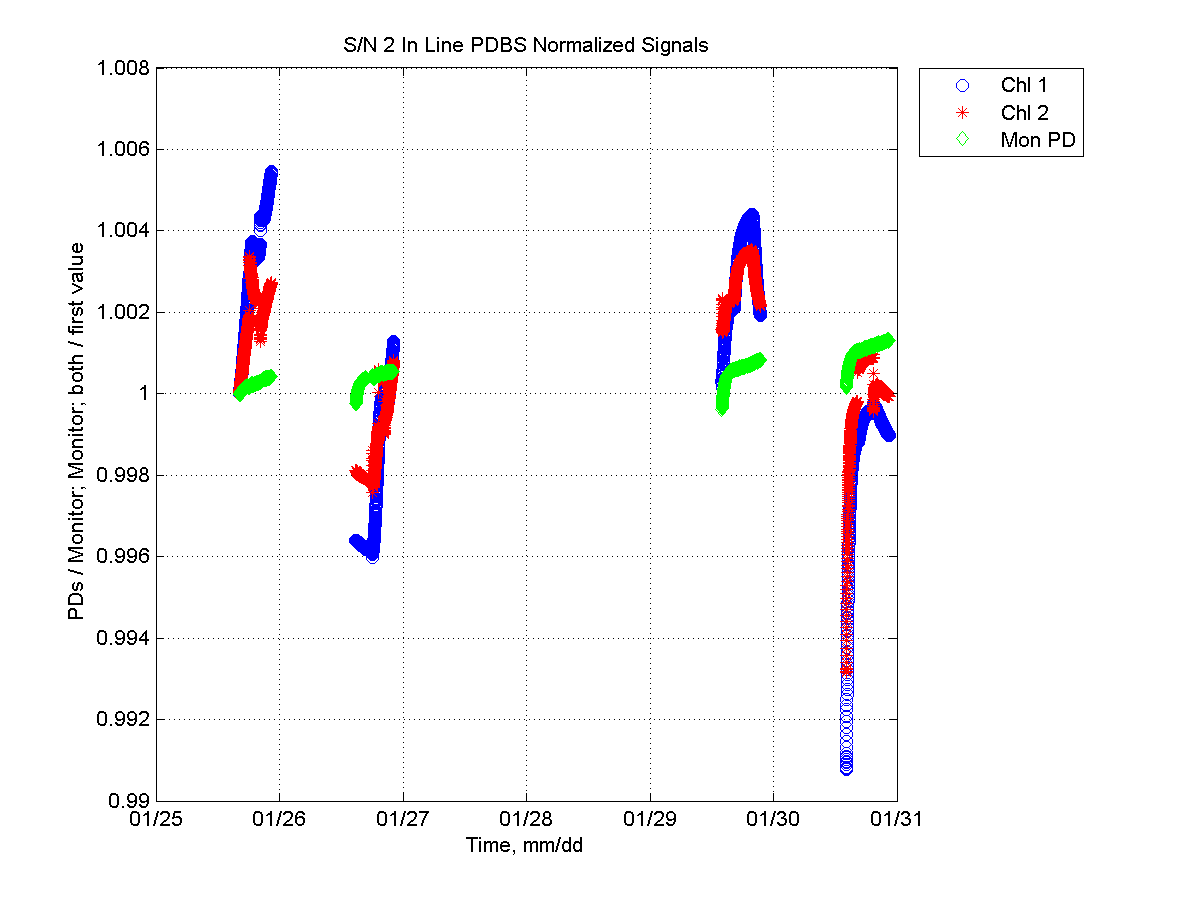
Figure 11: Time series of normalized signals. The sphere monitor PD values are normalized to the first value on 25-Jan-2018. The Chl 1 and Chl 2 values are normalized by the monitor at each point in time, and then normalized to the first value on 25-Jan-2018. We can see that the monitor never changes much, but the output signals, even after normalized to the monitor, change up to 1%.
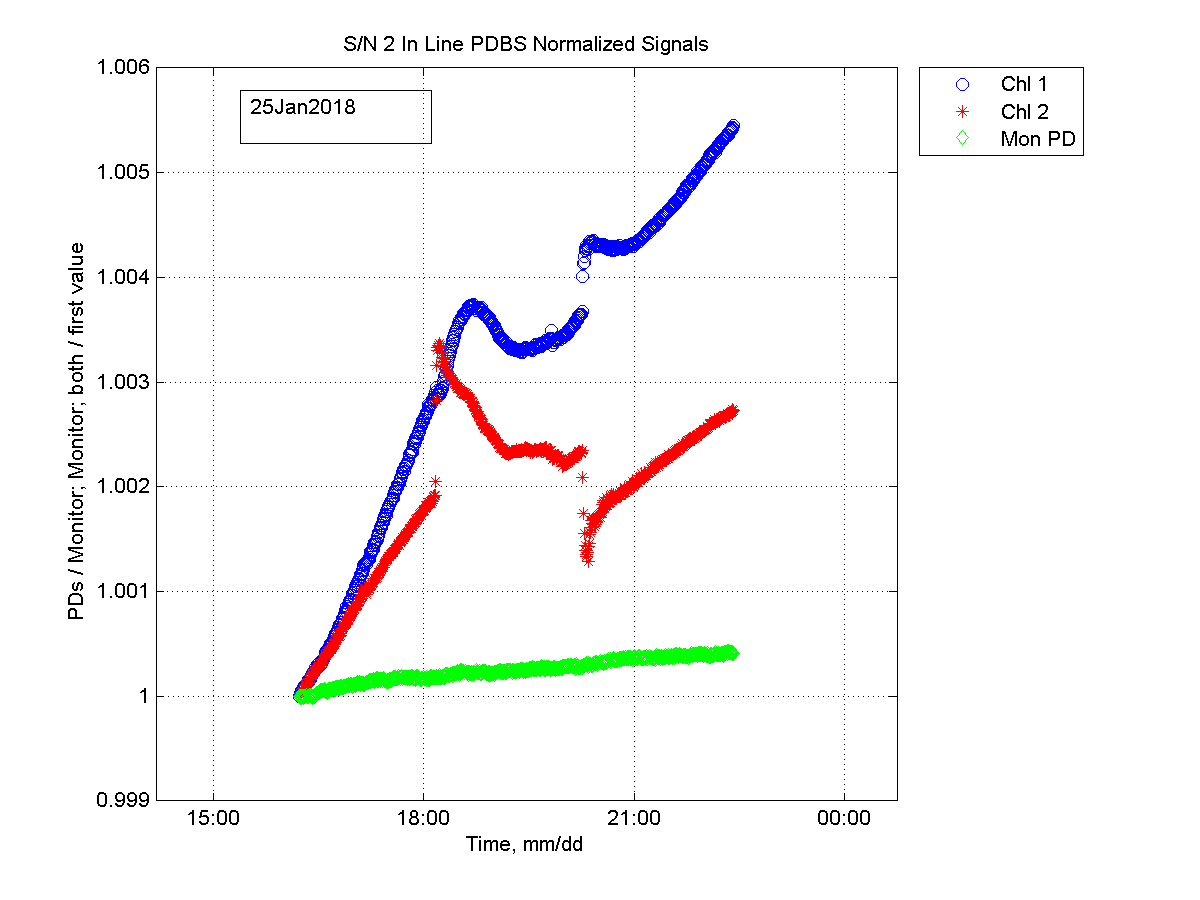
Figure 12: Zoomed normalized signals
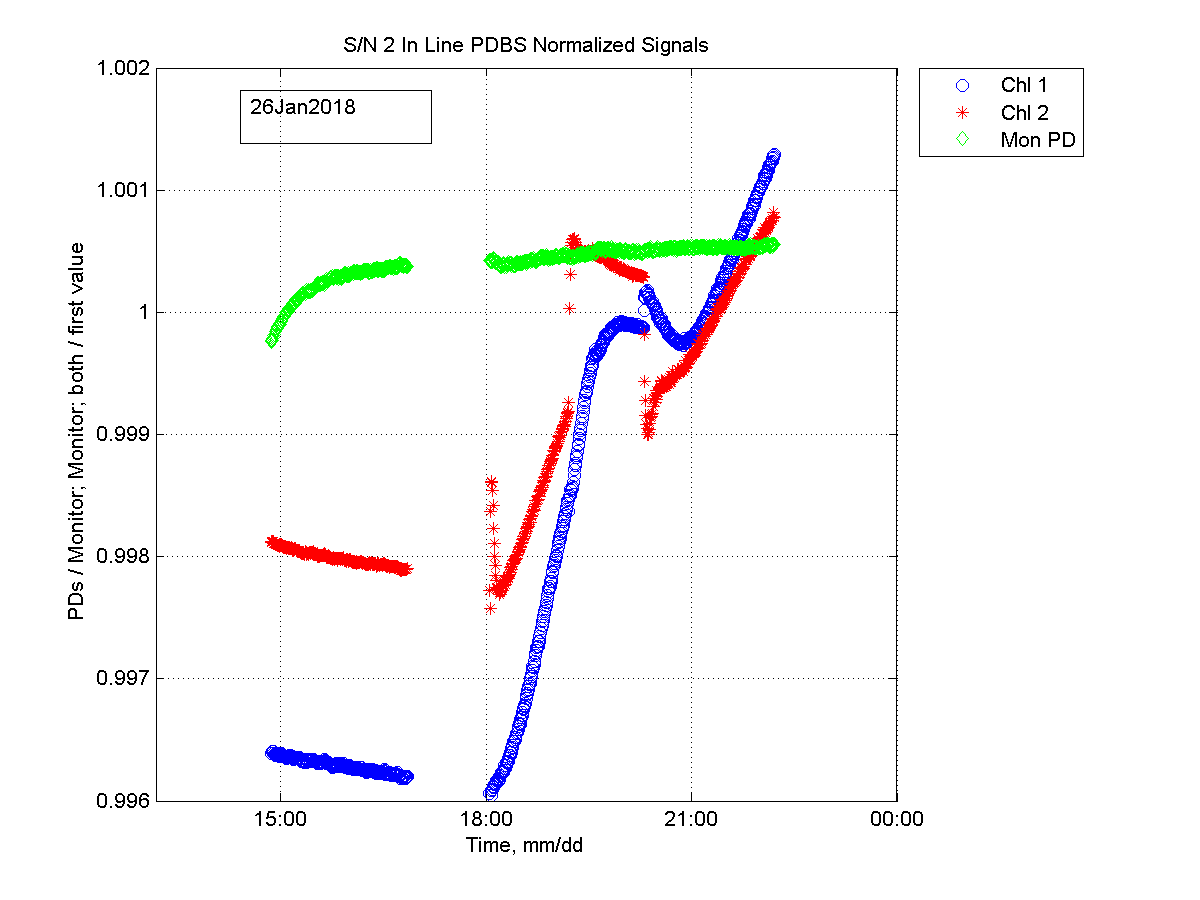
Figure 13: Zoomed normalized signals
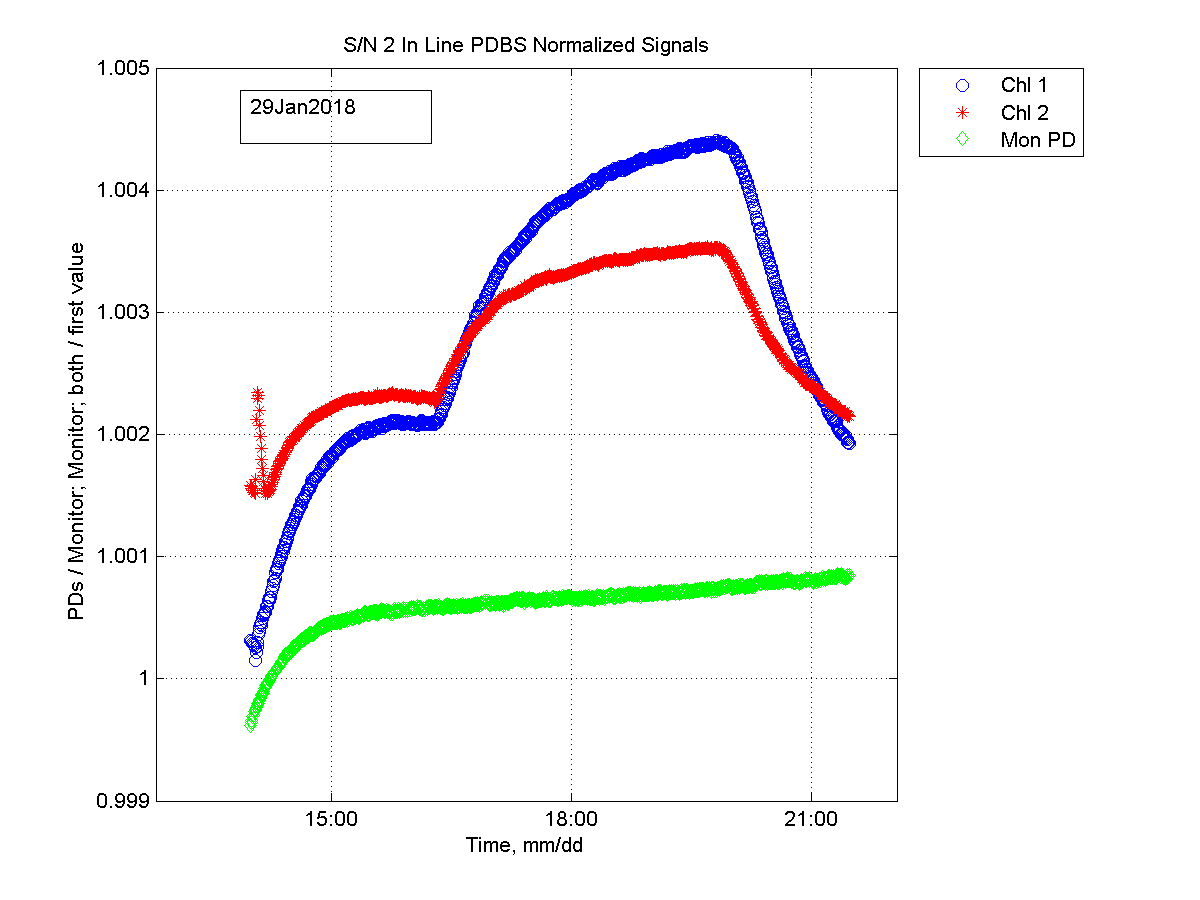
Figure 14: Zoomed normalized signals
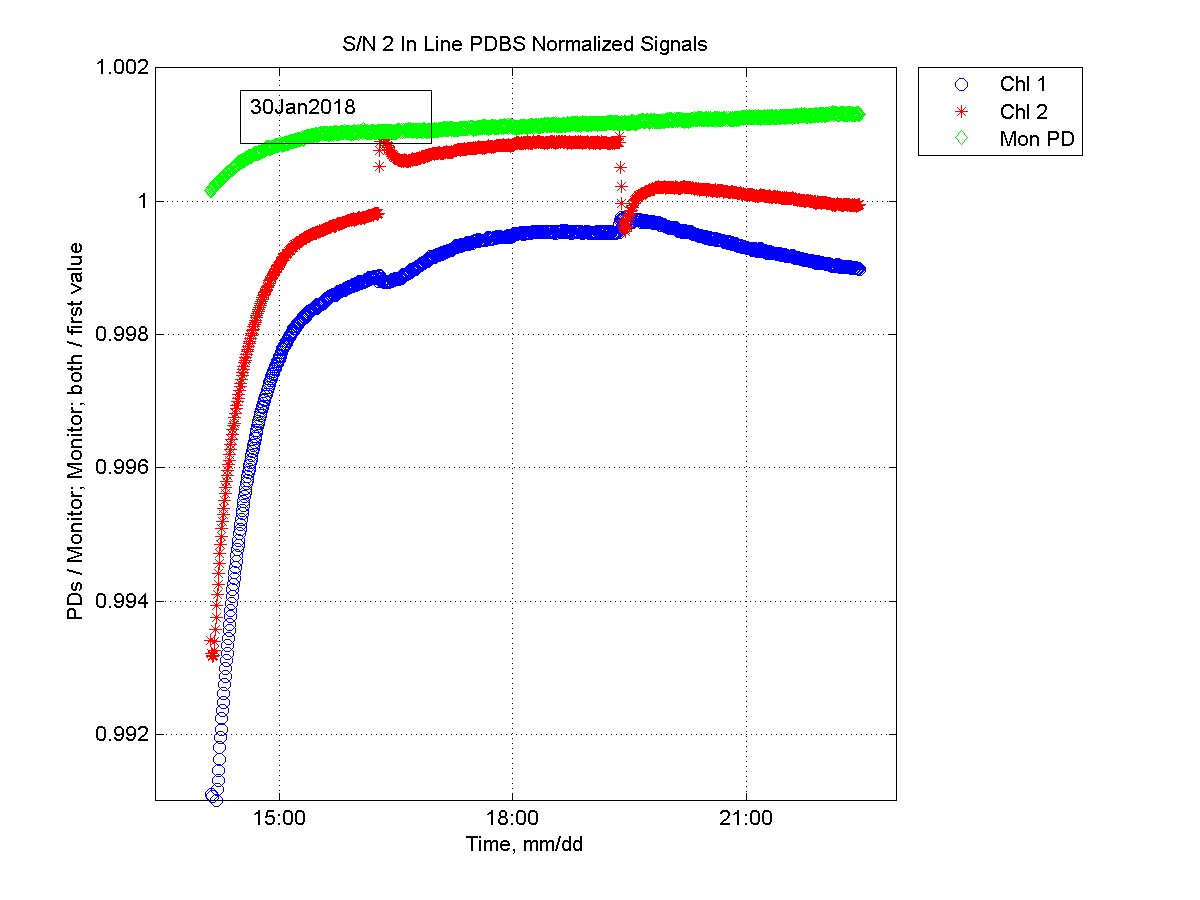
Figure 15: Zoomed normalized signals
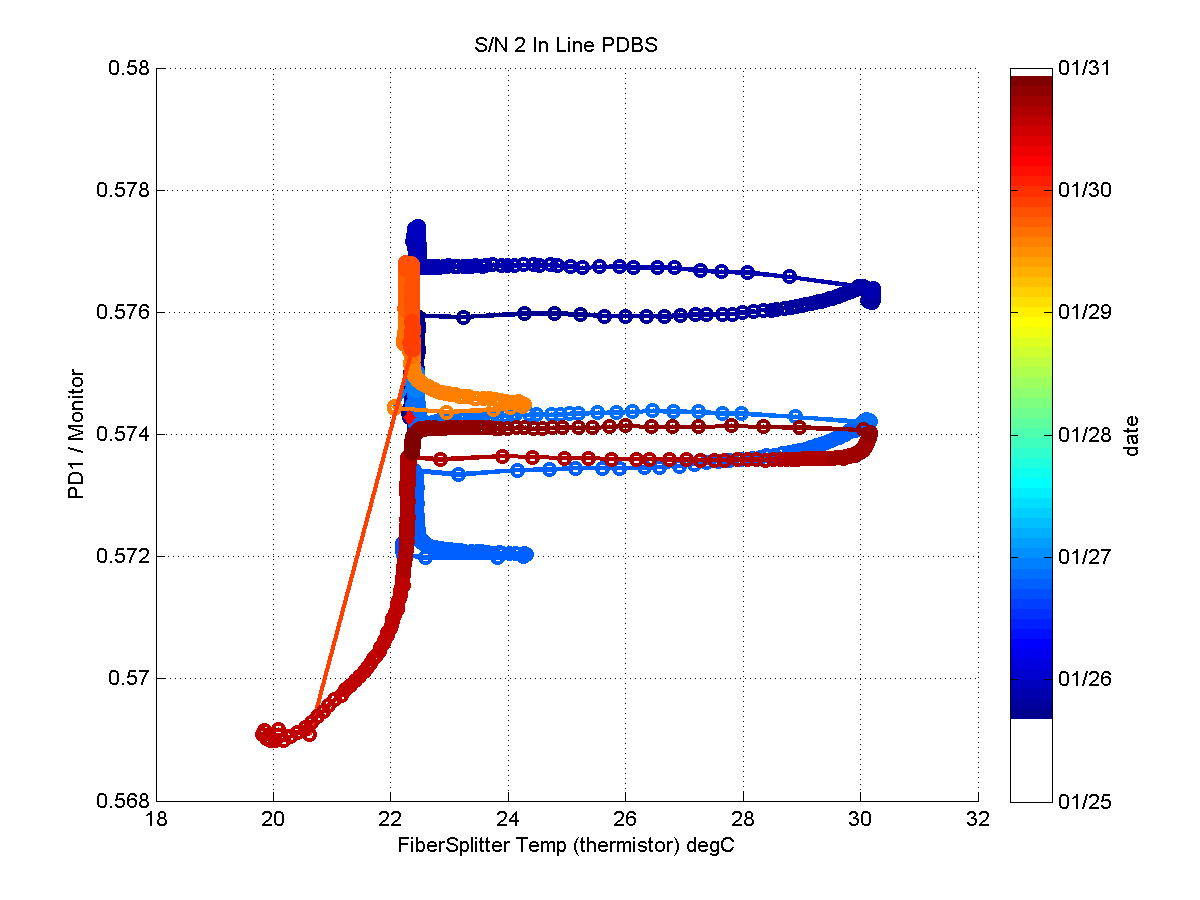
Figure 16: Normalized Chl 1 (by the monitor) vs PDBS temperature, with the color bar indicating time. The red diamond is the start of the series. The two that are in good agreement at 30 deg C are the 26th and 30th.
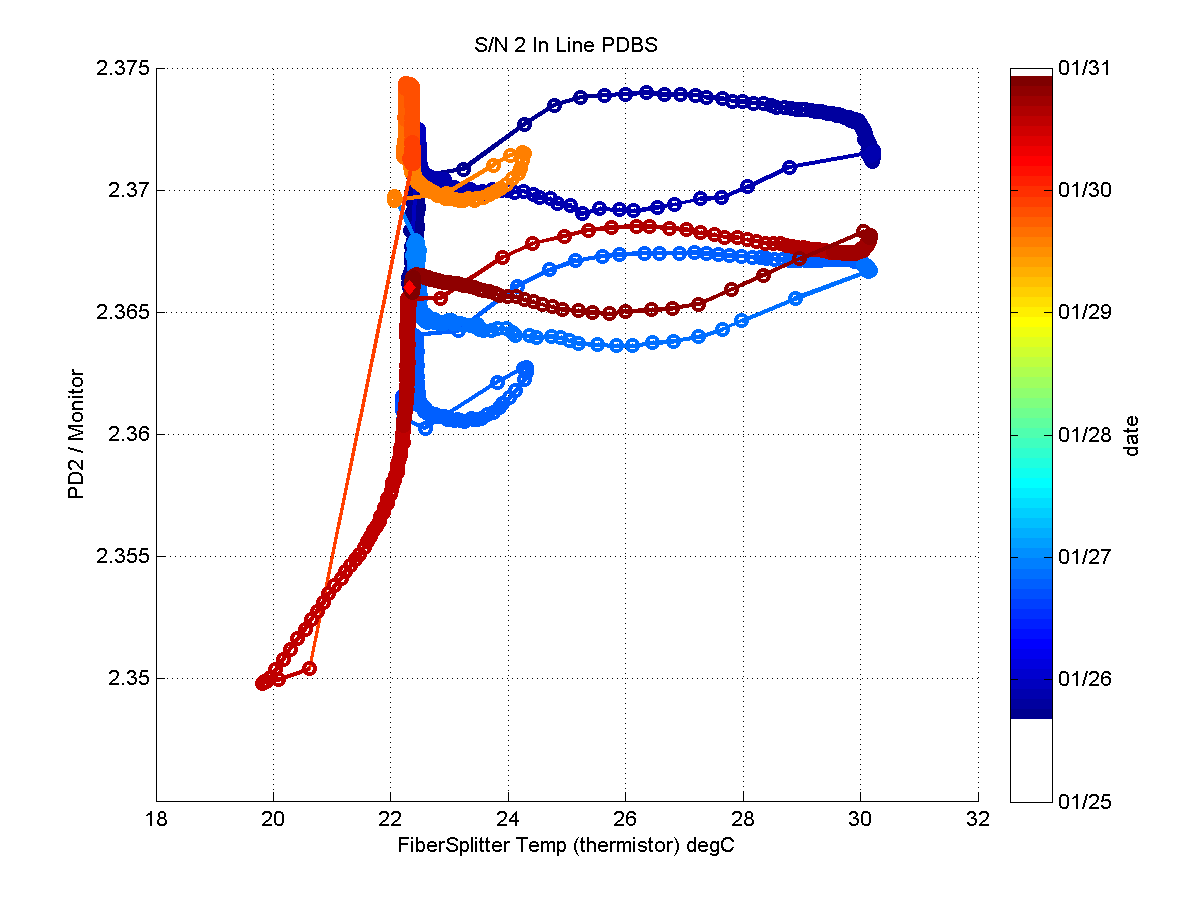
Figure 17: Normalized Chl 2 (by the monitor) vs PDBS temperature, with the color bar indicating time. The red diamond is the start of the series. The two that are in good agreement at 30 deg C are the 26th and 30th.
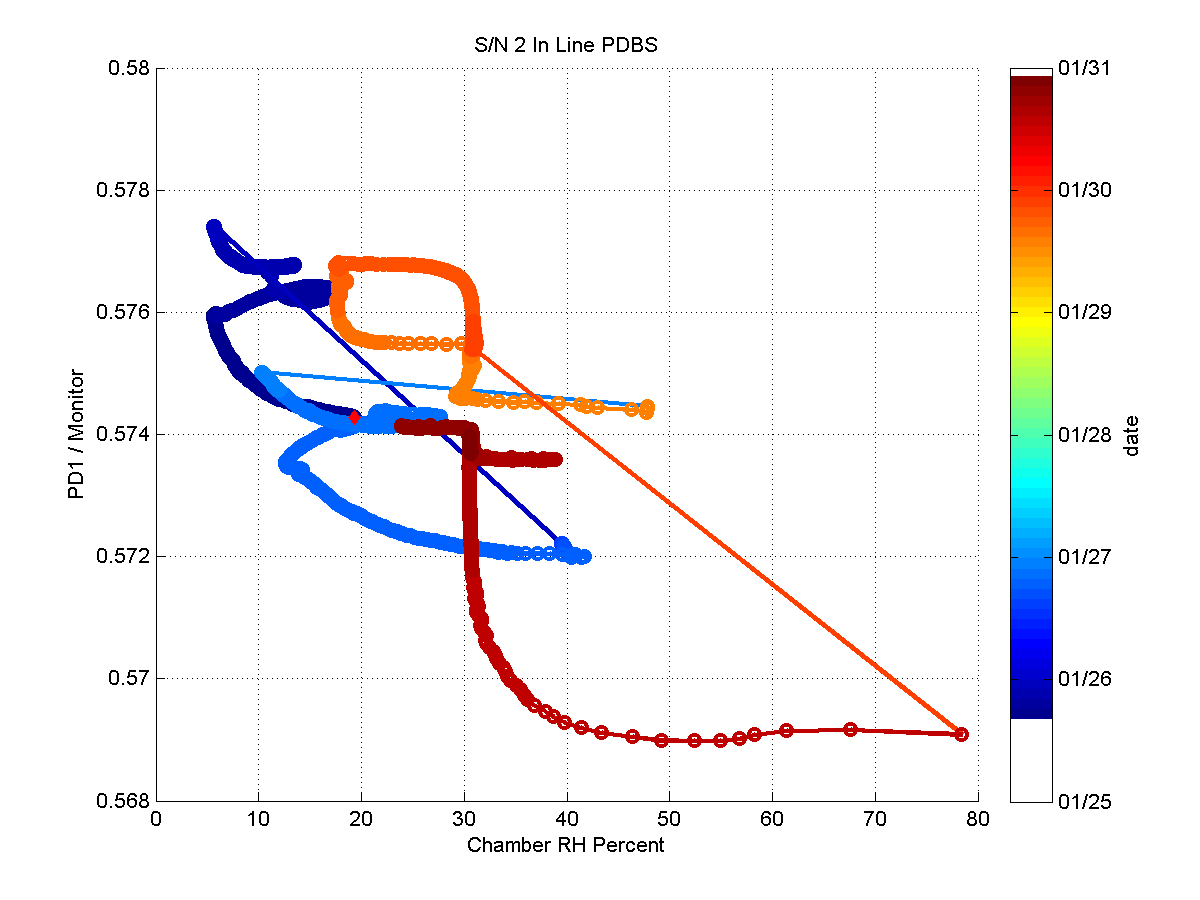
Figure 18: Normalized Chl 1 (by the monitor) vs chamber RH, with the color bar indicating time. The red diamond is the start of the series. The output increases with decreasing humidity for portions of the runs.
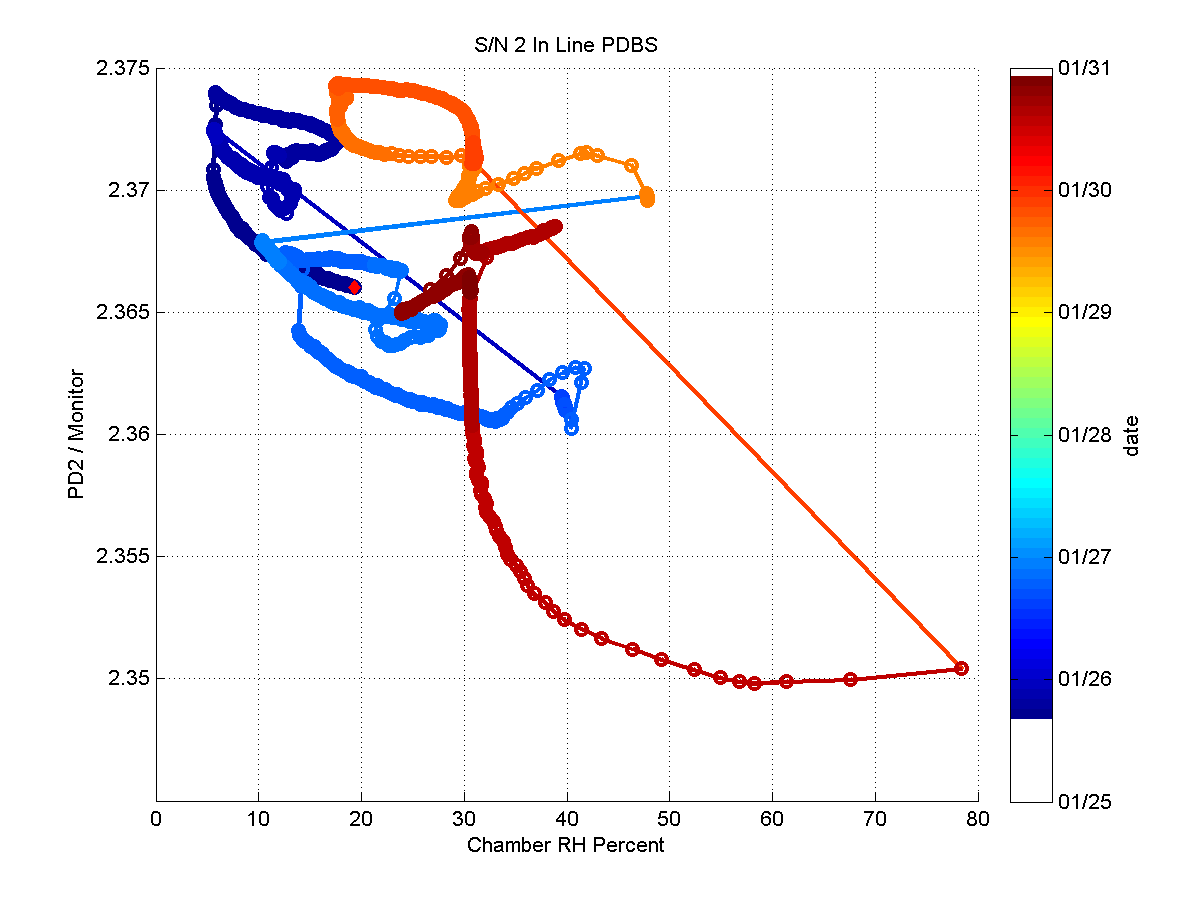
Figure 19: Normalized Chl 2 (by the monitor) vs chamber RH, with the color bar indicating time. The red diamond is the start of the series. The output increases with decreasing humidity for portions of the runs.