REVISION DATE: 07-Feb-2018 15:01:57
06Feb18 was repeat of 05Feb18 (22deg C, 30%RH) except the chamber door was open overnight so the RH settled in at the lab ambient, and the 06Feb run started with ~22% RH
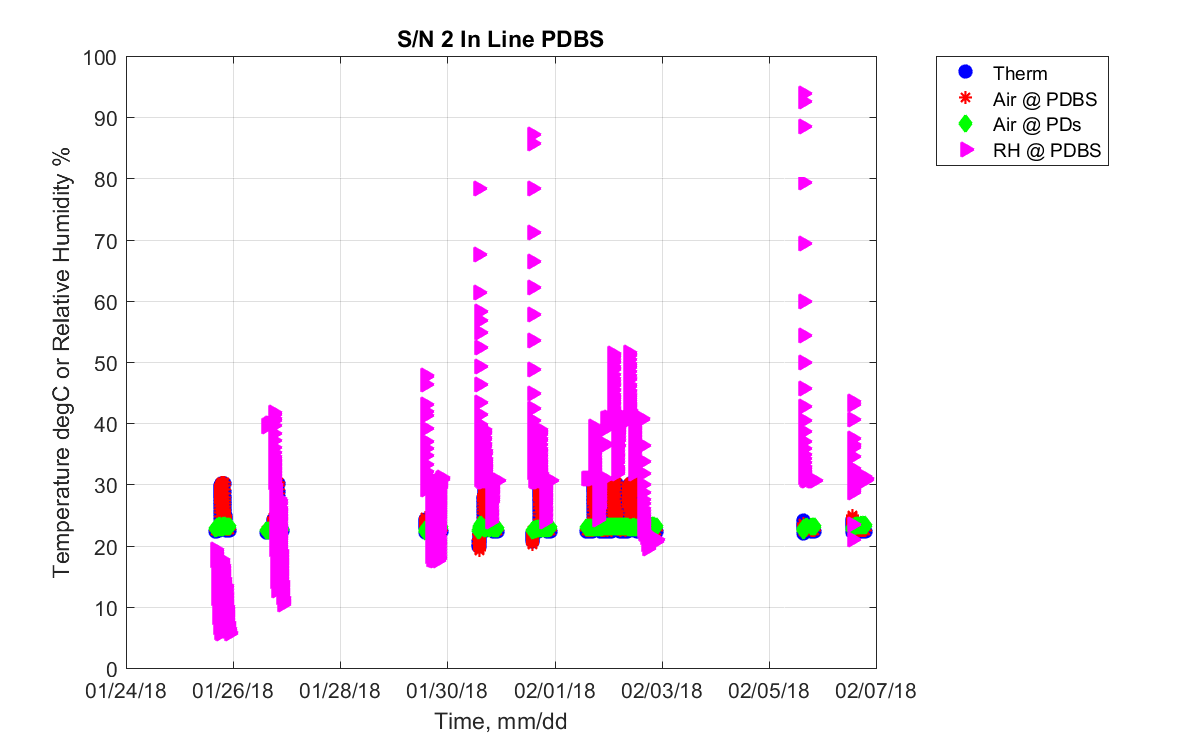
Figure 1: Time series of the temperature and humidity values, to date, from the Fluke and the thermistor. X axis is Time in 2018, Y axis is both temperature in deg C or RH in percent. Zoomed Time series for temperatures and RH zoomed in for each day
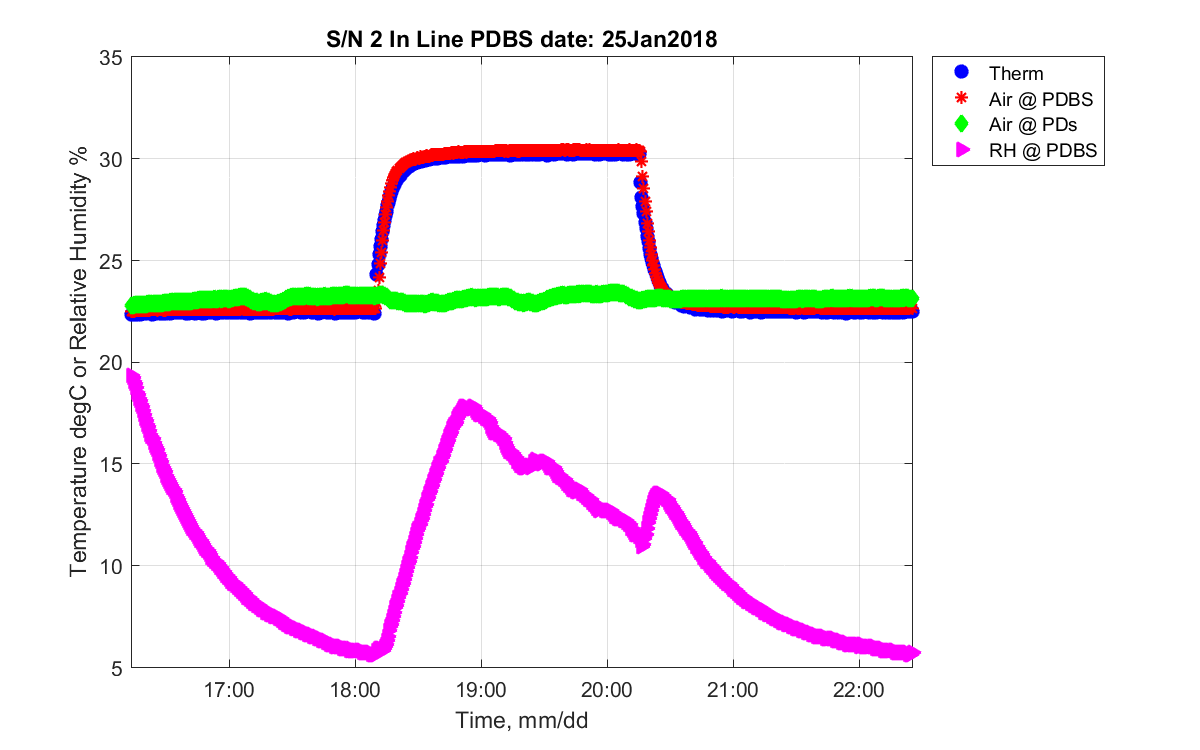
Figure 2: Zoomed Time series for temperatures and RH zoomed in for each day
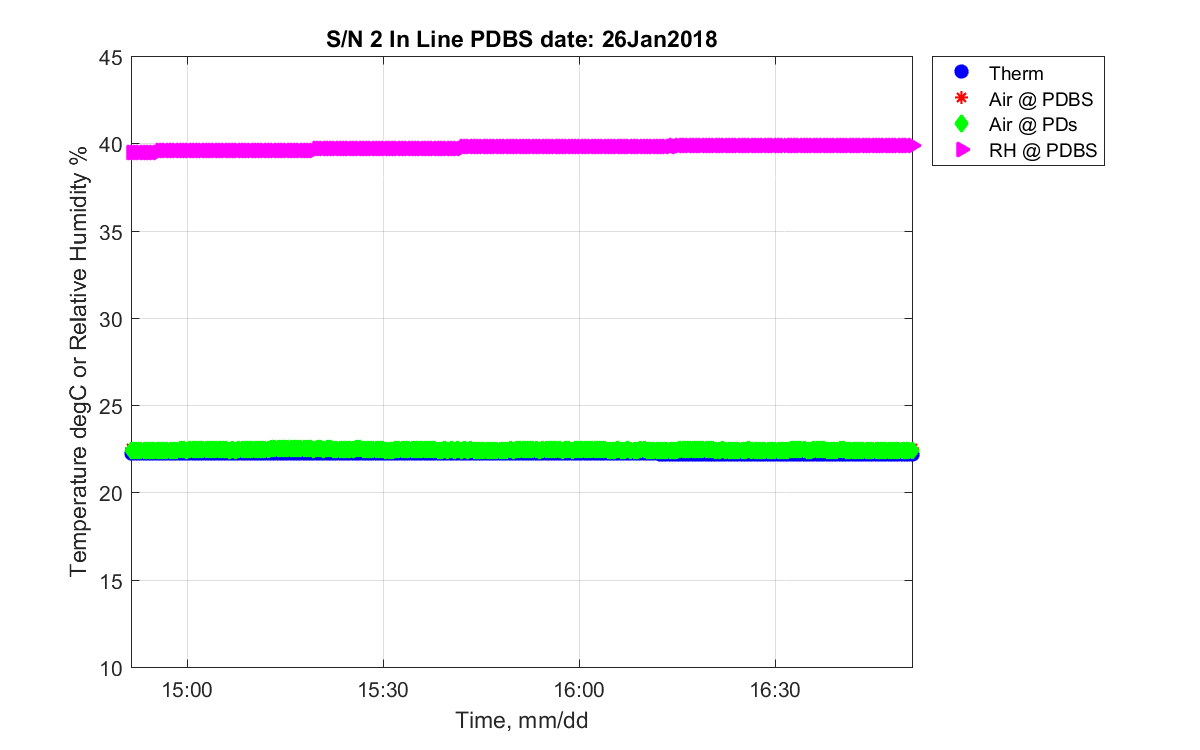
Figure 3: Zoomed Time series for temperatures and RH zoomed in for each day

Figure 4: Zoomed Time series for temperatures and RH zoomed in for each day

Figure 5: Zoomed Time series for temperatures and RH zoomed in for each day

Figure 6: Zoomed Time series for temperatures and RH zoomed in for each day
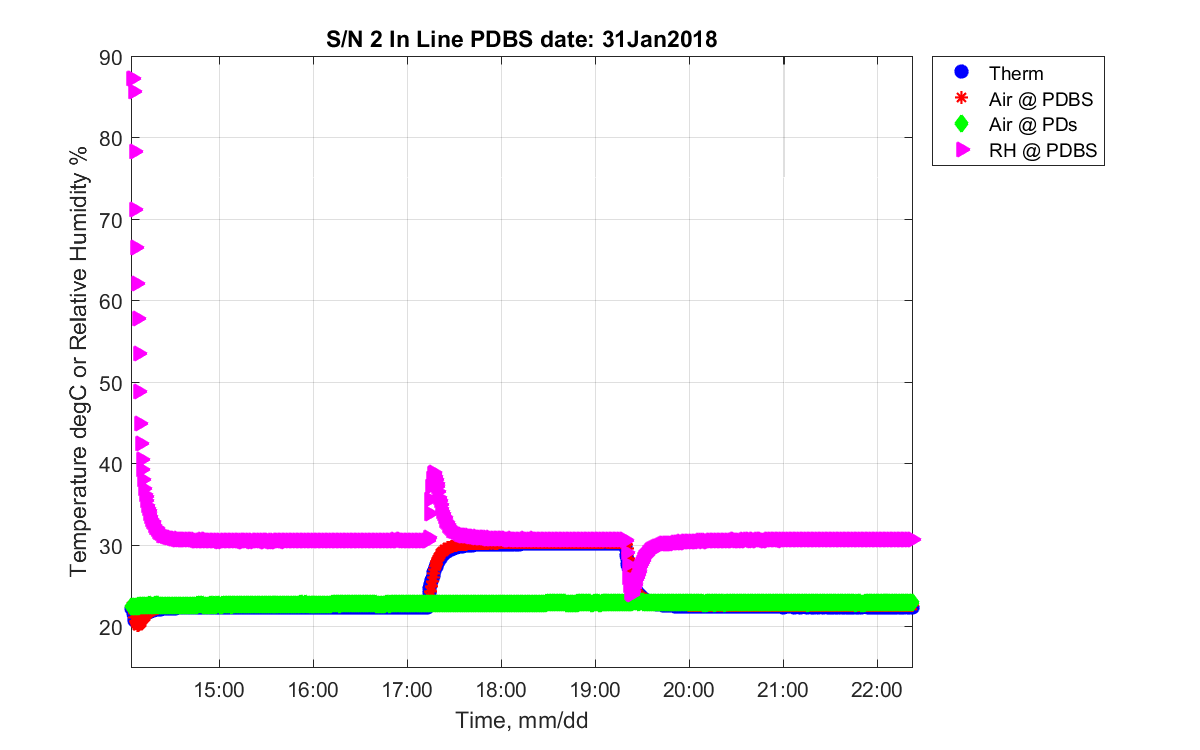
Figure 7: Zoomed Time series for temperatures and RH zoomed in for each day
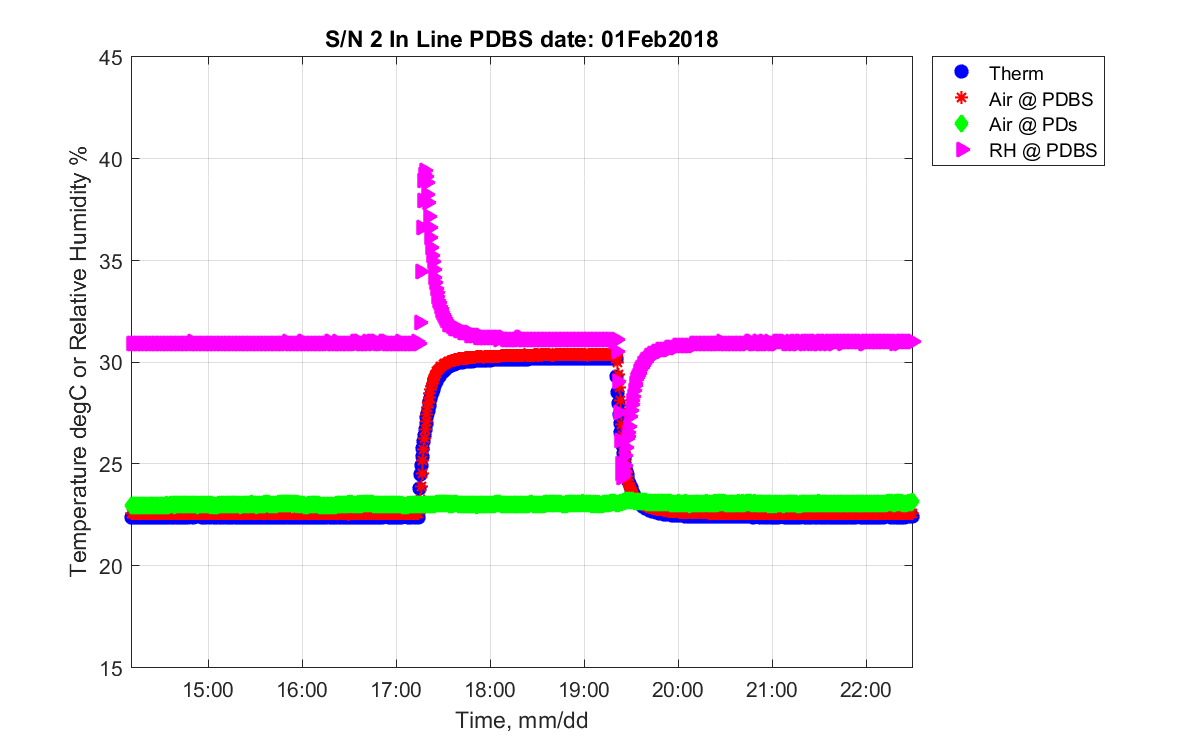
Figure 8: Zoomed Time series for temperatures and RH zoomed in for each day
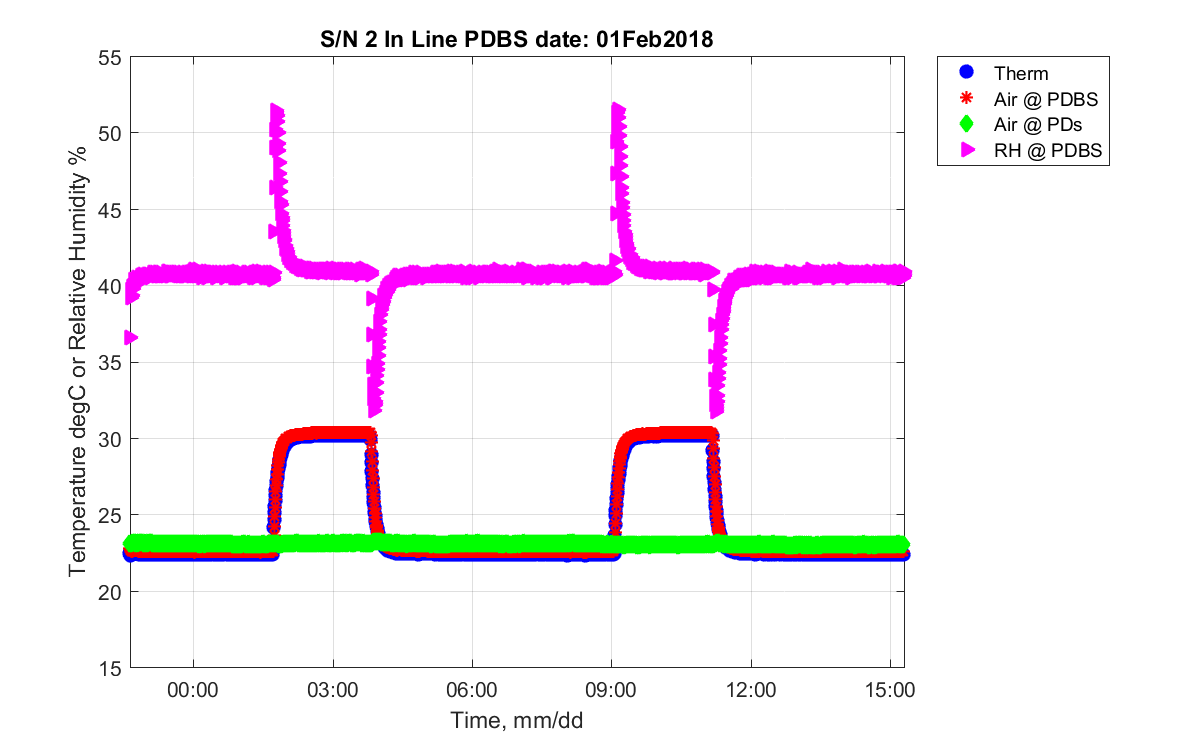
Figure 9: Zoomed Time series for temperatures and RH zoomed in for each day
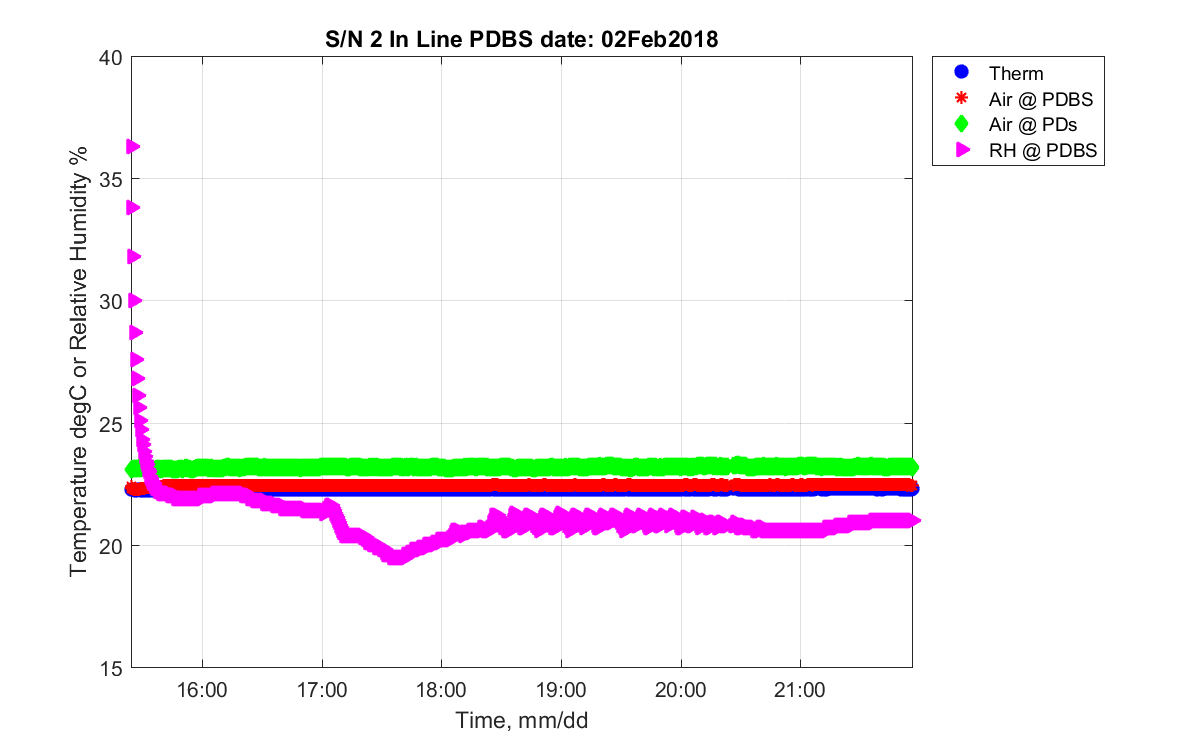
Figure 10: Zoomed Time series for temperatures and RH zoomed in for each day

Figure 11: Zoomed Time series for temperatures and RH zoomed in for each day
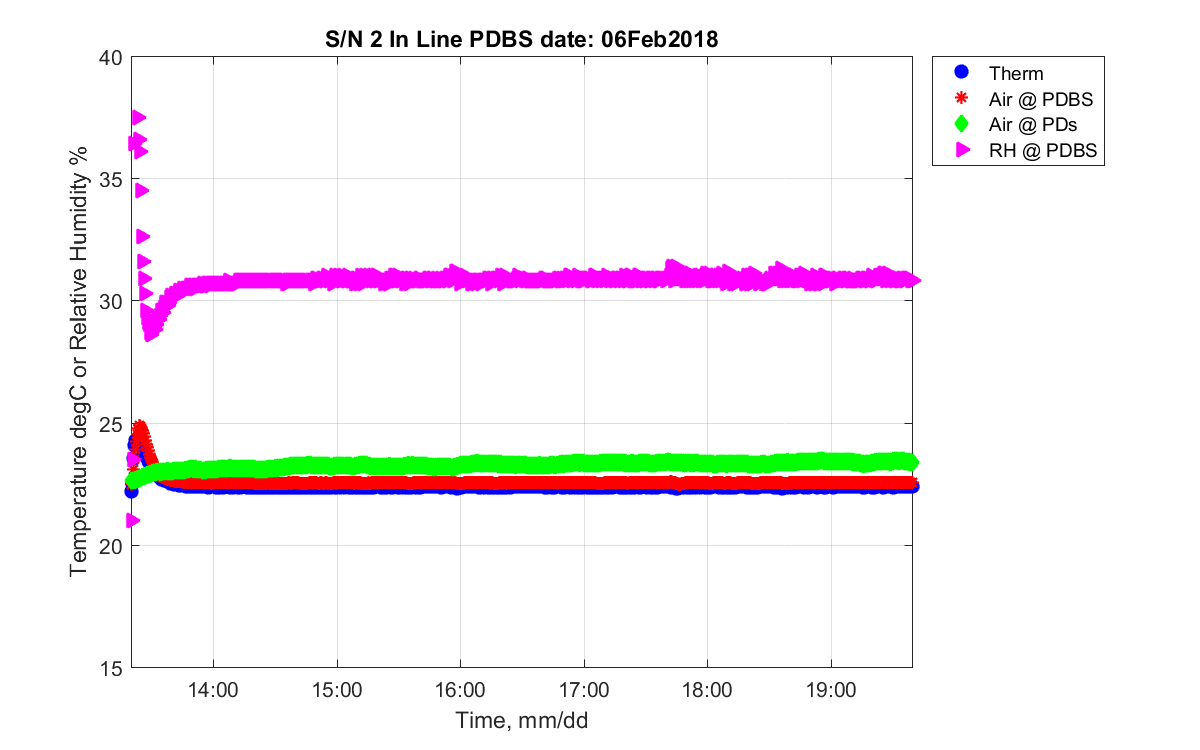
Figure 12: Zoomed Time series for temperatures and RH zoomed in for each day

Figure 13: The ratio Chl 1 / Chl 2, or the reflective PDBS/Mirror channel divided by the through PDBS channel. Typical values (at gain 10^7 for the S2281’s) are 170 mV and 700 mV. The ratios were normalized by the first value on 25-Jan-2018 and converted to percent (y axis). zoomed Time series of ratios for each day
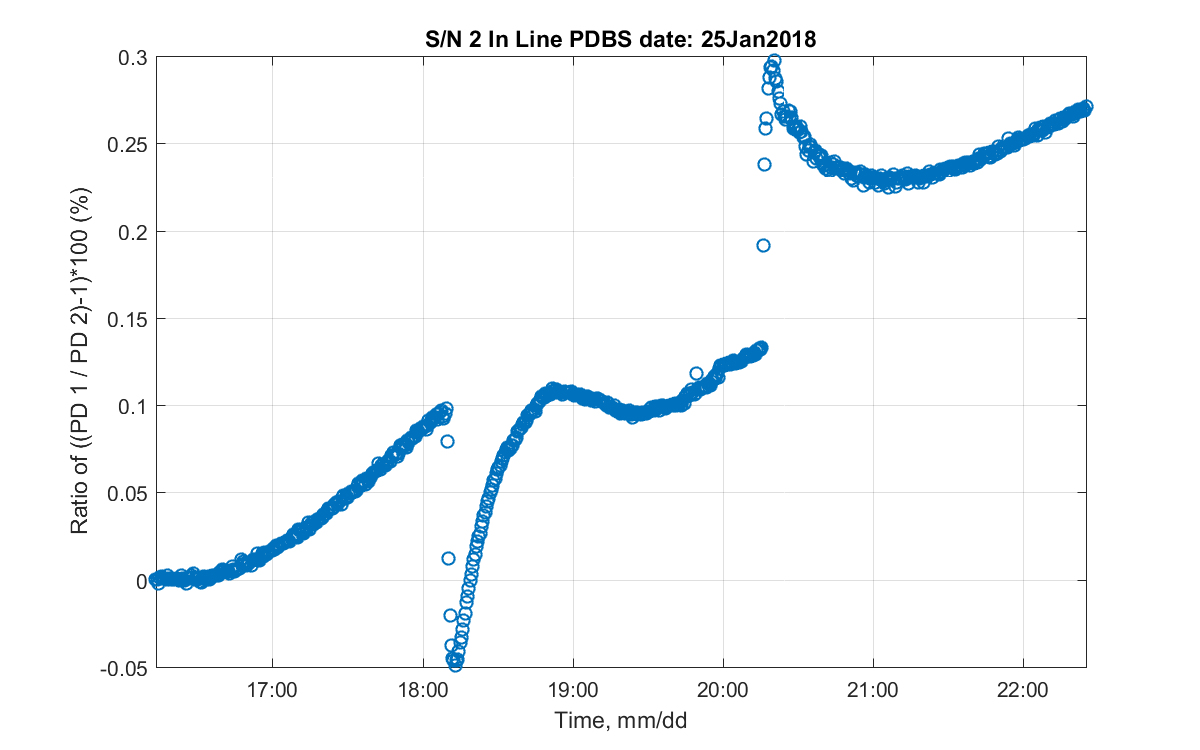
Figure 14: zoomed Time series of ratios for each day
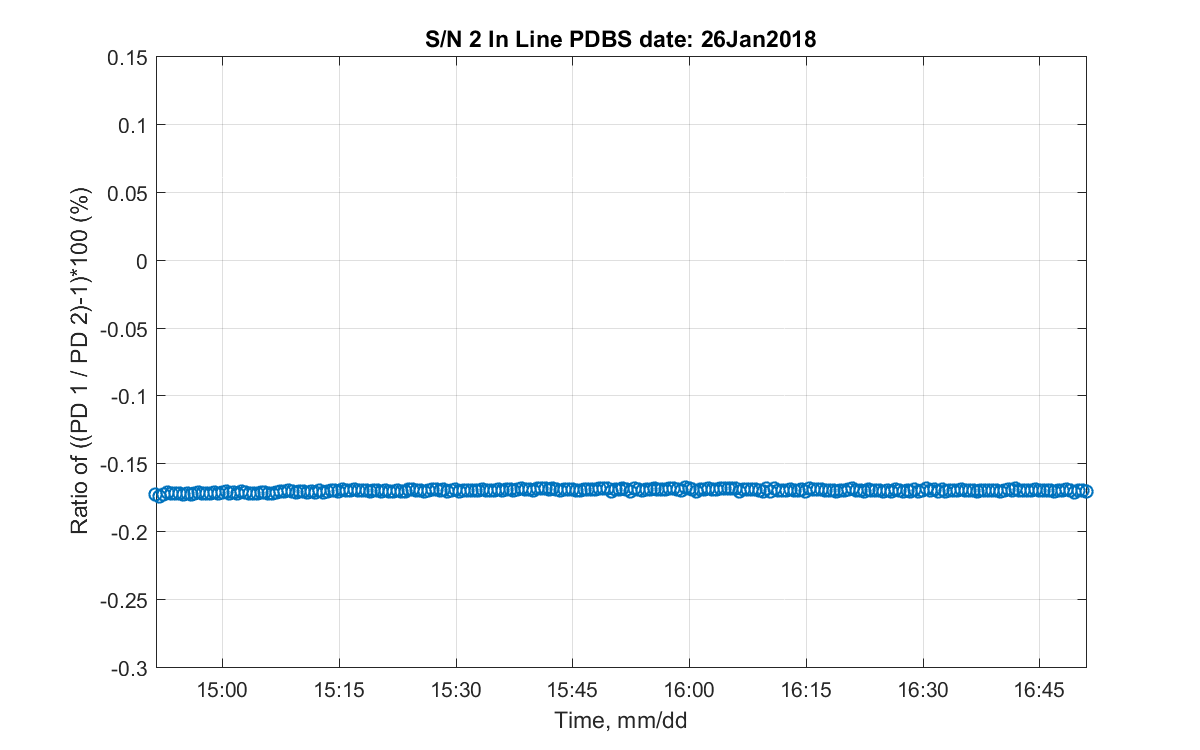
Figure 15: zoomed Time series of ratios for each day
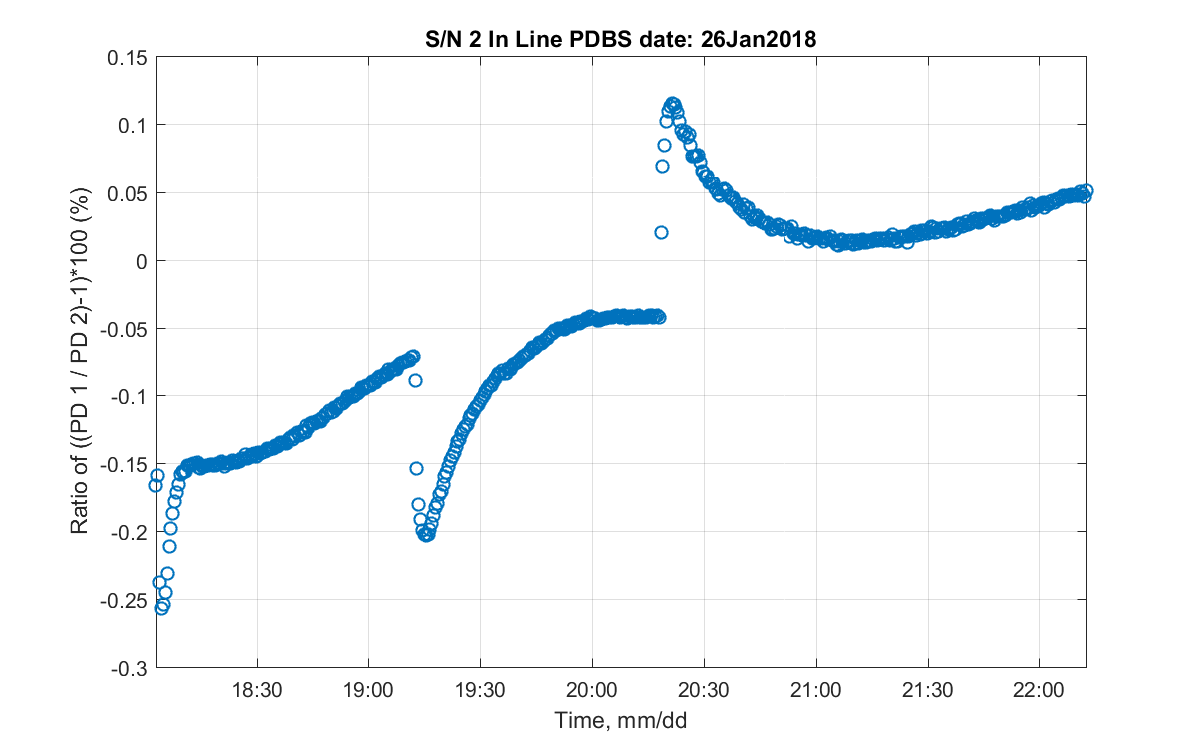
Figure 16: zoomed Time series of ratios for each day

Figure 17: zoomed Time series of ratios for each day
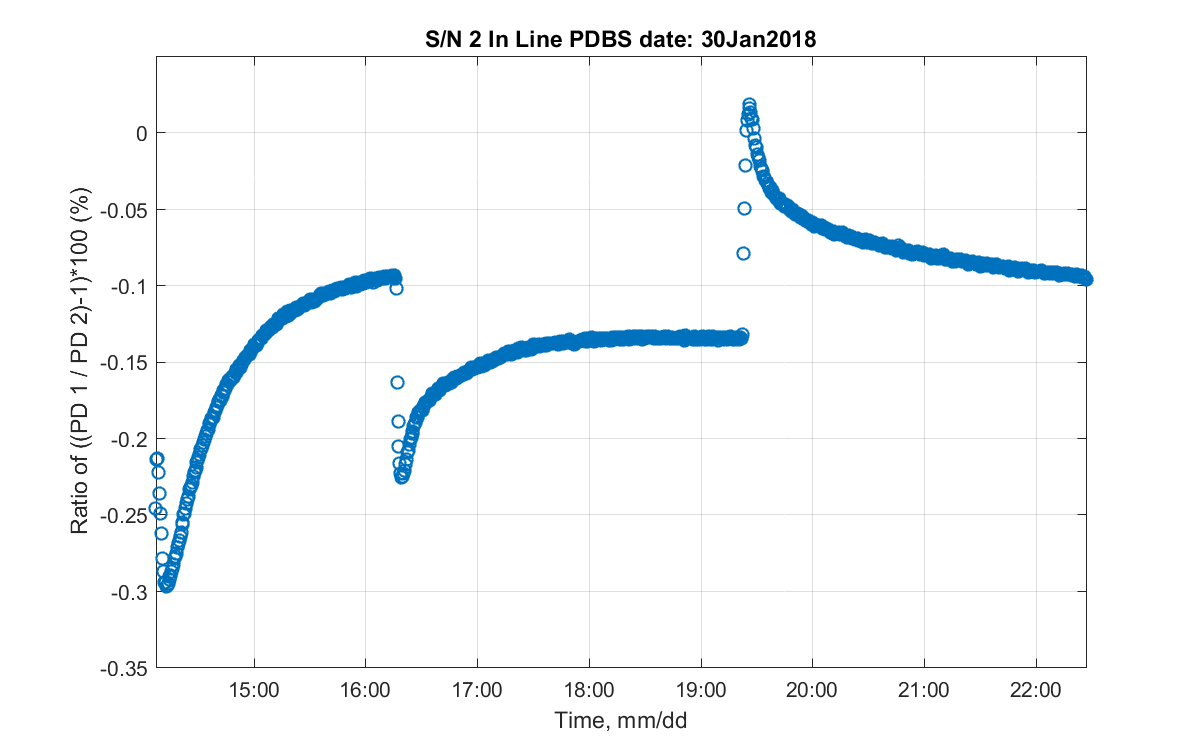
Figure 18: zoomed Time series of ratios for each day

Figure 19: zoomed Time series of ratios for each day
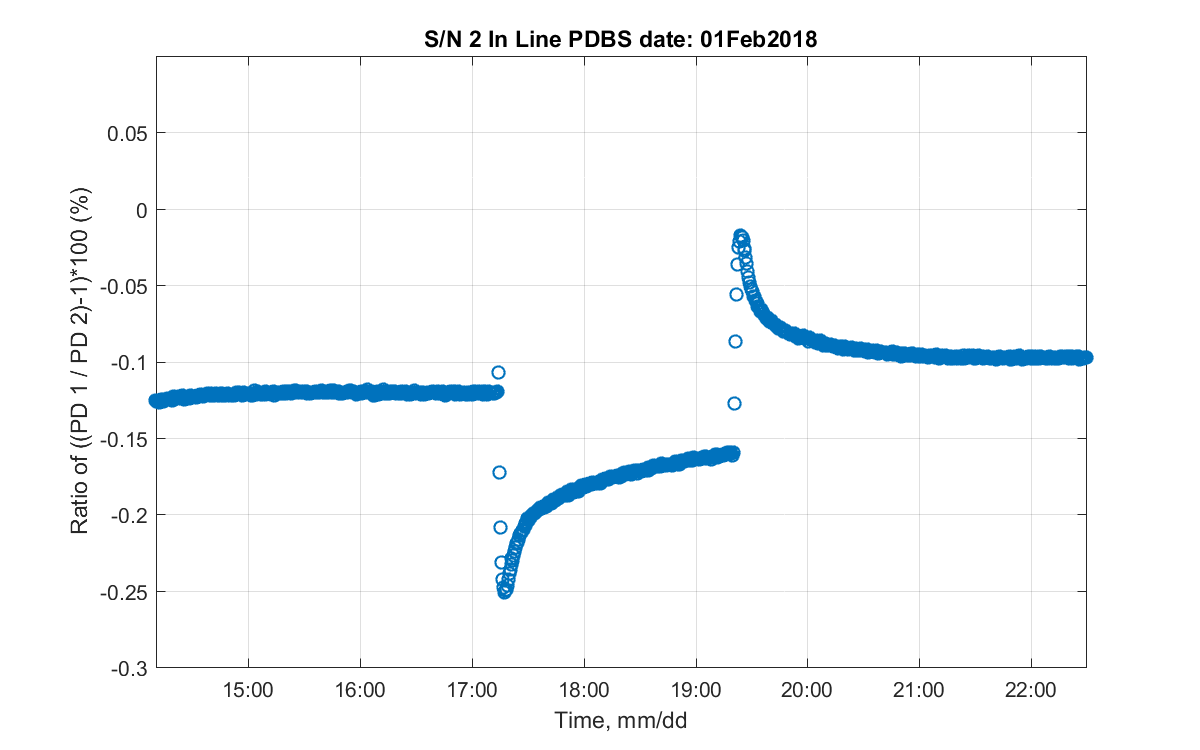
Figure 20: zoomed Time series of ratios for each day
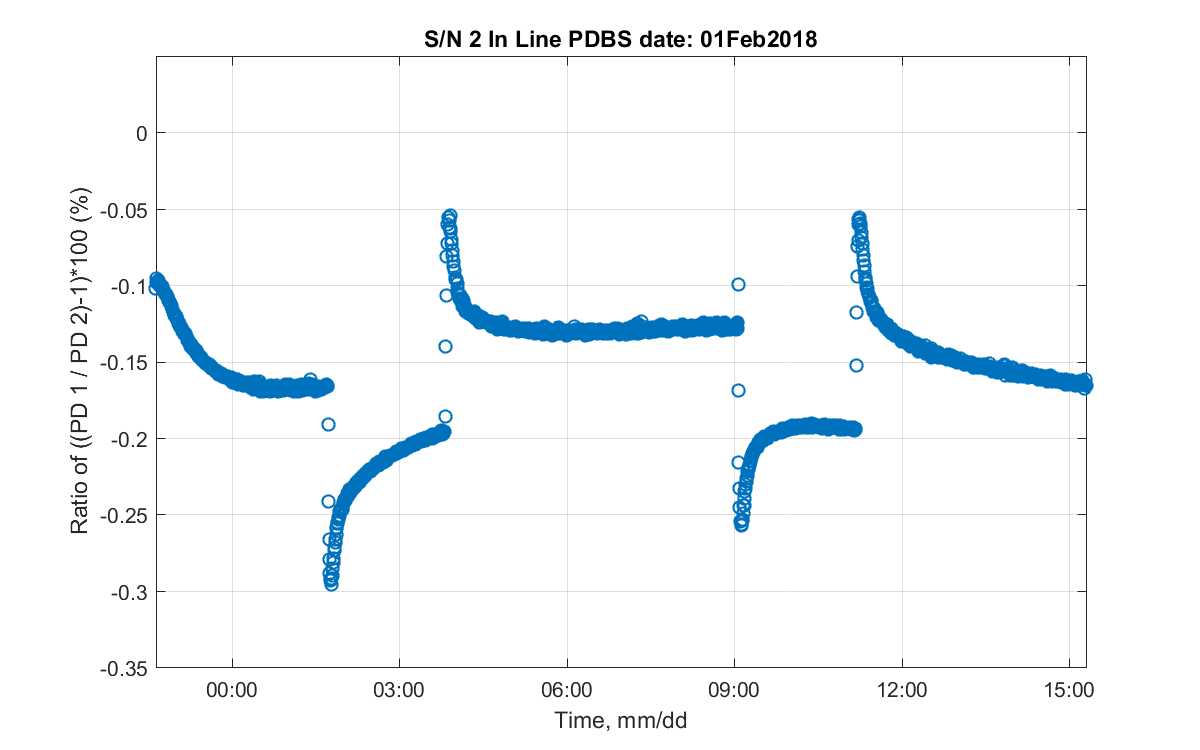
Figure 21: zoomed Time series of ratios for each day
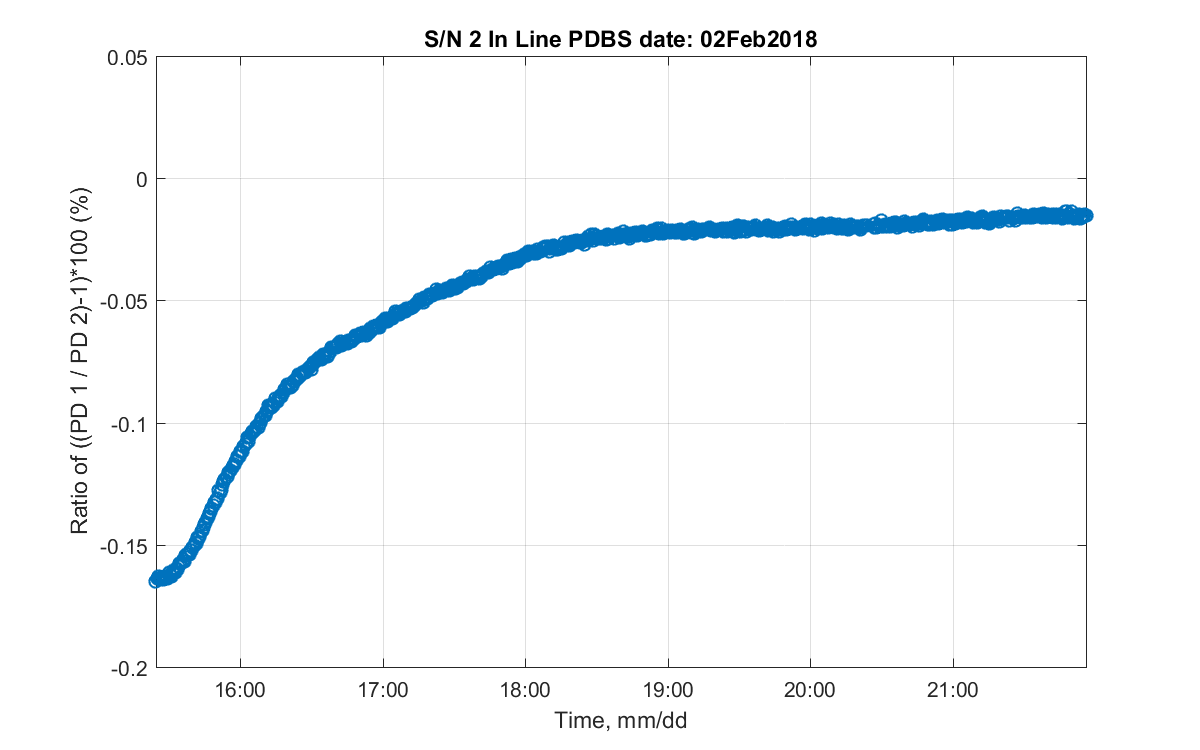
Figure 22: zoomed Time series of ratios for each day
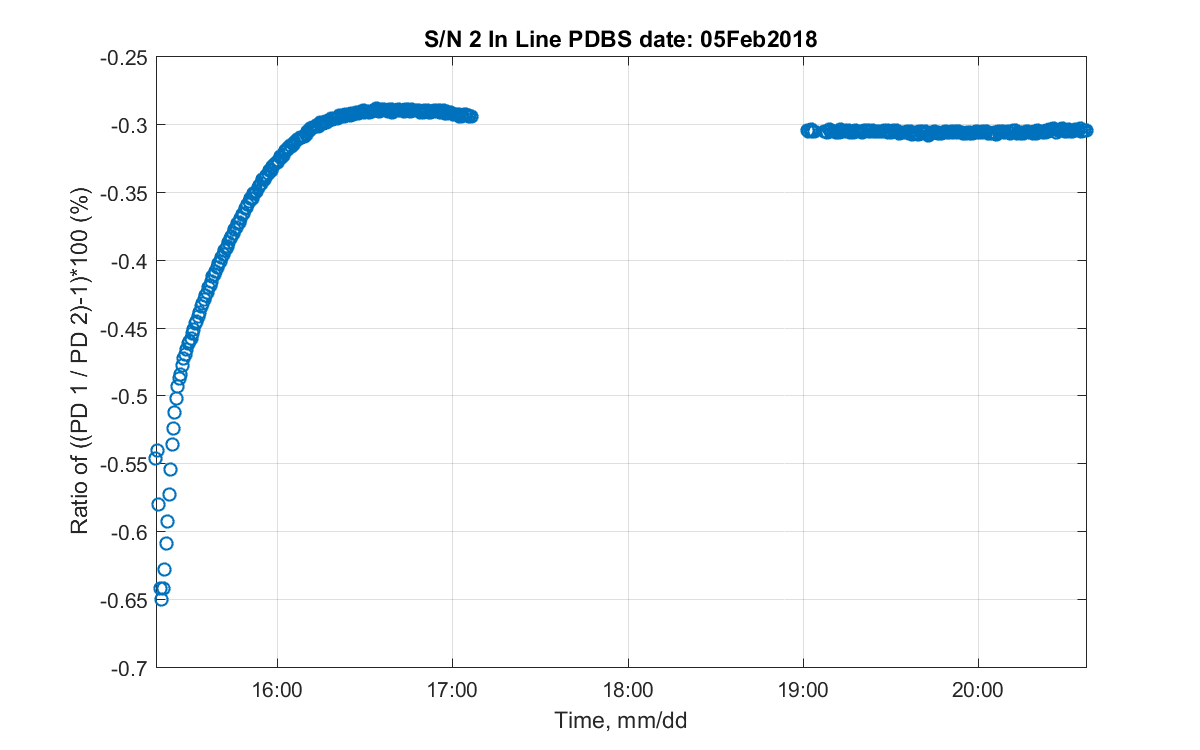
Figure 23: zoomed Time series of ratios for each day
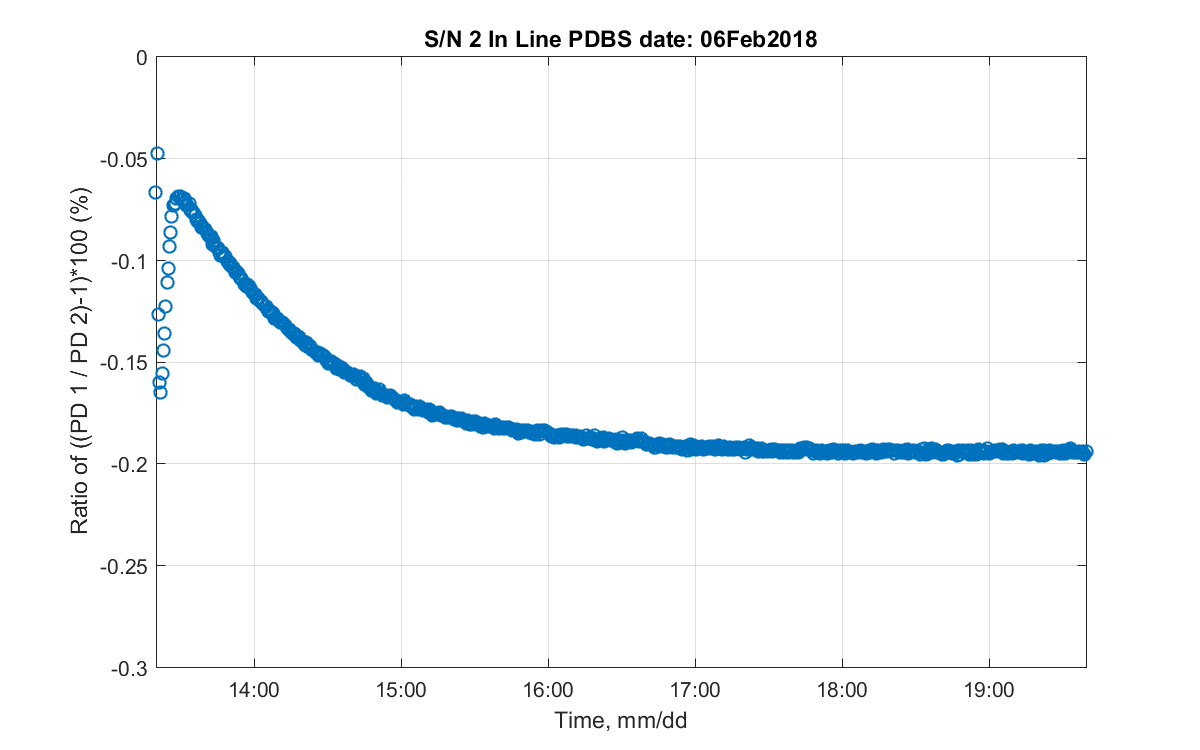
Figure 24: zoomed Time series of ratios for each day
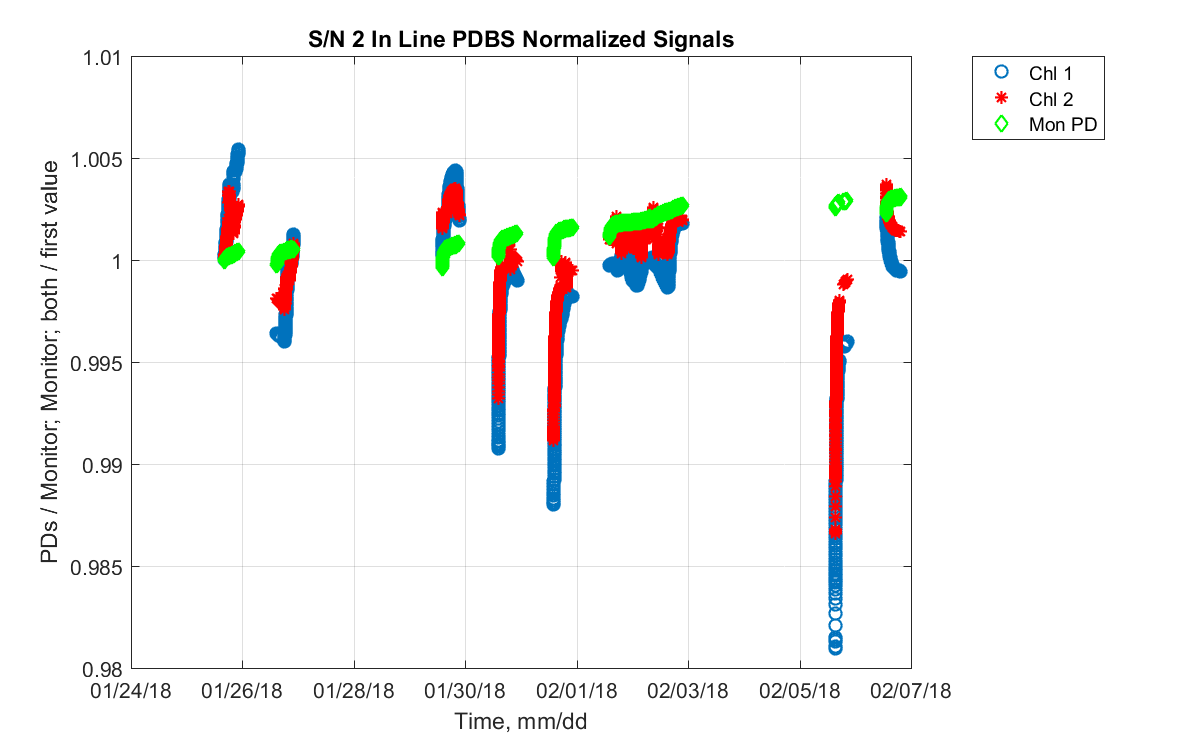
Figure 25: Time series of normalized signals. The sphere monitor PD values are normalized to the first value on 25-Jan-2018. The Chl 1 and Chl 2 values are normalized by the monitor at each point in time, and then normalized to the first value on 25-Jan-2018. We can see that the monitor never changes much, but the output signals, even after normalized to the monitor, change up to 1%. Zoomed normalized signals
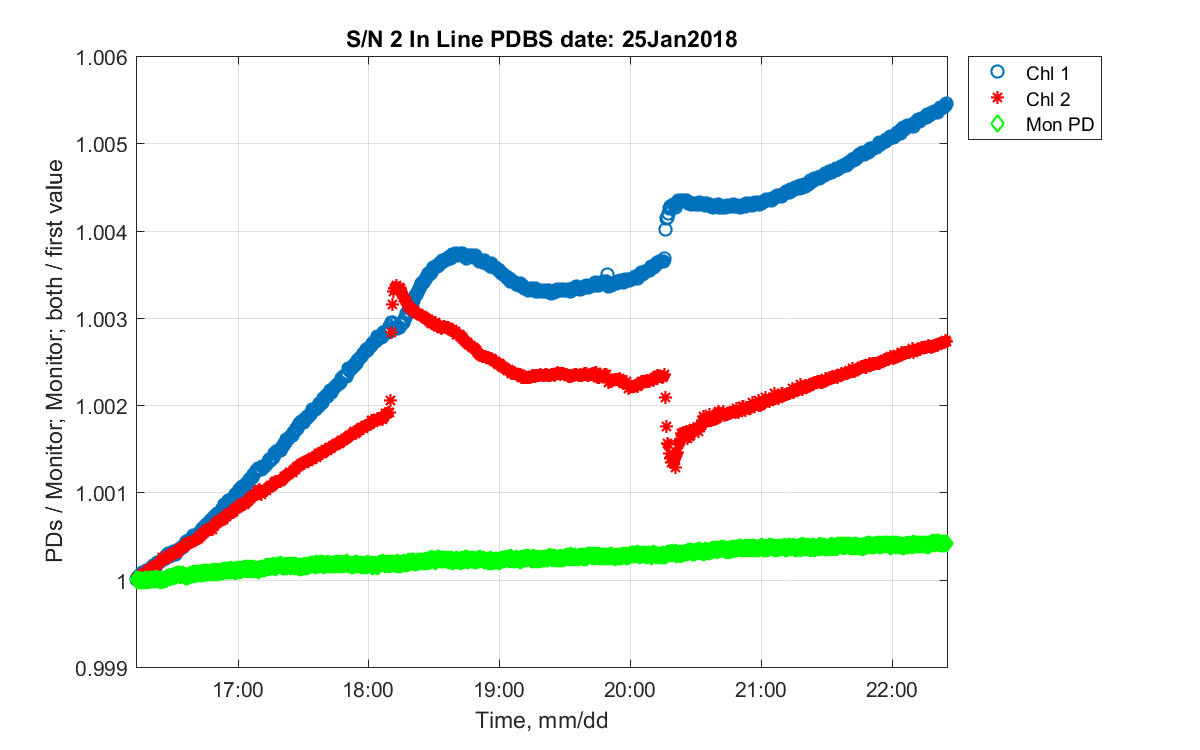
Figure 26: Zoomed normalized signals

Figure 27: Zoomed normalized signals
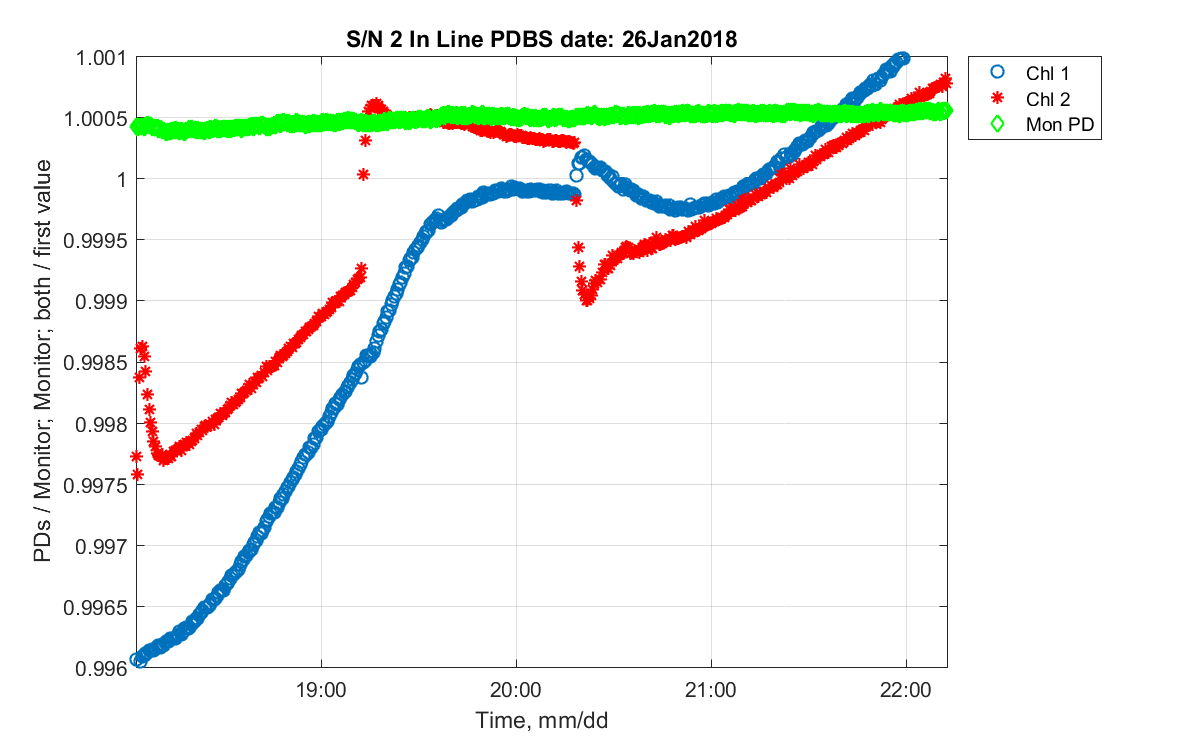
Figure 28: Zoomed normalized signals
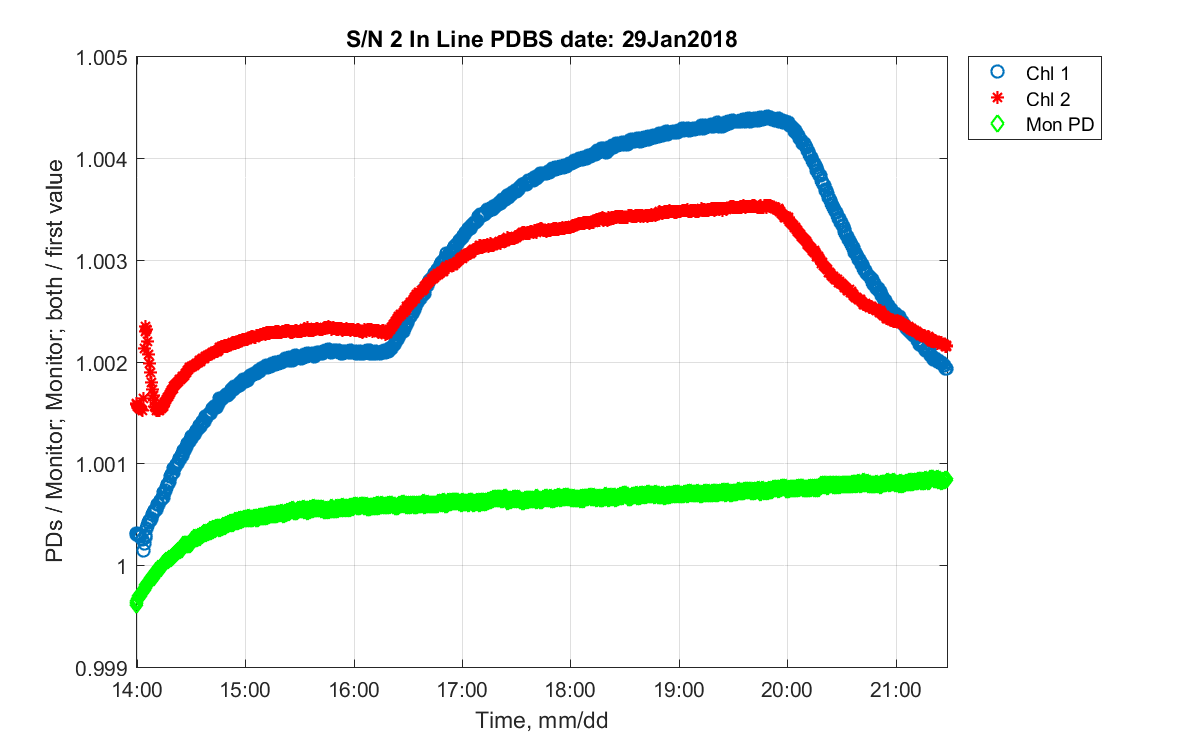
Figure 29: Zoomed normalized signals
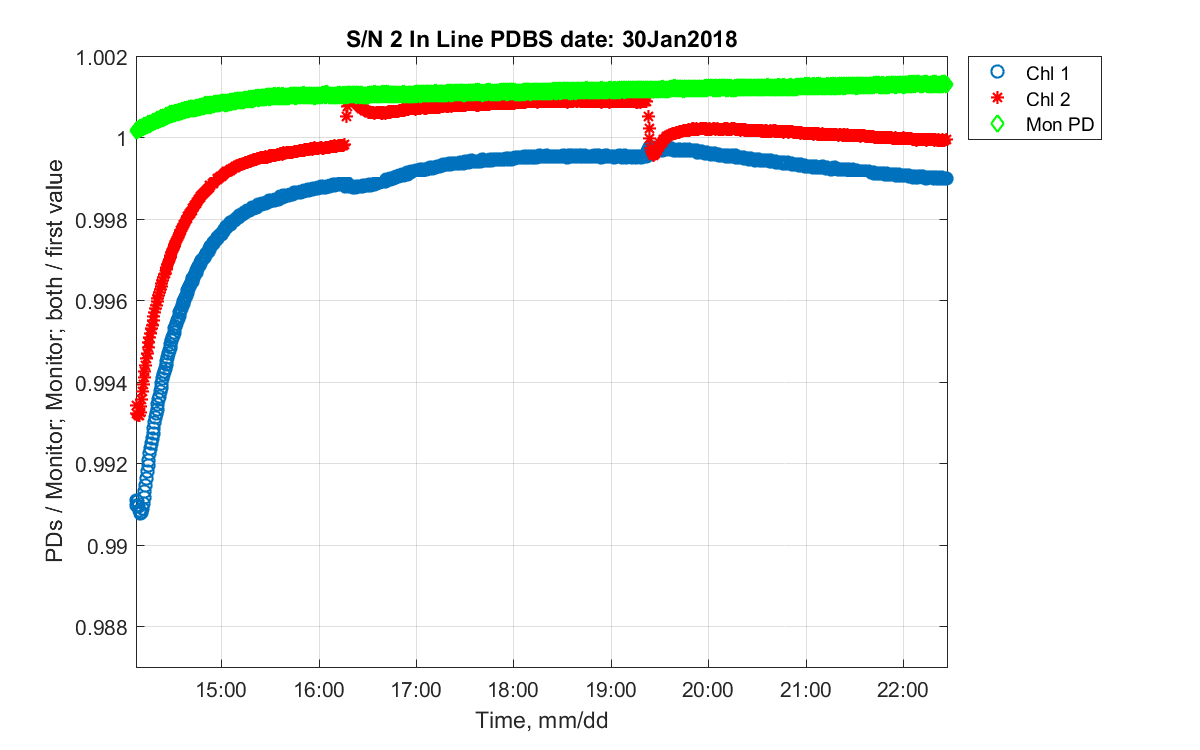
Figure 30: Zoomed normalized signals
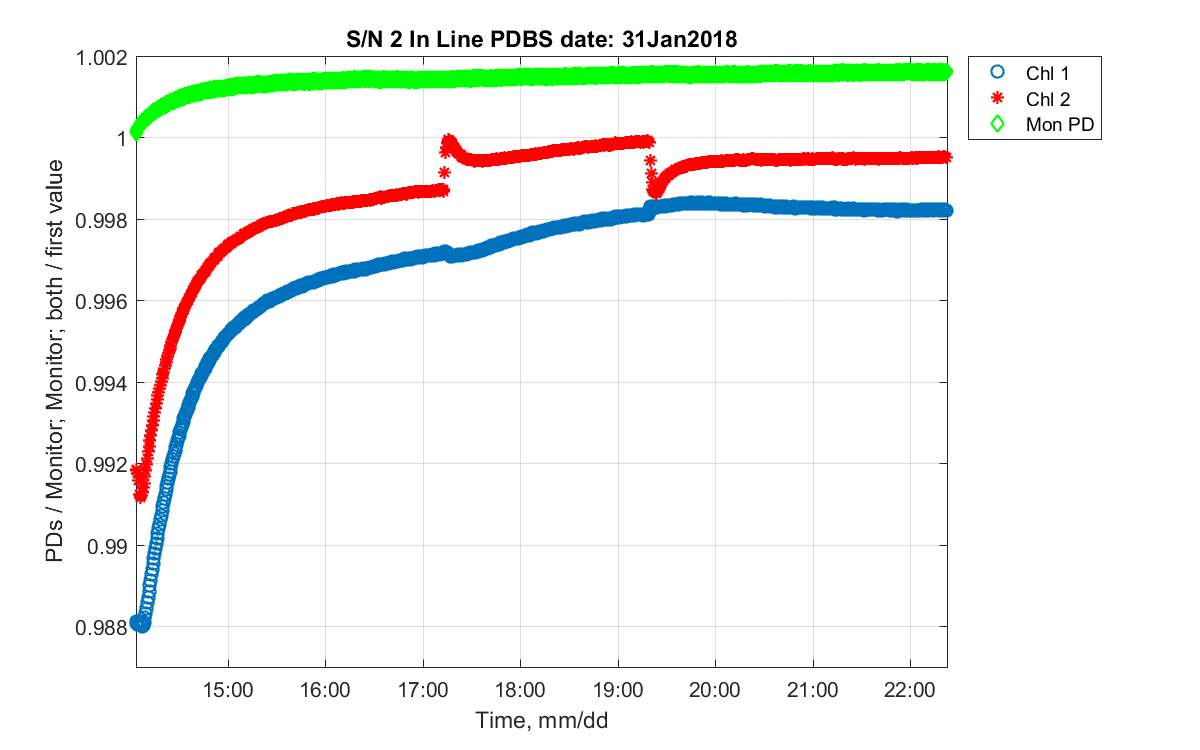
Figure 31: Zoomed normalized signals
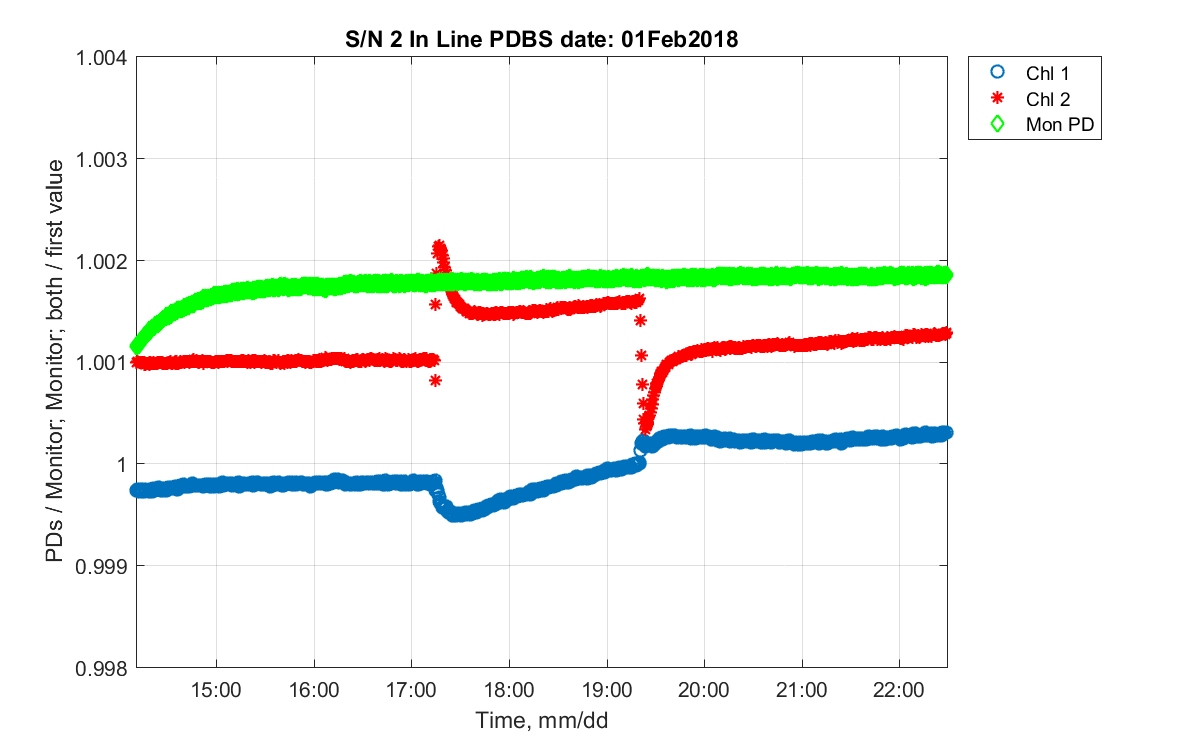
Figure 32: Zoomed normalized signals
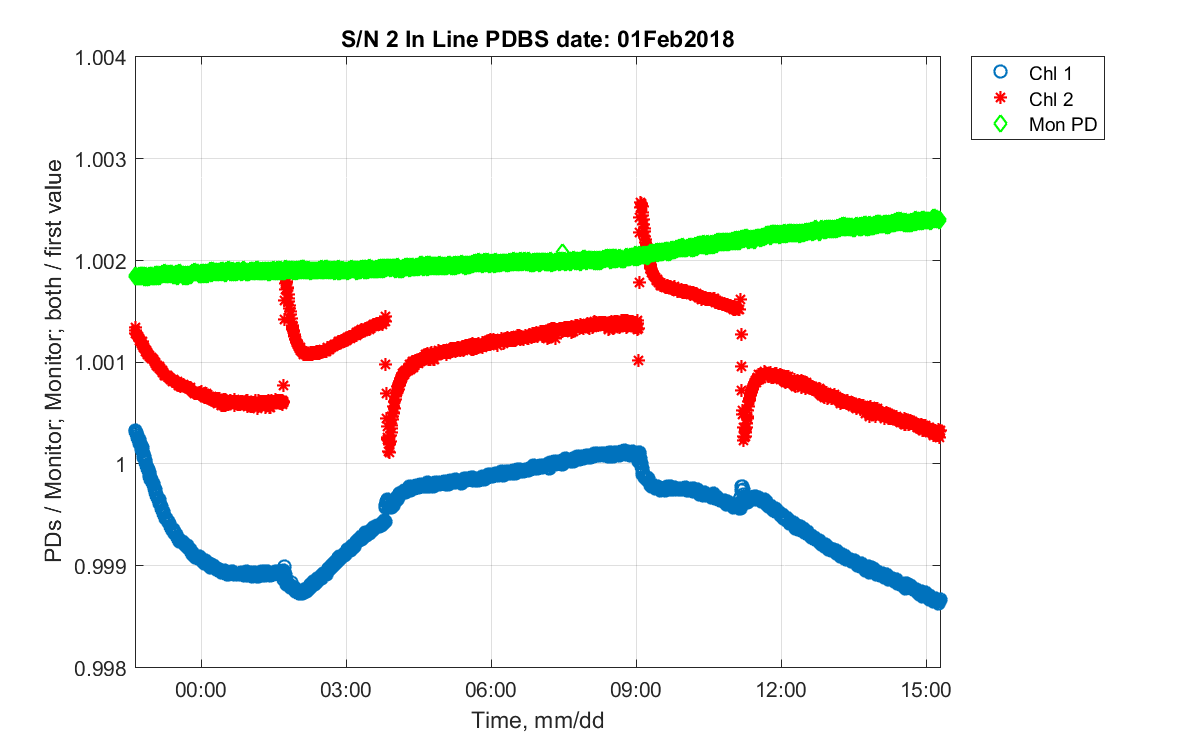
Figure 33: Zoomed normalized signals

Figure 34: Zoomed normalized signals
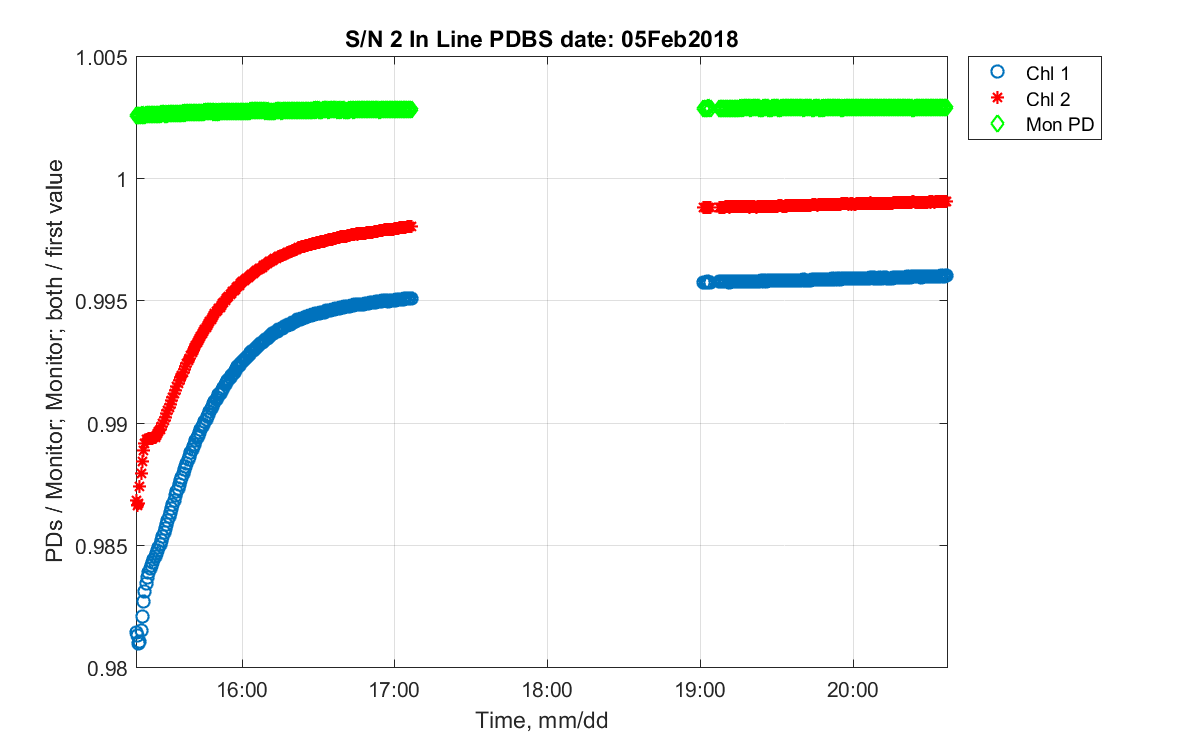
Figure 35: Zoomed normalized signals

Figure 36: Zoomed normalized signals
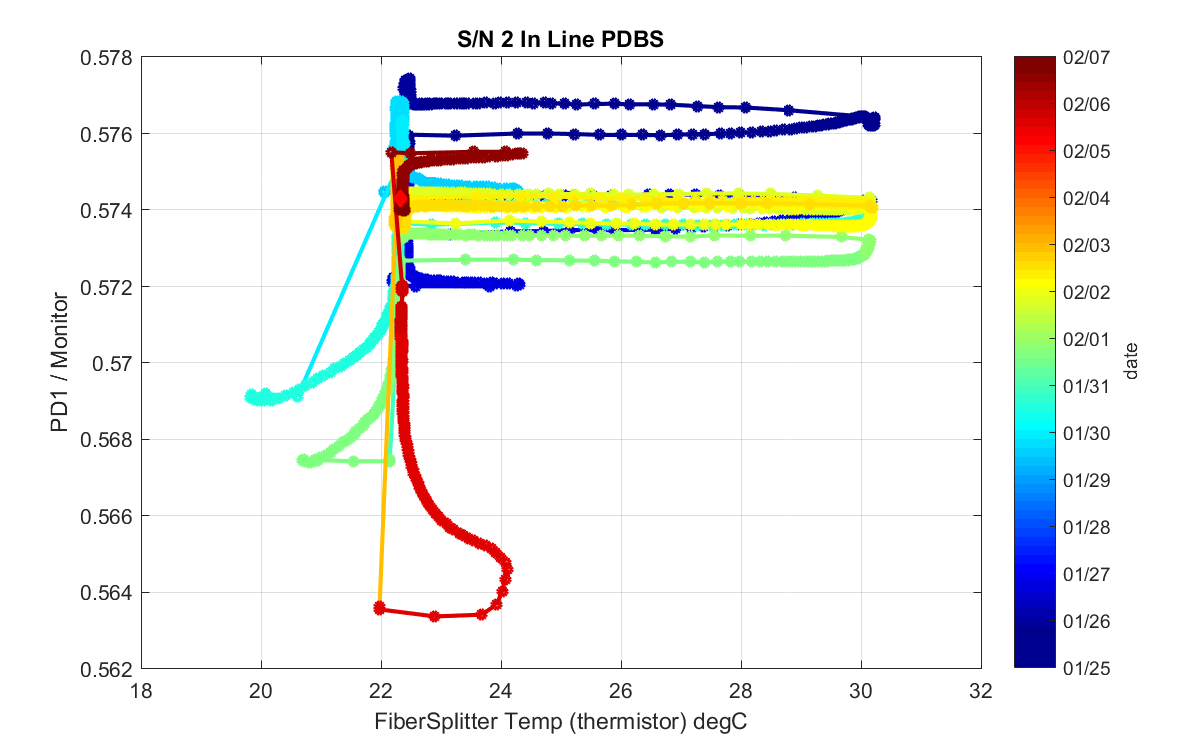
Figure 37: Normalized Chl 1 (by the monitor) vs PDBS temperature, with the color bar indicating time. The red diamond is the start of the series. The two that are in good agreement at 30 deg C are the 26th and 30th.
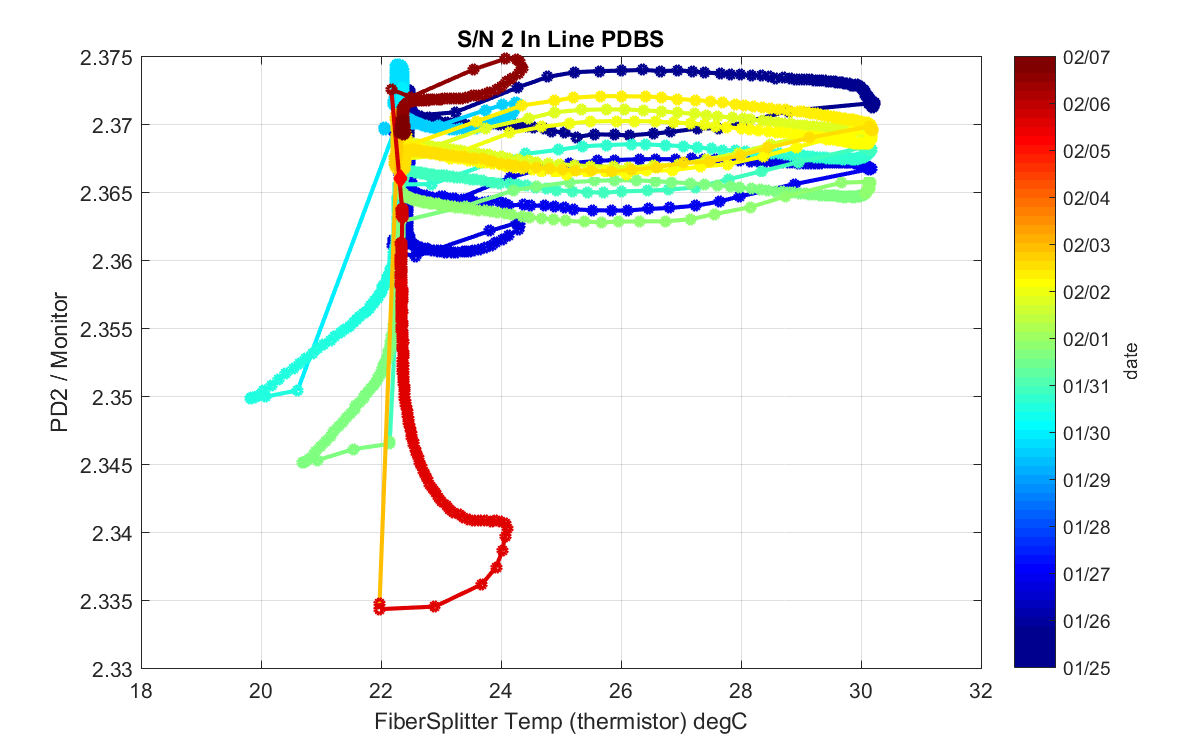
Figure 38: Normalized Chl 2 (by the monitor) vs PDBS temperature, with the color bar indicating time. The red diamond is the start of the series. The two that are in good agreement at 30 deg C are the 26th and 30th.
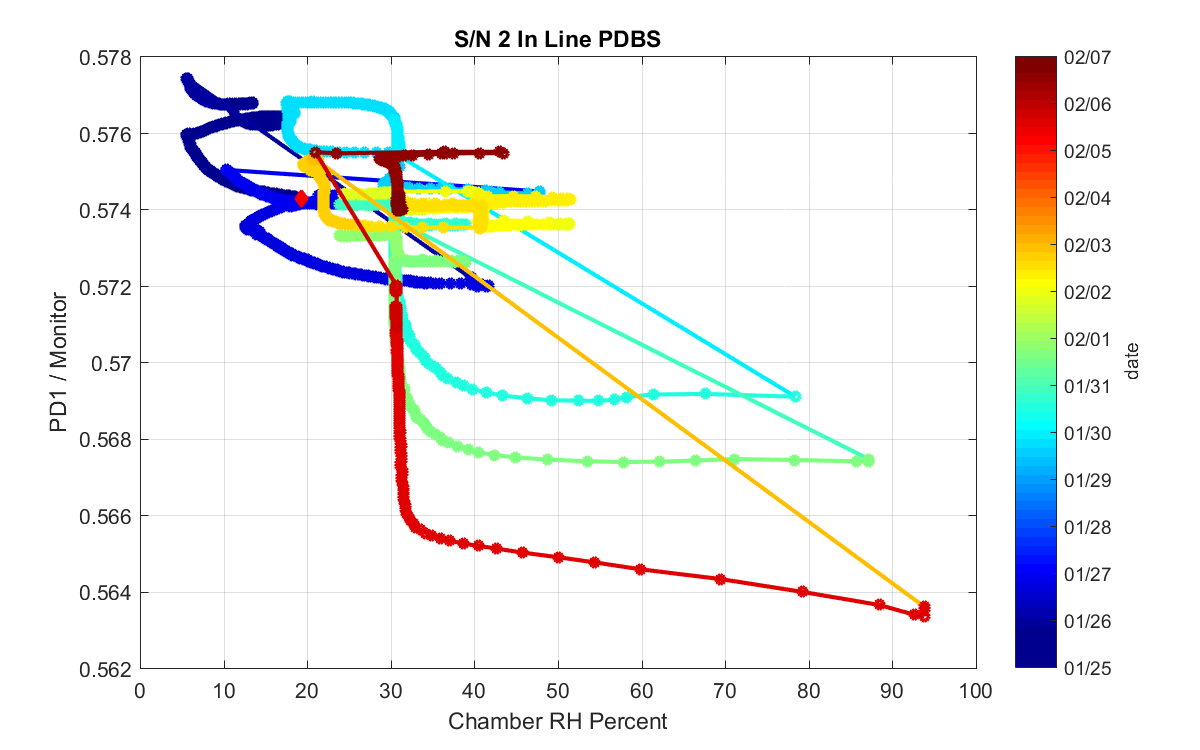
Figure 39: Normalized Chl 1 (by the monitor) vs chamber RH, with the color bar indicating time. The red diamond is the start of the series. The output increases with decreasing humidity for portions of the runs.

Figure 40: Normalized Chl 2 (by the monitor) vs chamber RH, with the color bar indicating time. The red diamond is the start of the series. The output increases with decreasing humidity for portions of the runs.
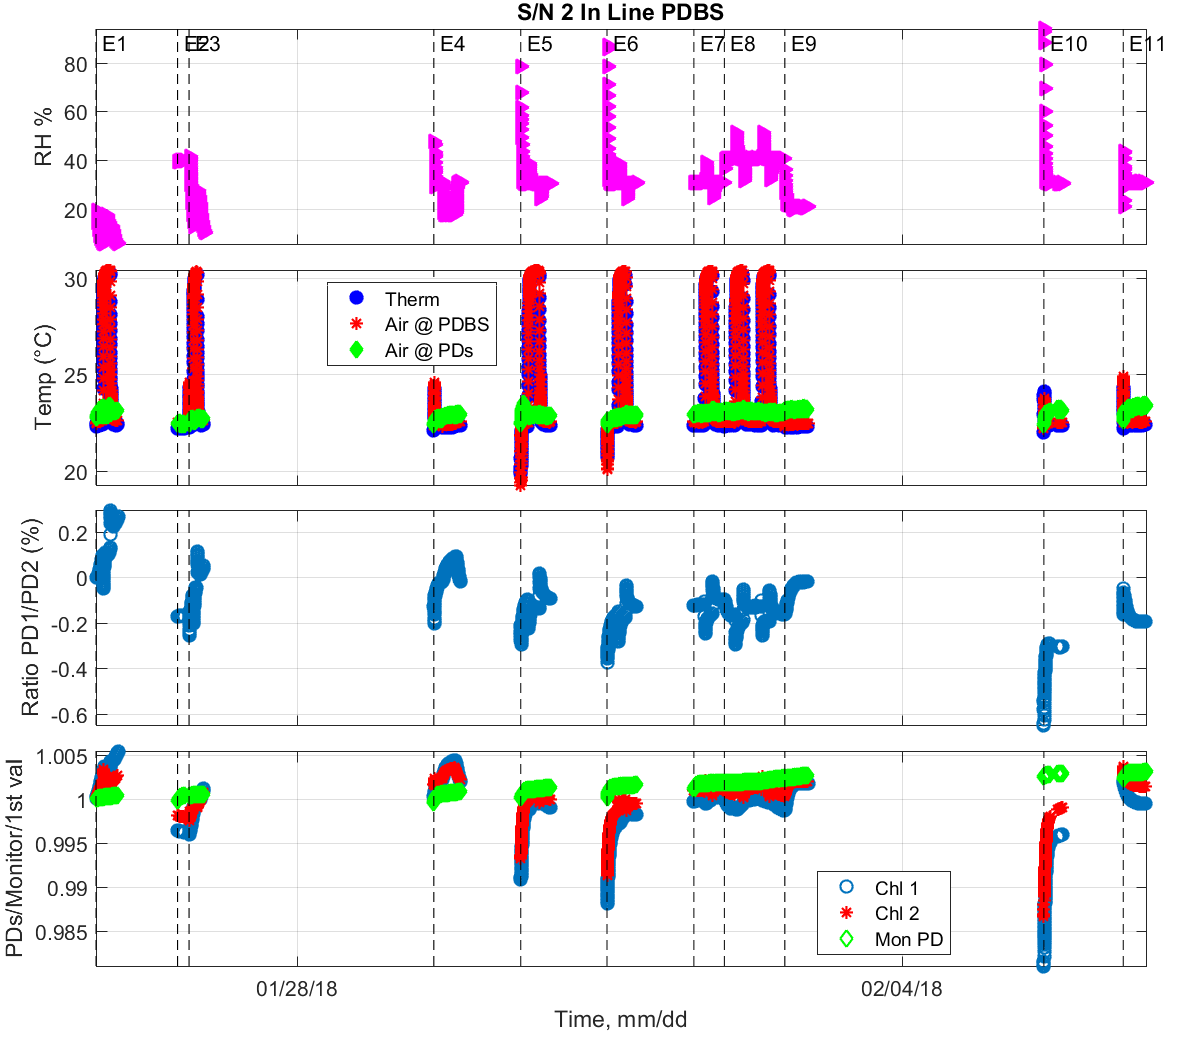
Figure 1: Time series of the temperature and humidity values, to date, from the Fluke and the thermistor. X axis is Time in 2018, Y axis is both temperature in deg C or RH in percent.

Figure 2:
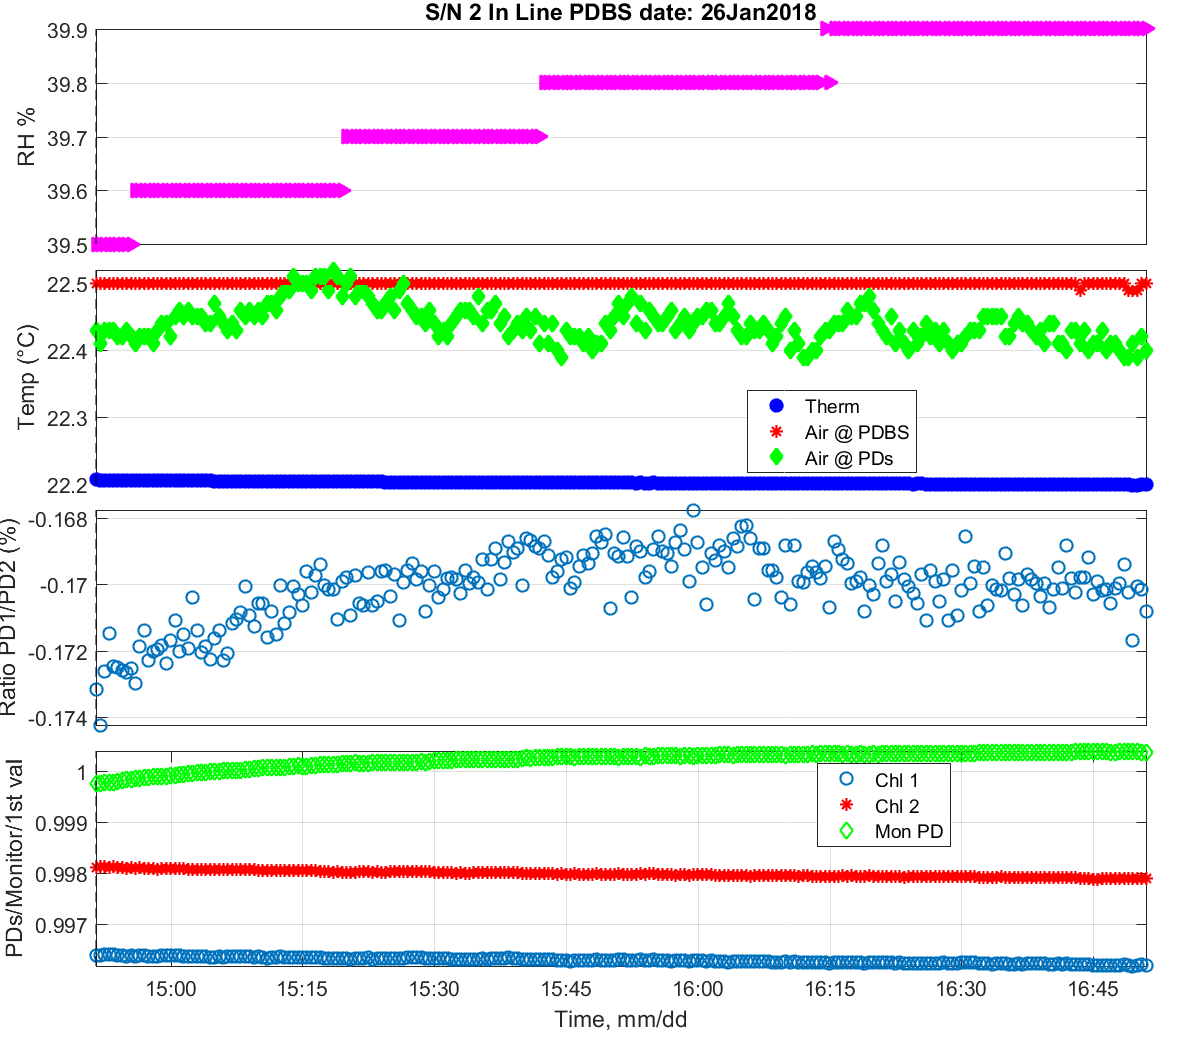
Figure 3:

Figure 4:
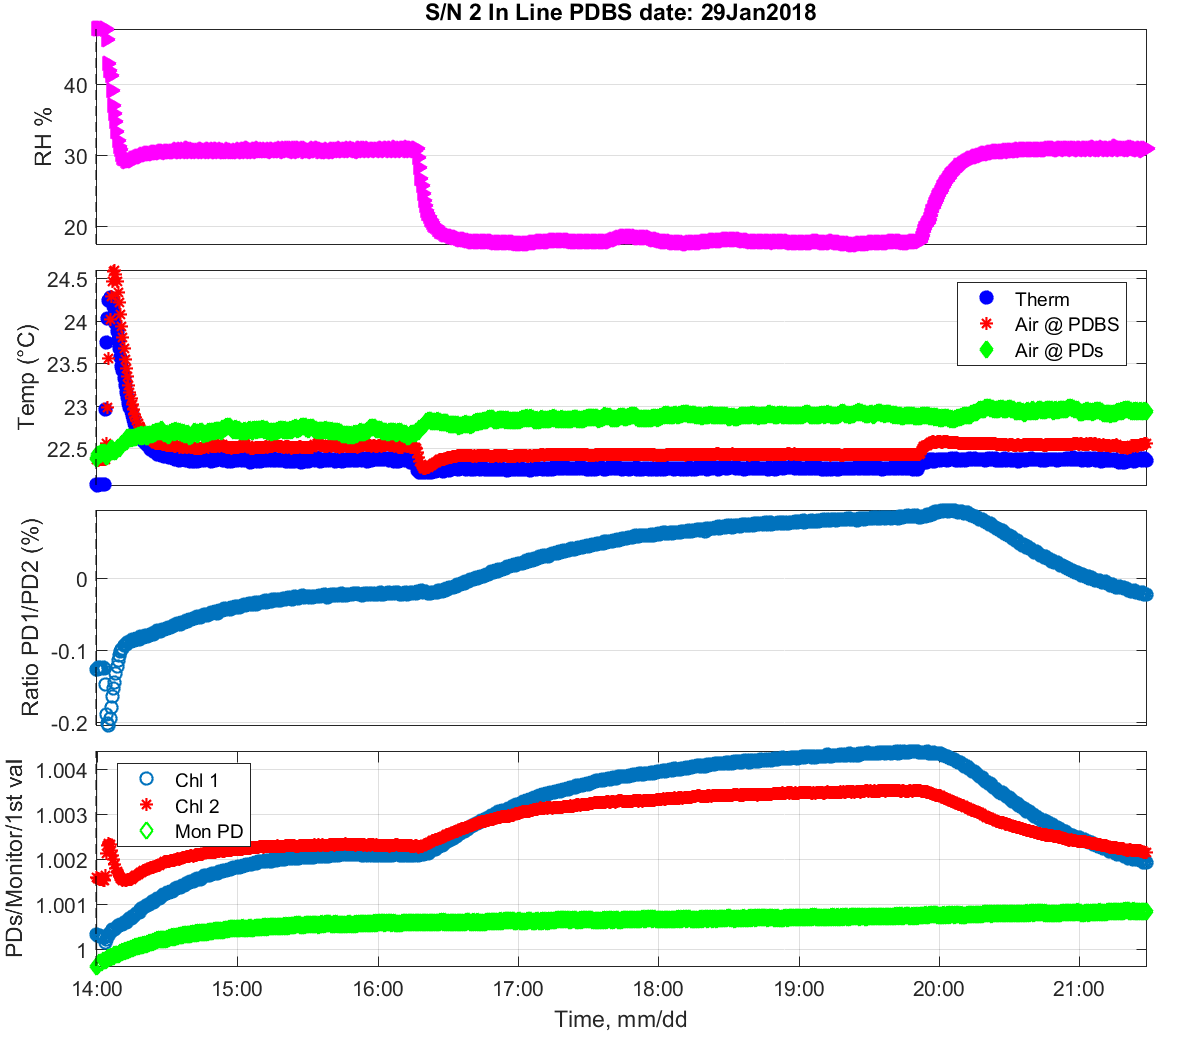
Figure 5:

Figure 6:
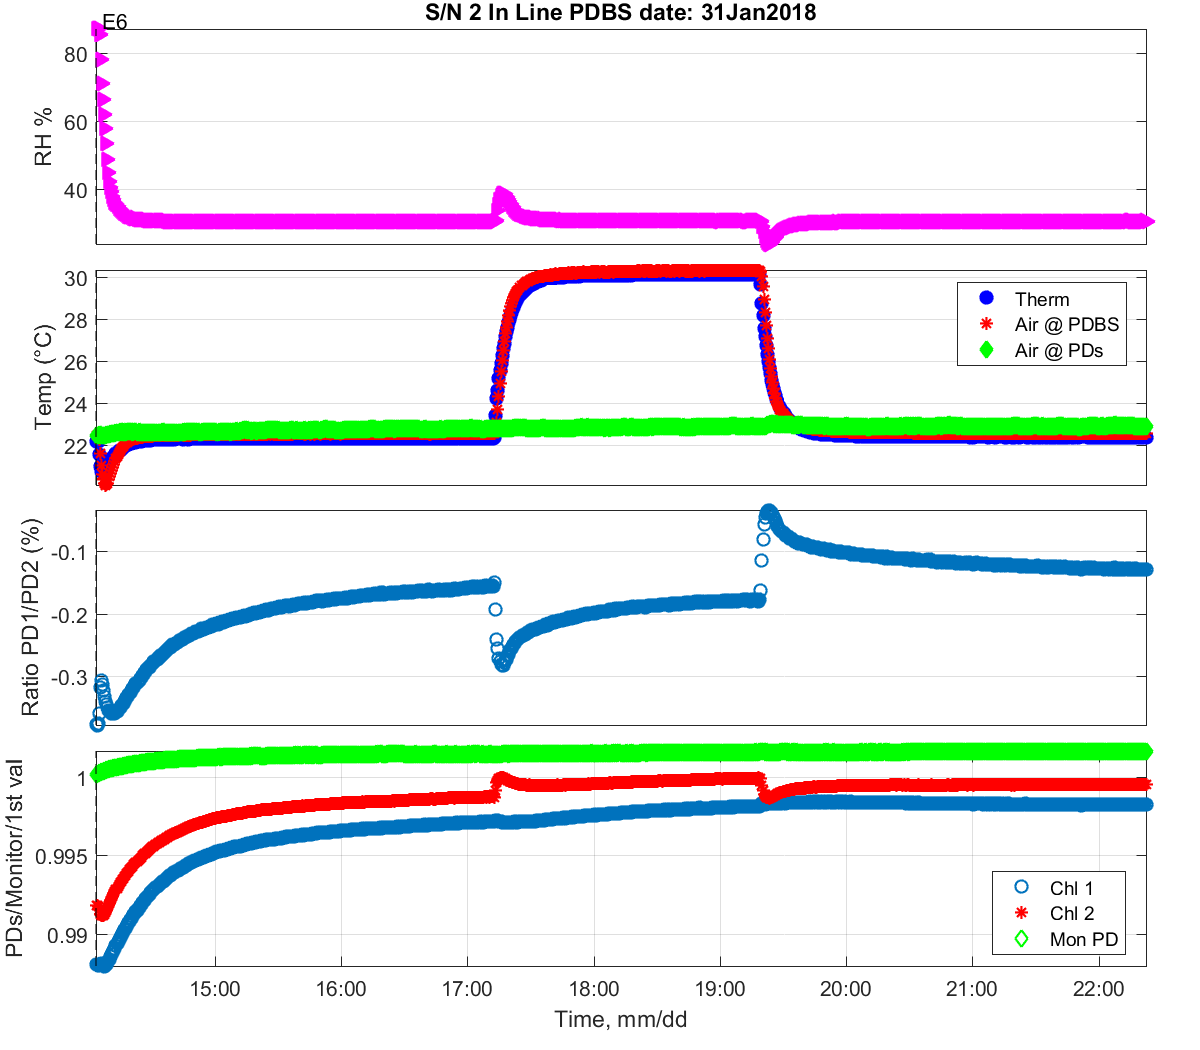
Figure 7:
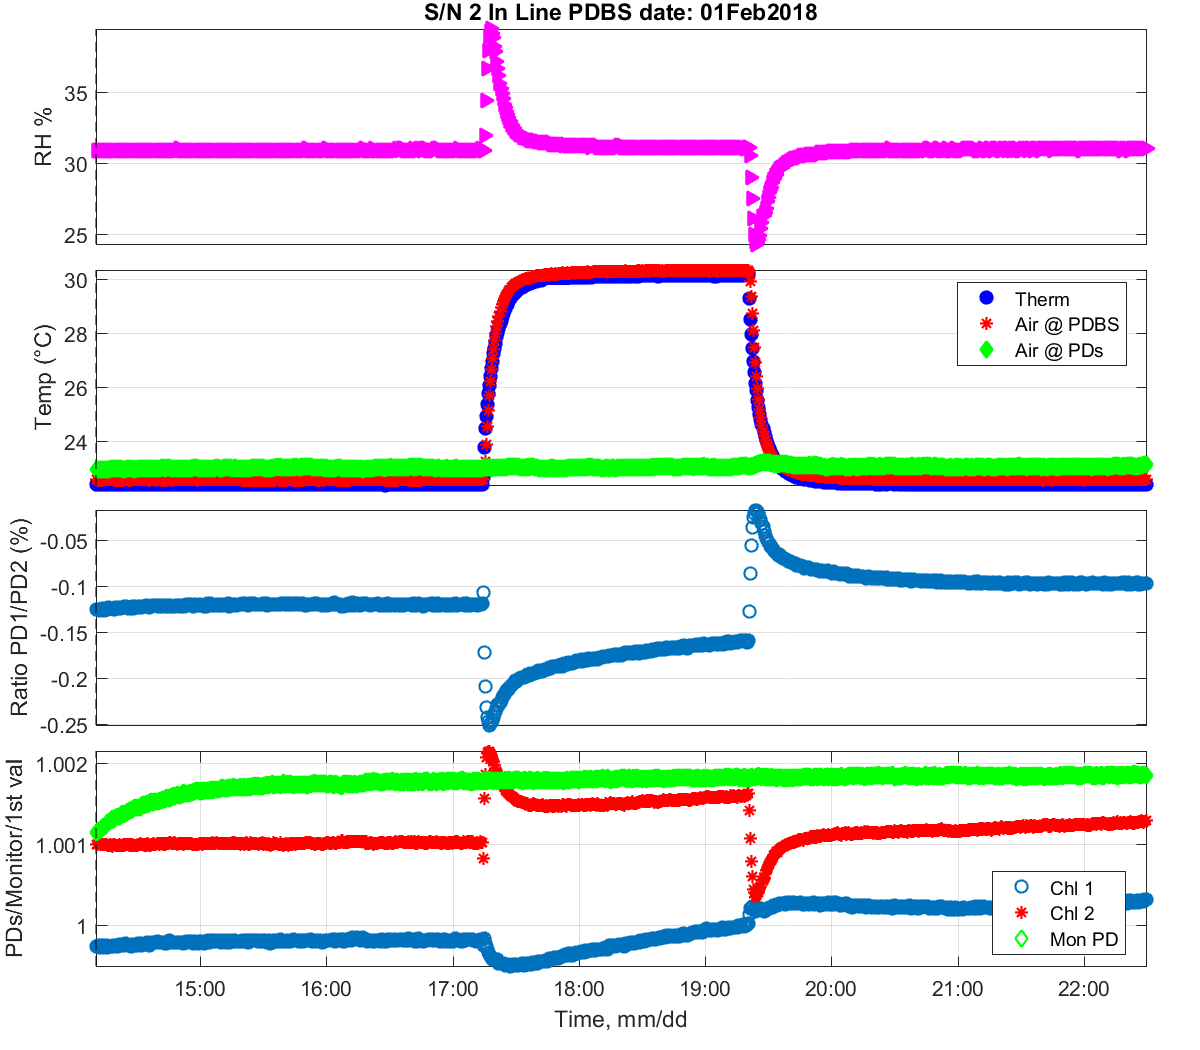
Figure 8:
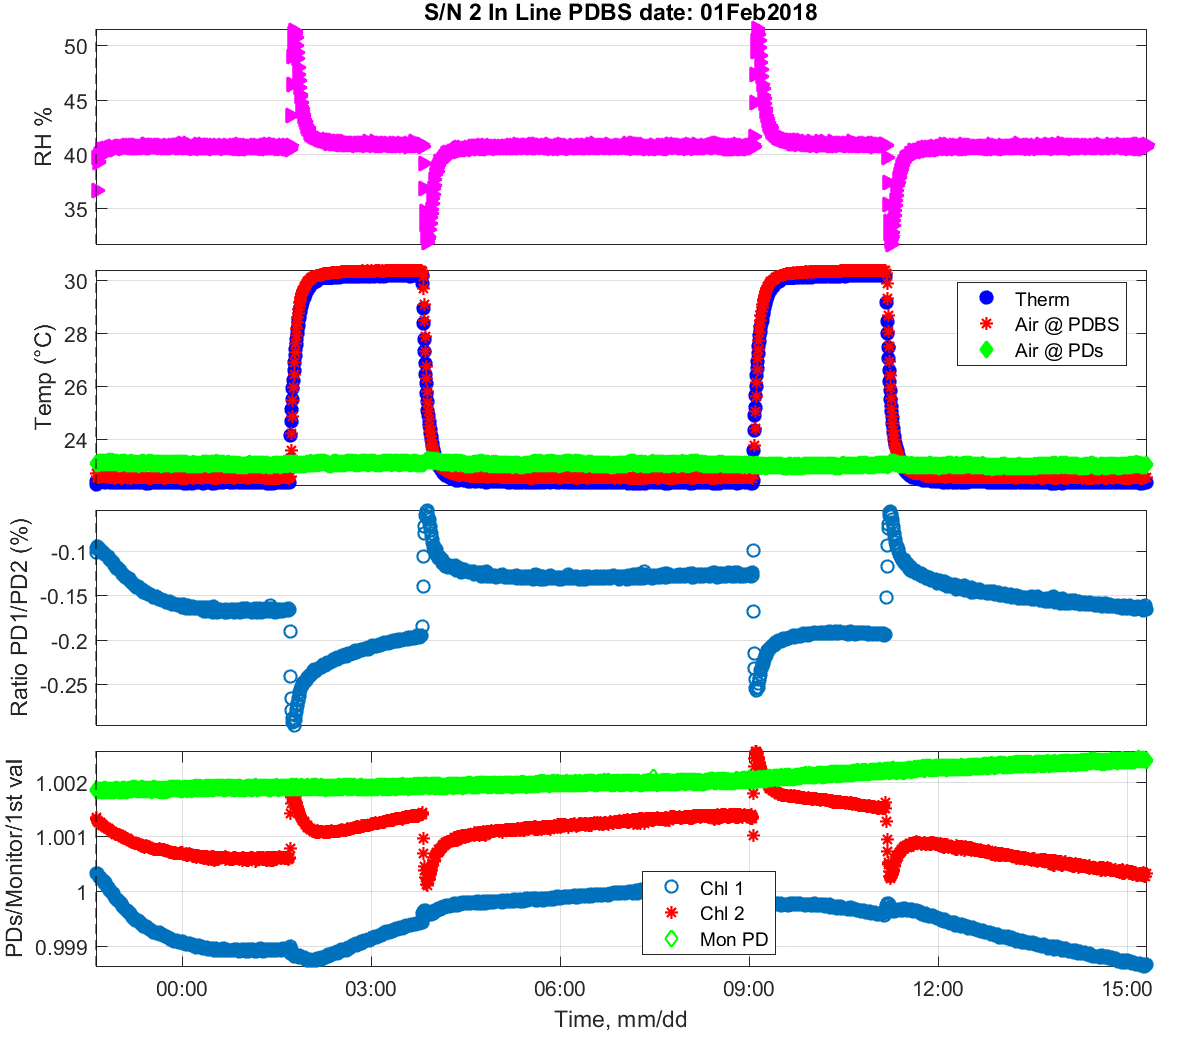
Figure 9:
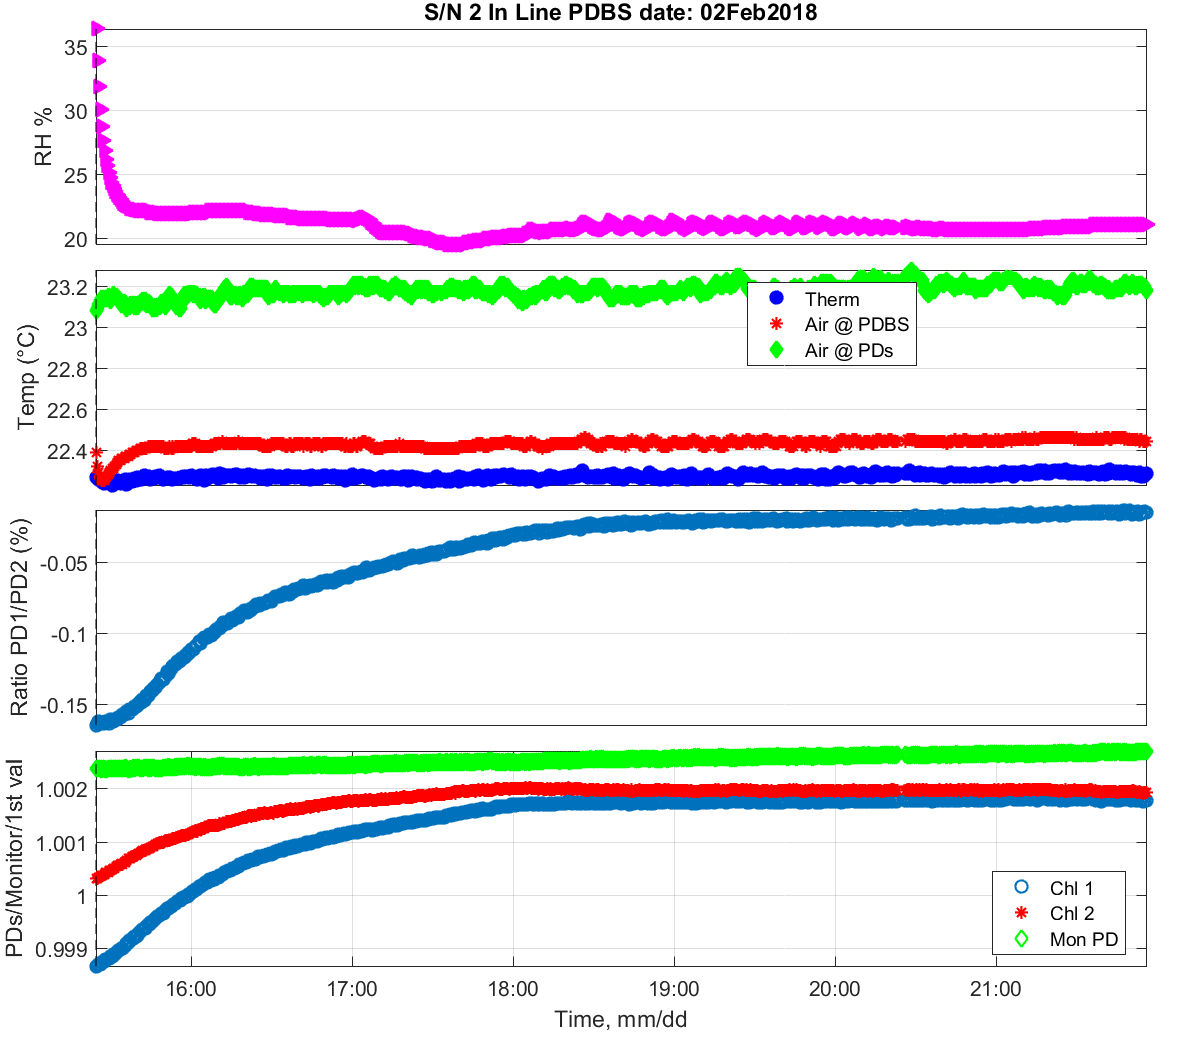
Figure 10:
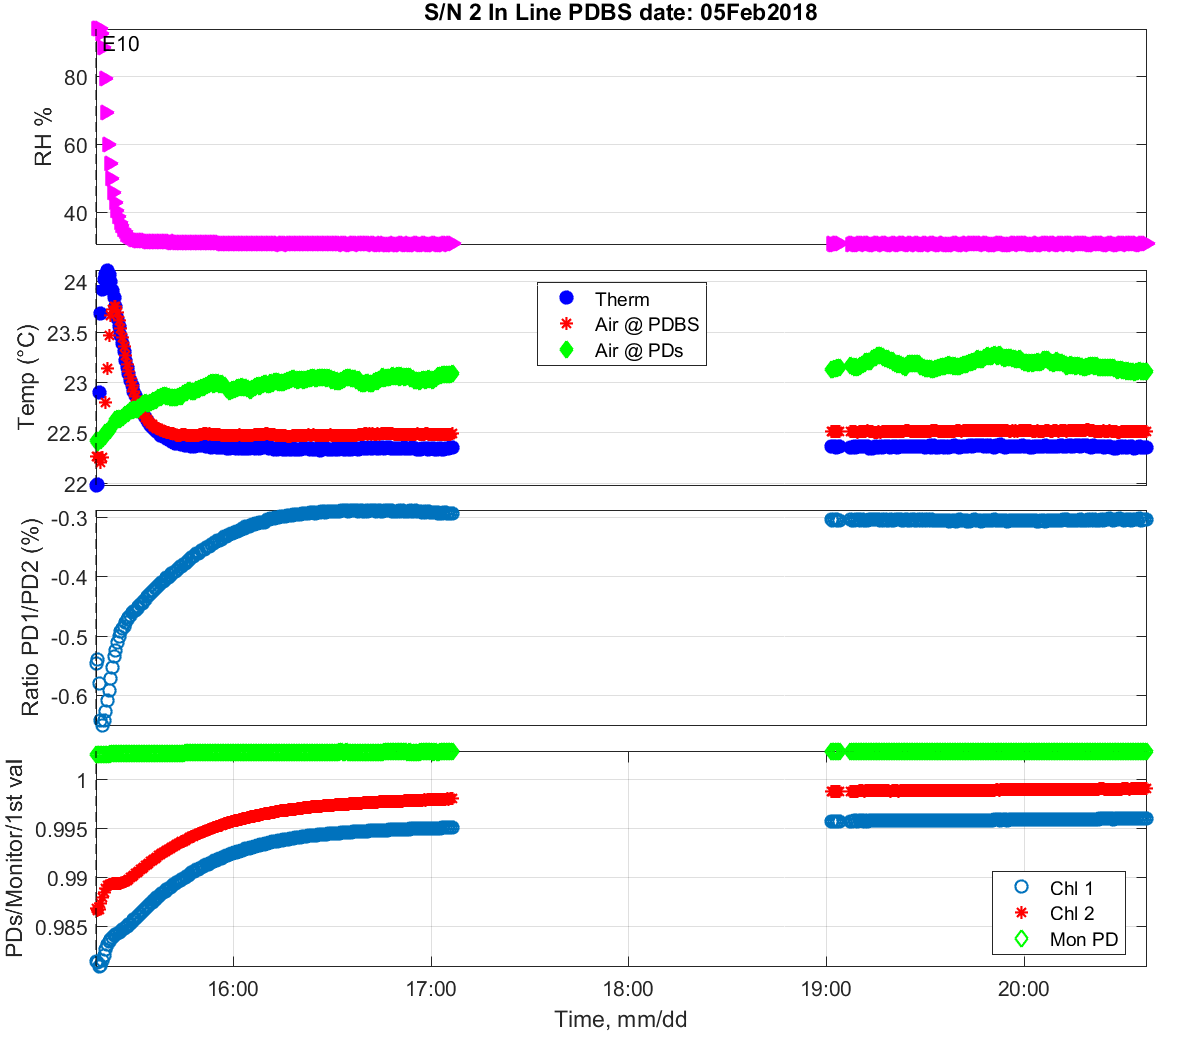
Figure 11:

Figure 12: