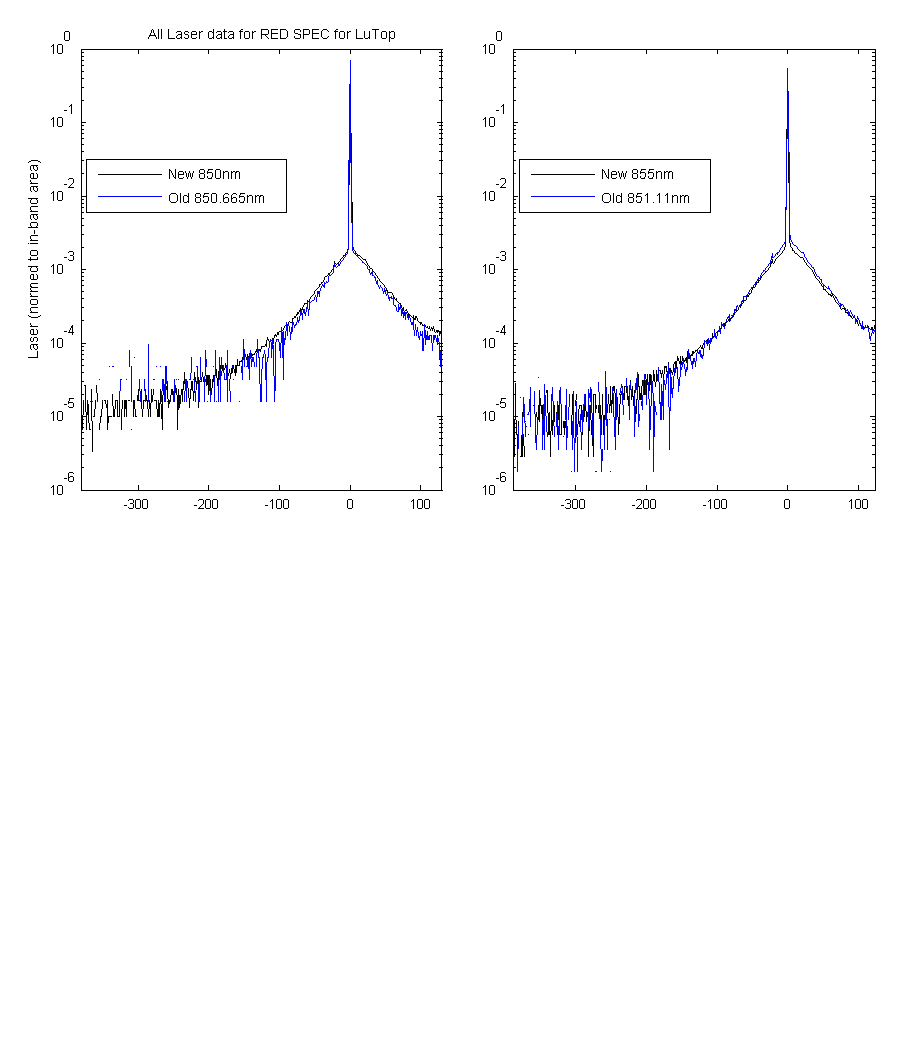
These graphs compare the old laser data collected for MOBY217/19 and the new laser data collected at NIST for MOBY242/44. Remember that we has a potential for saturation on the old laser data. The wavelength is included in the legend, data plotted should be within plus or minus 5 nm of the new data.
Figure 1
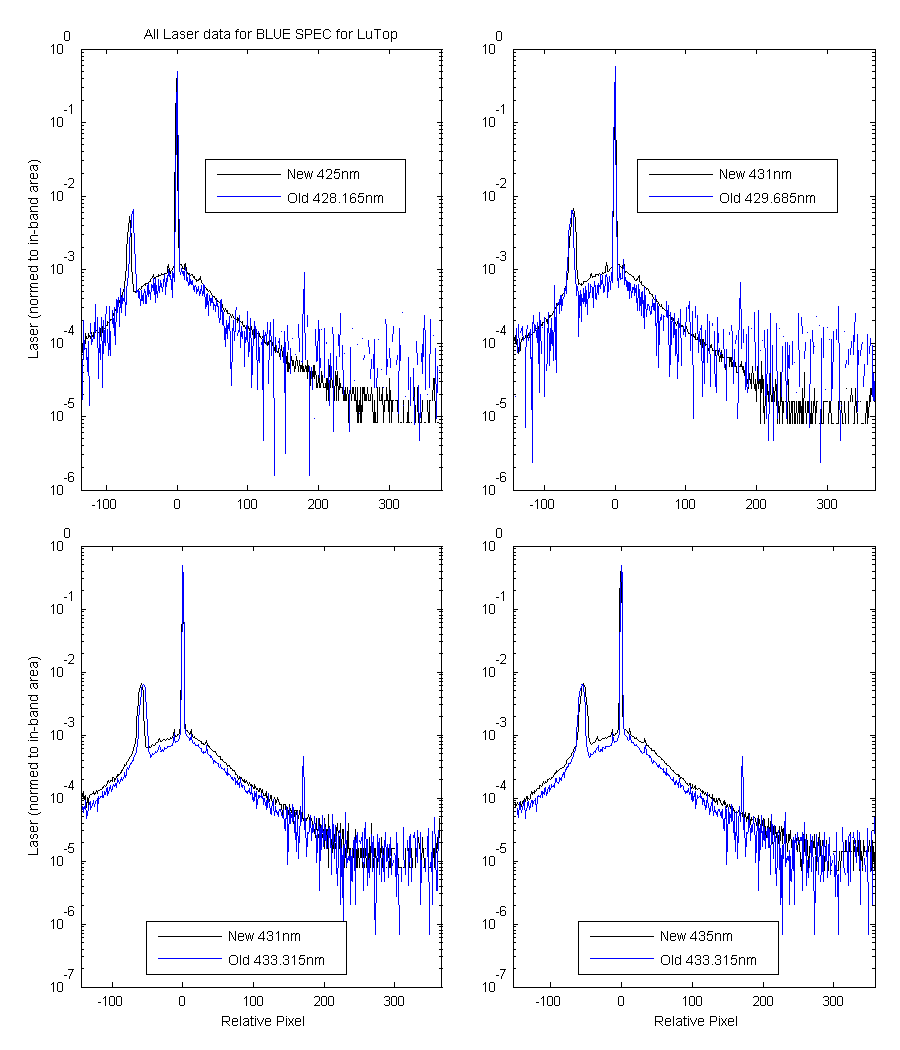
Figure 2
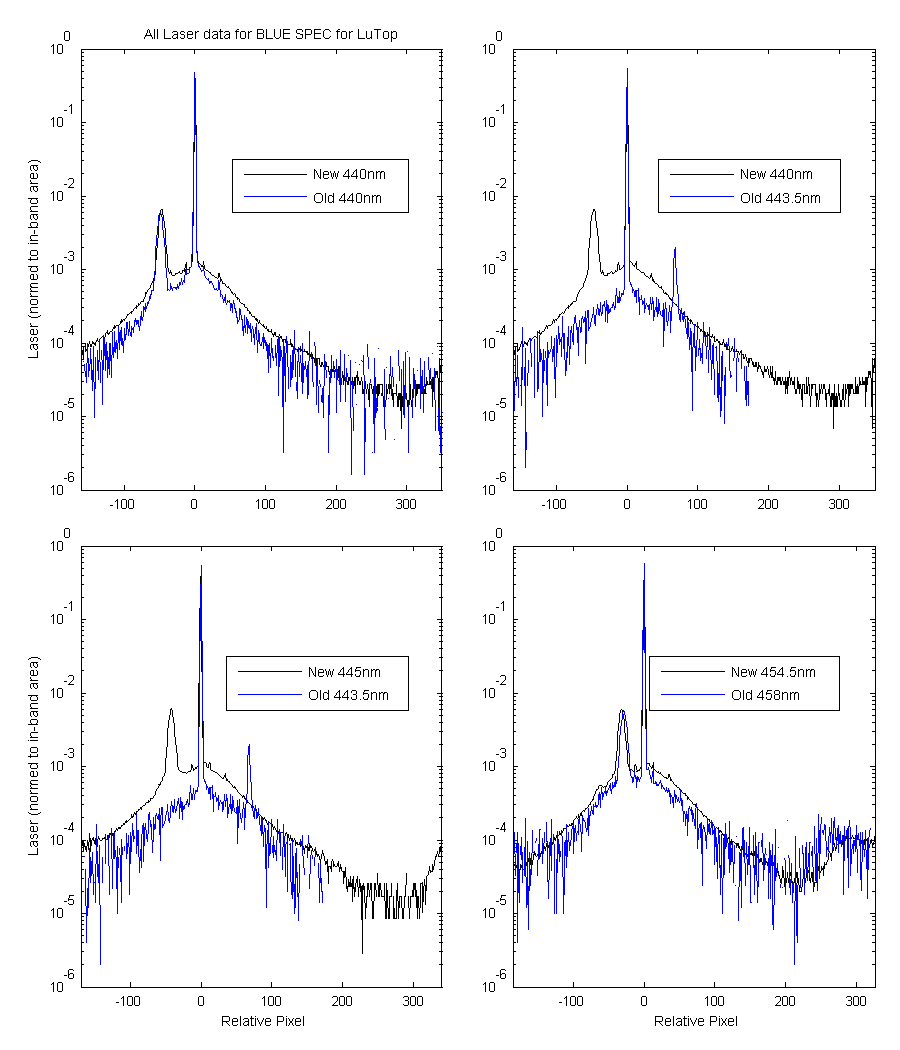
Figure 3
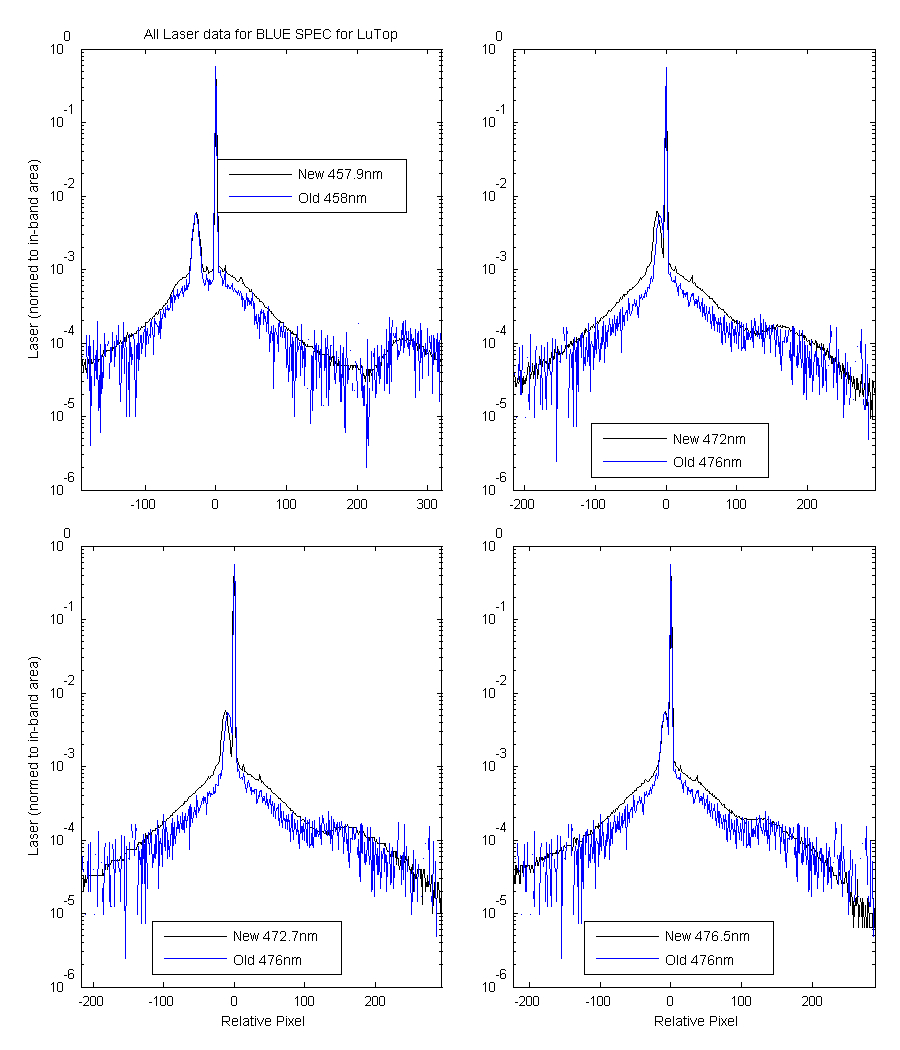
Figure 4
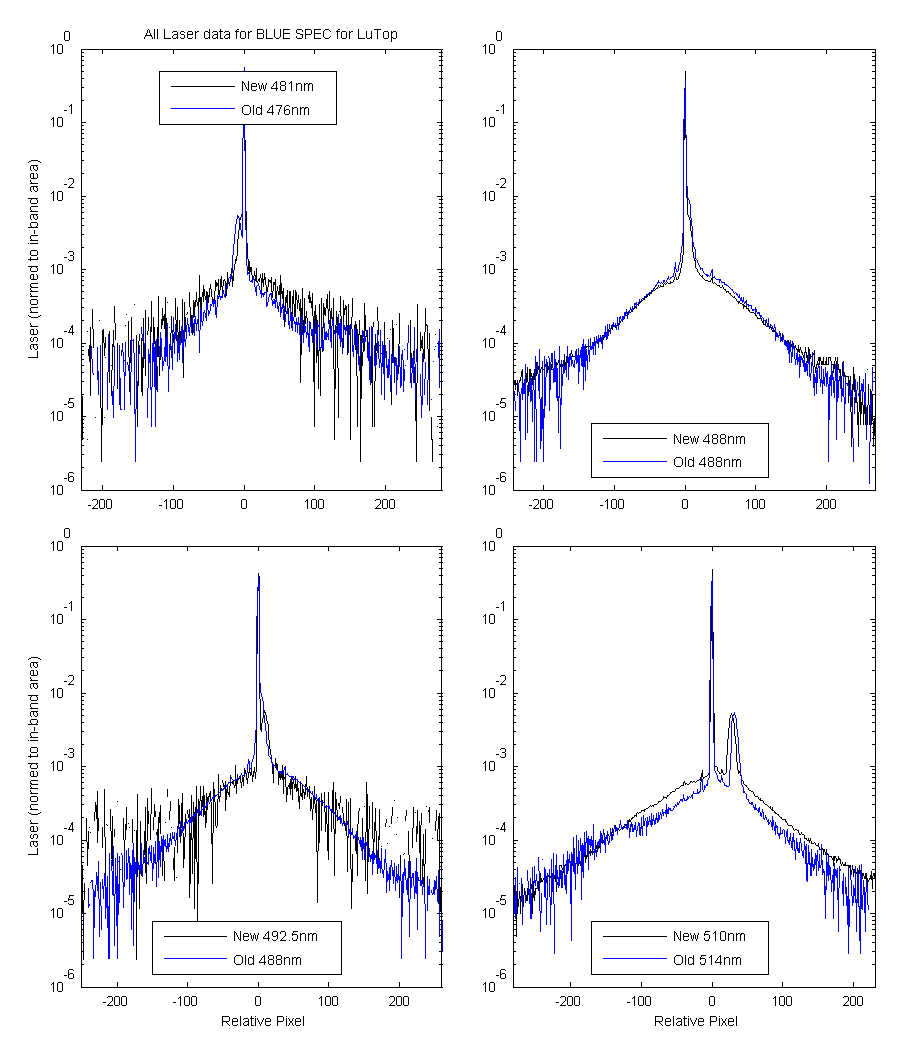
Figure 5
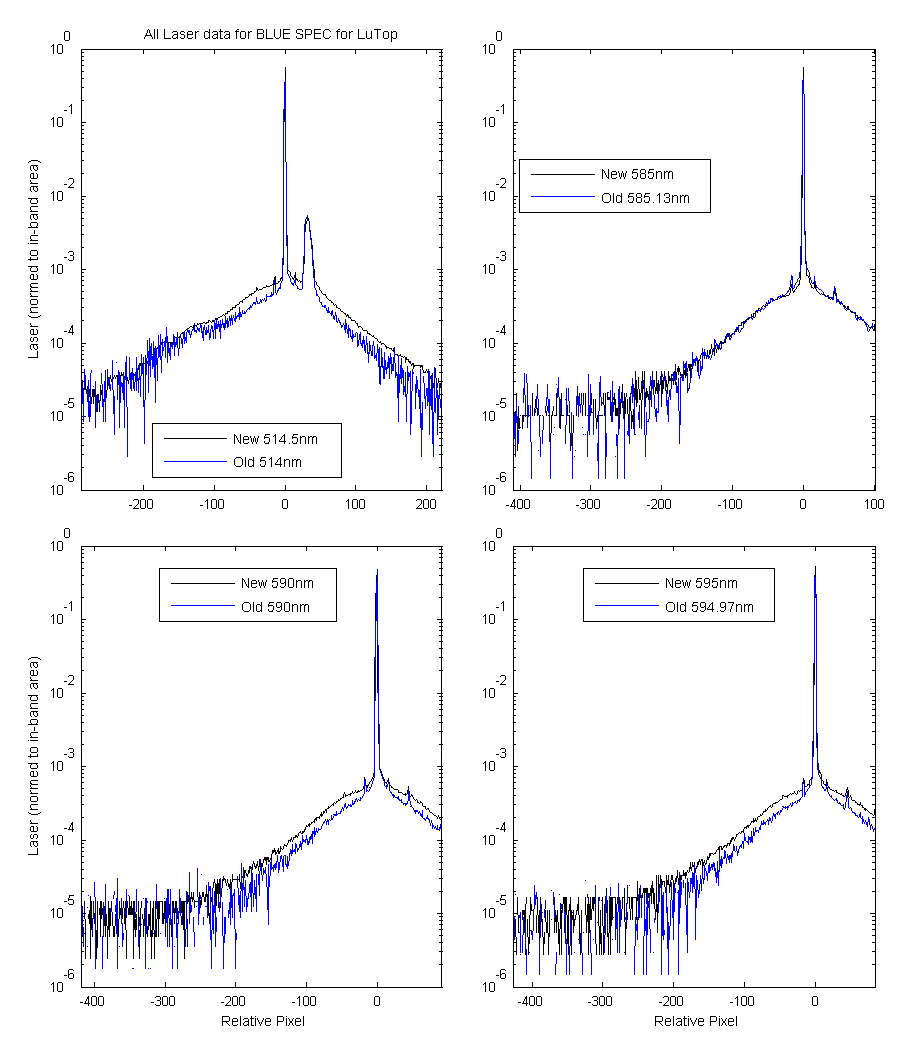
Figure 6
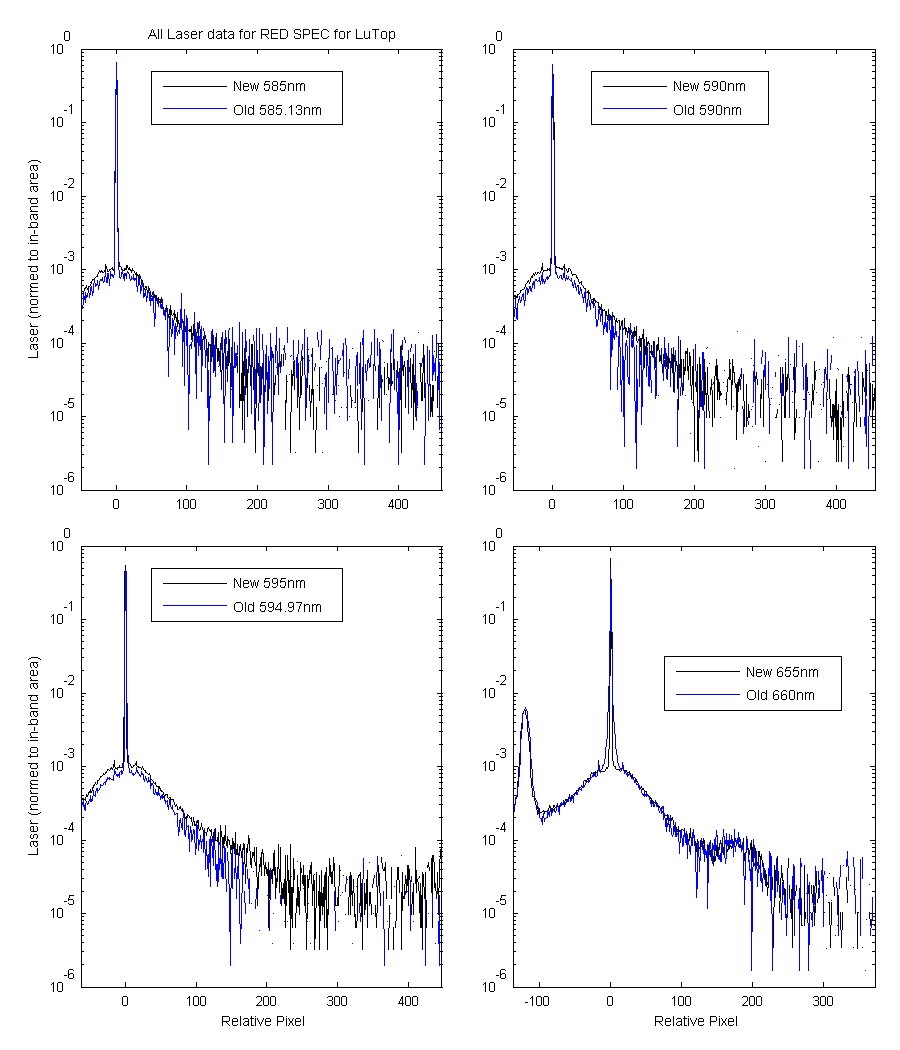
Figure 7
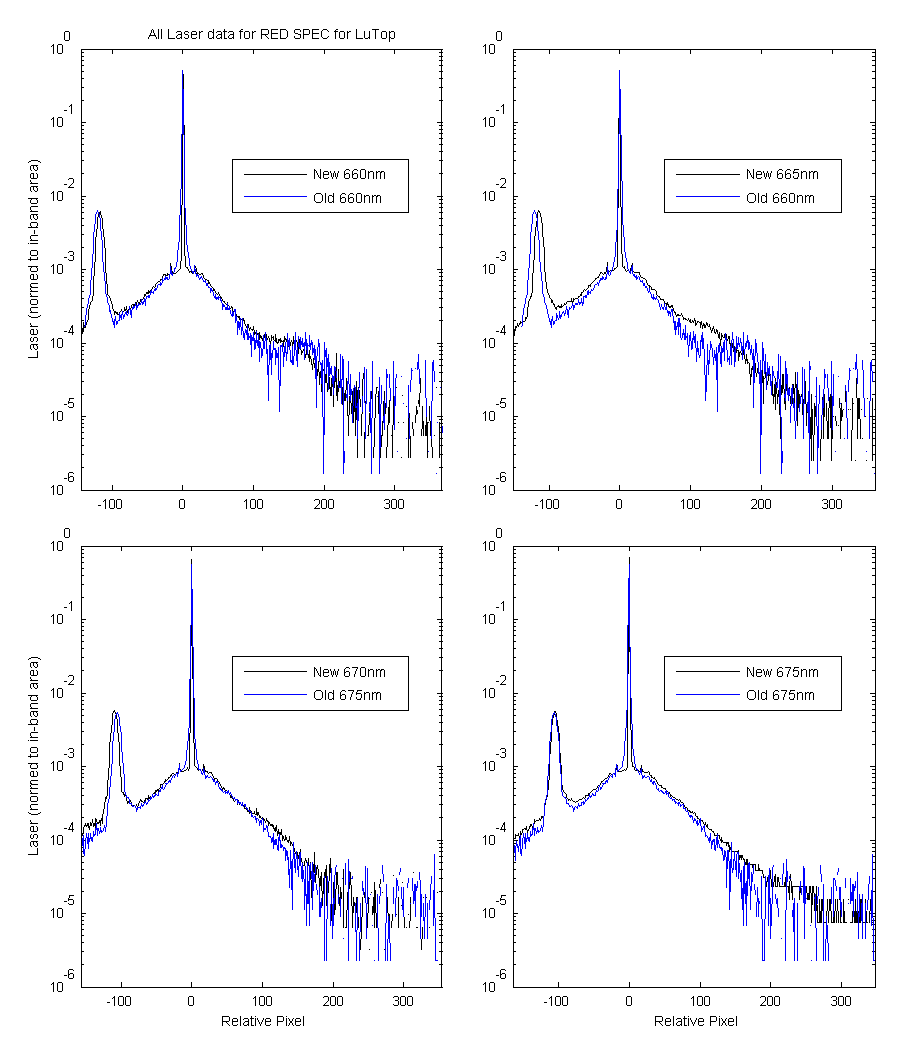
Figure 8
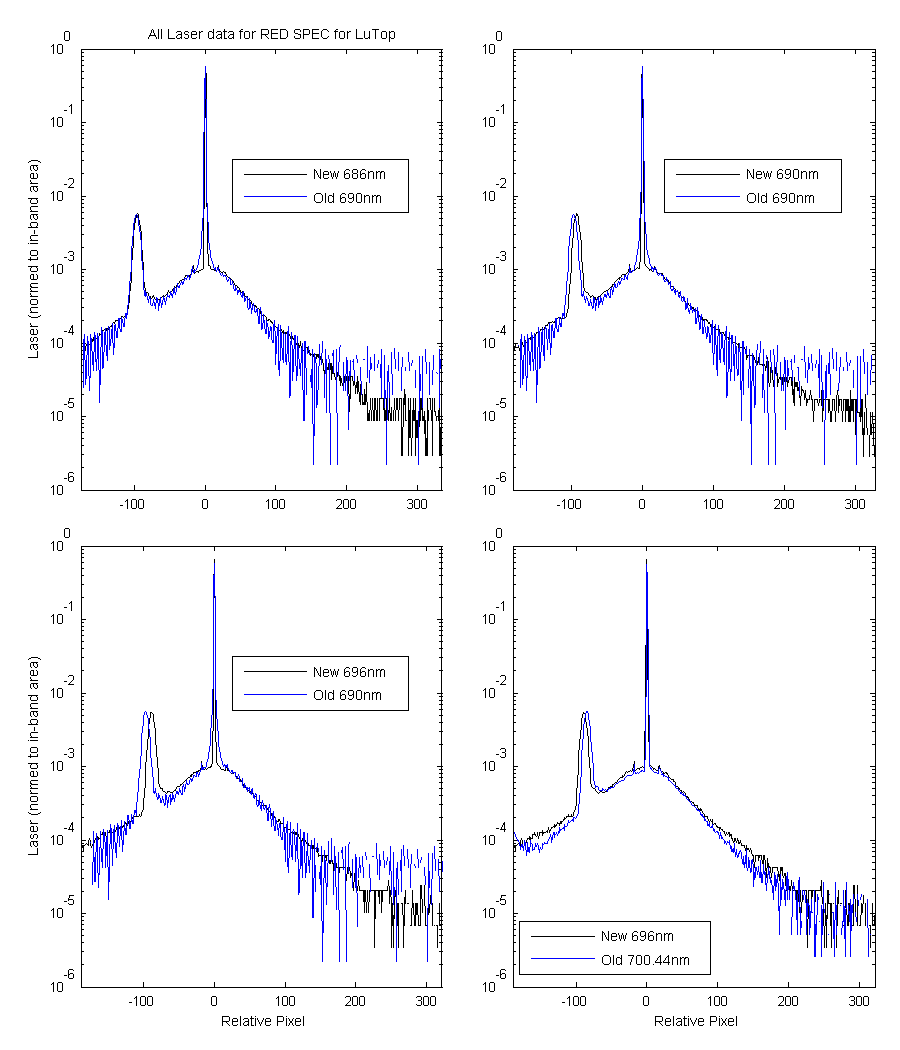
Figure 9
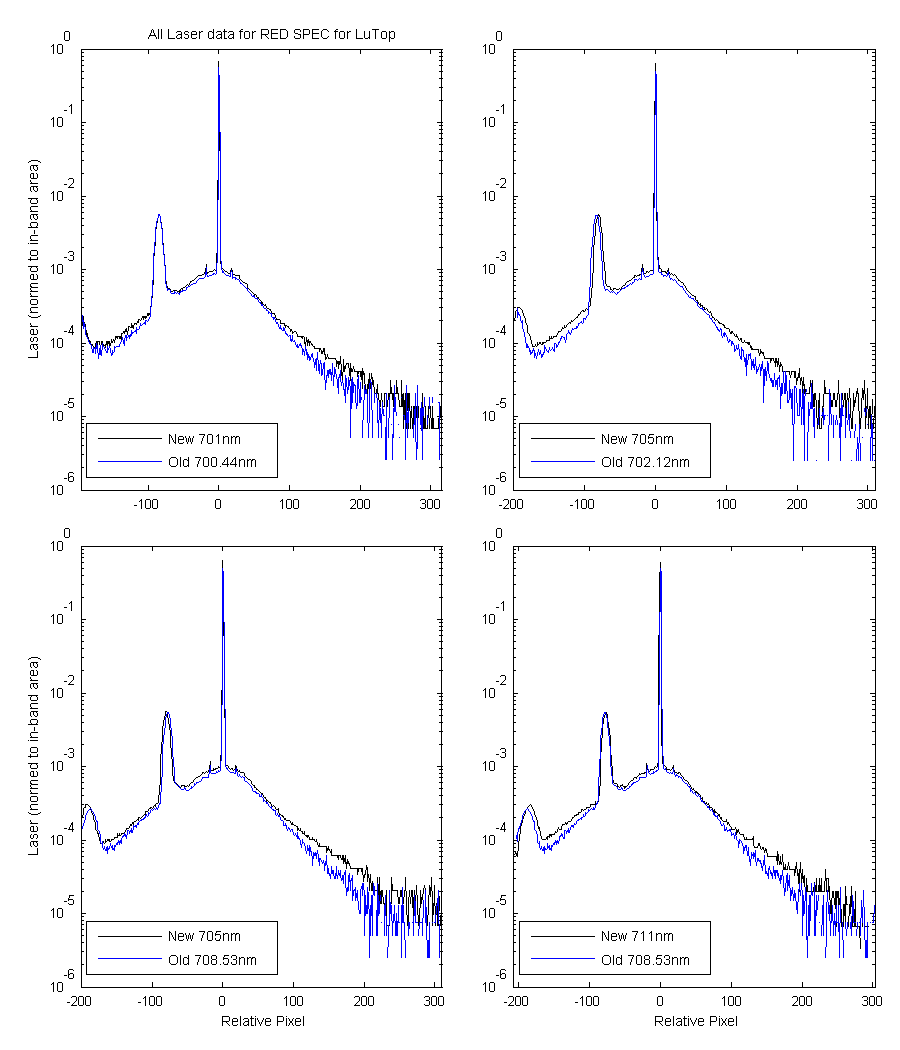
Figure 10
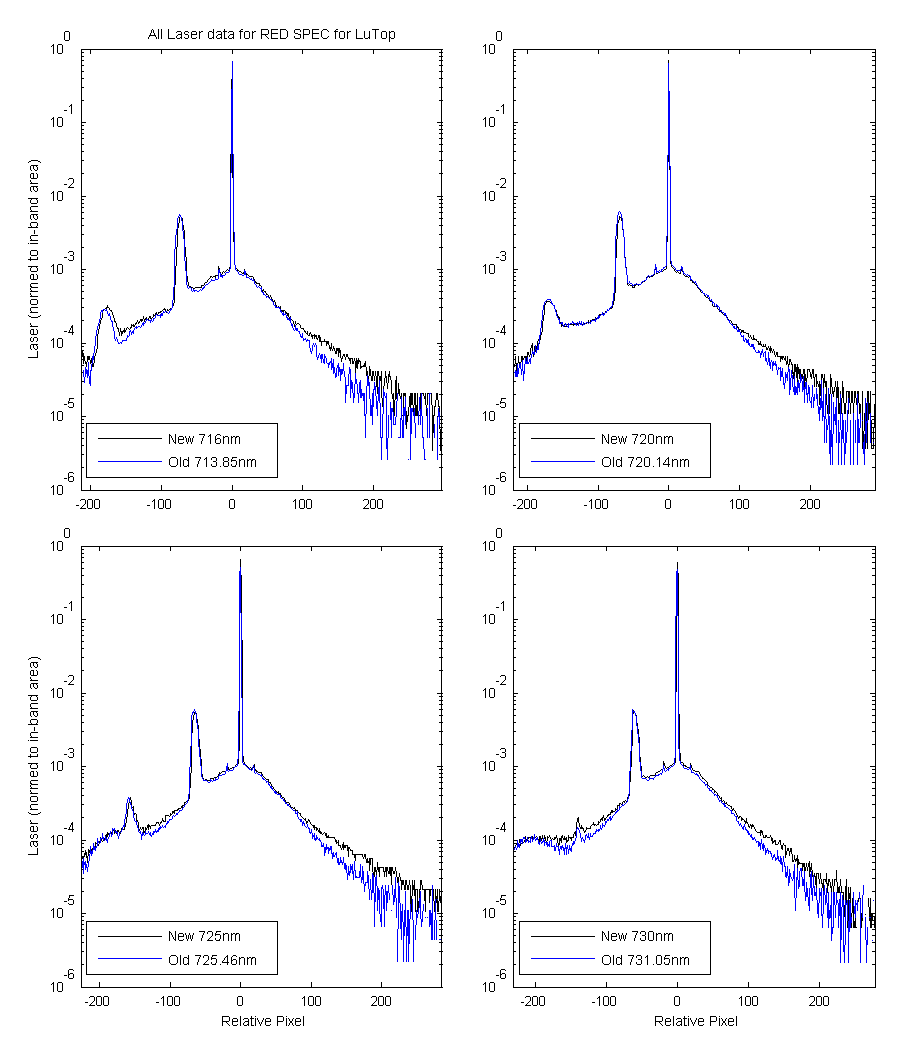
Figure 11
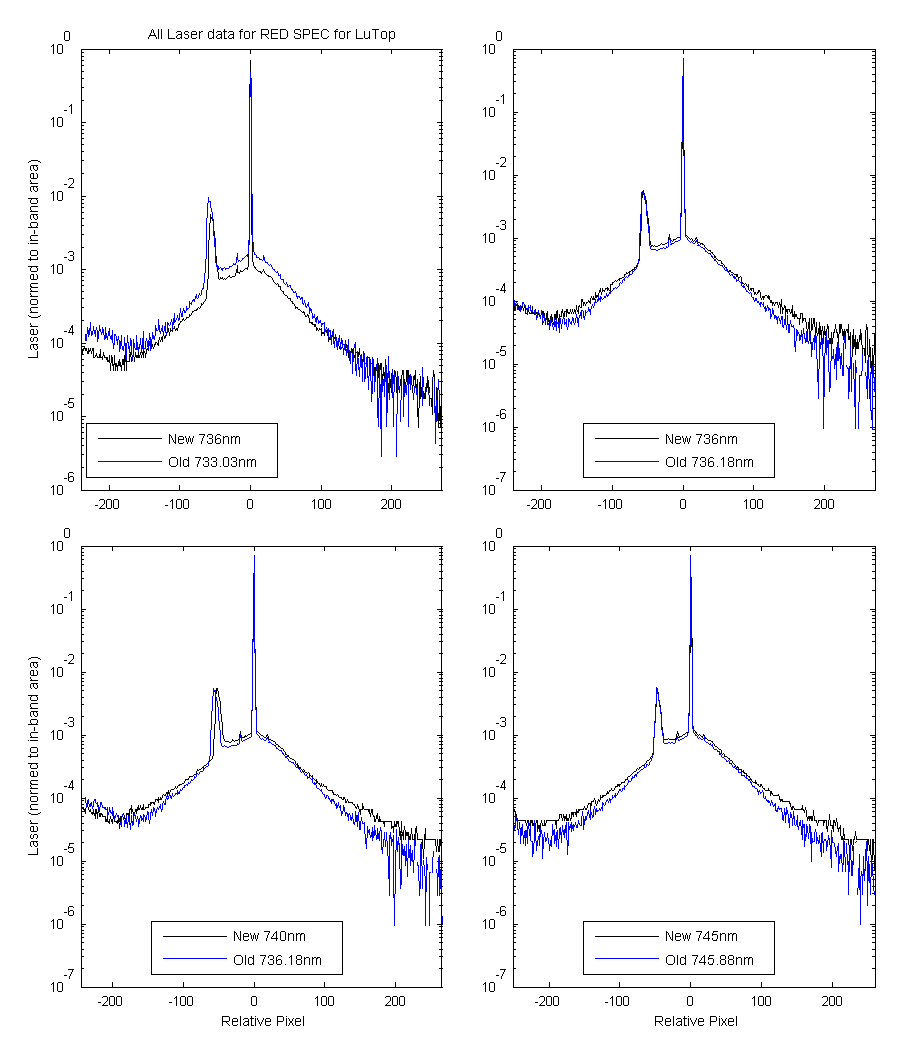
Figure 12
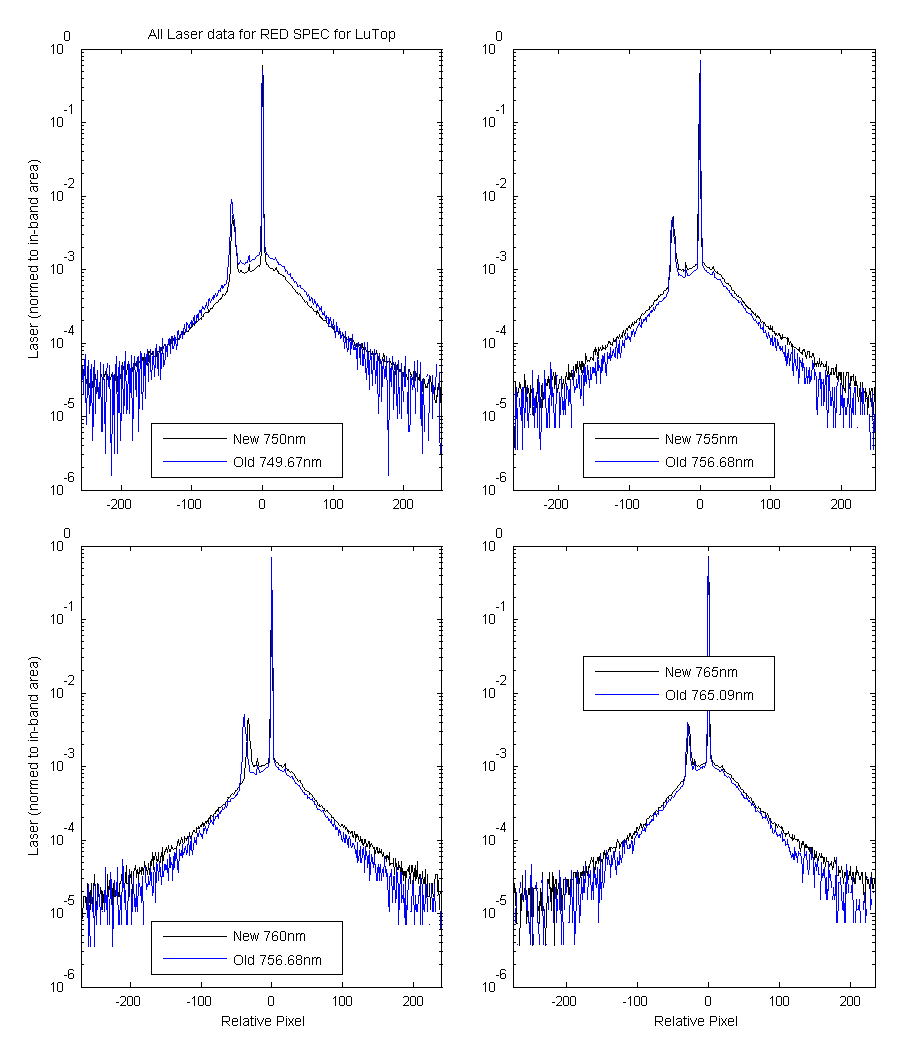
Figure 13
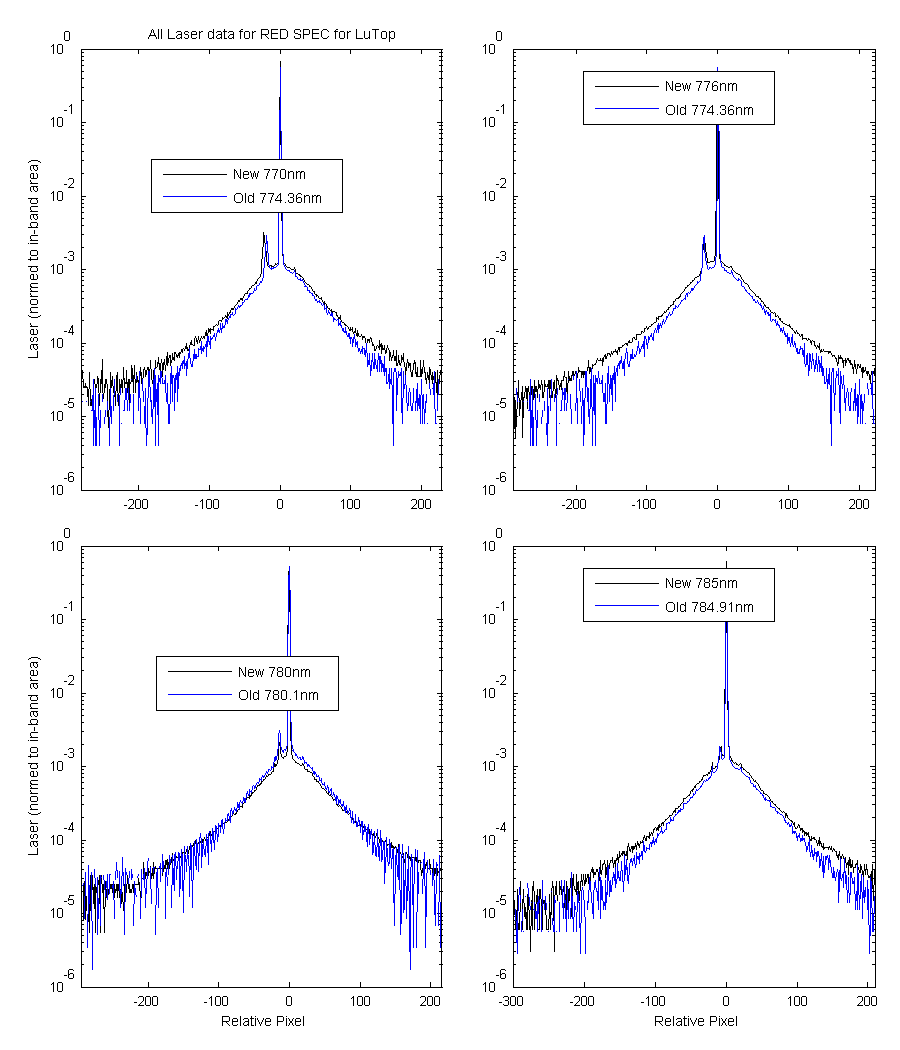
Figure 14
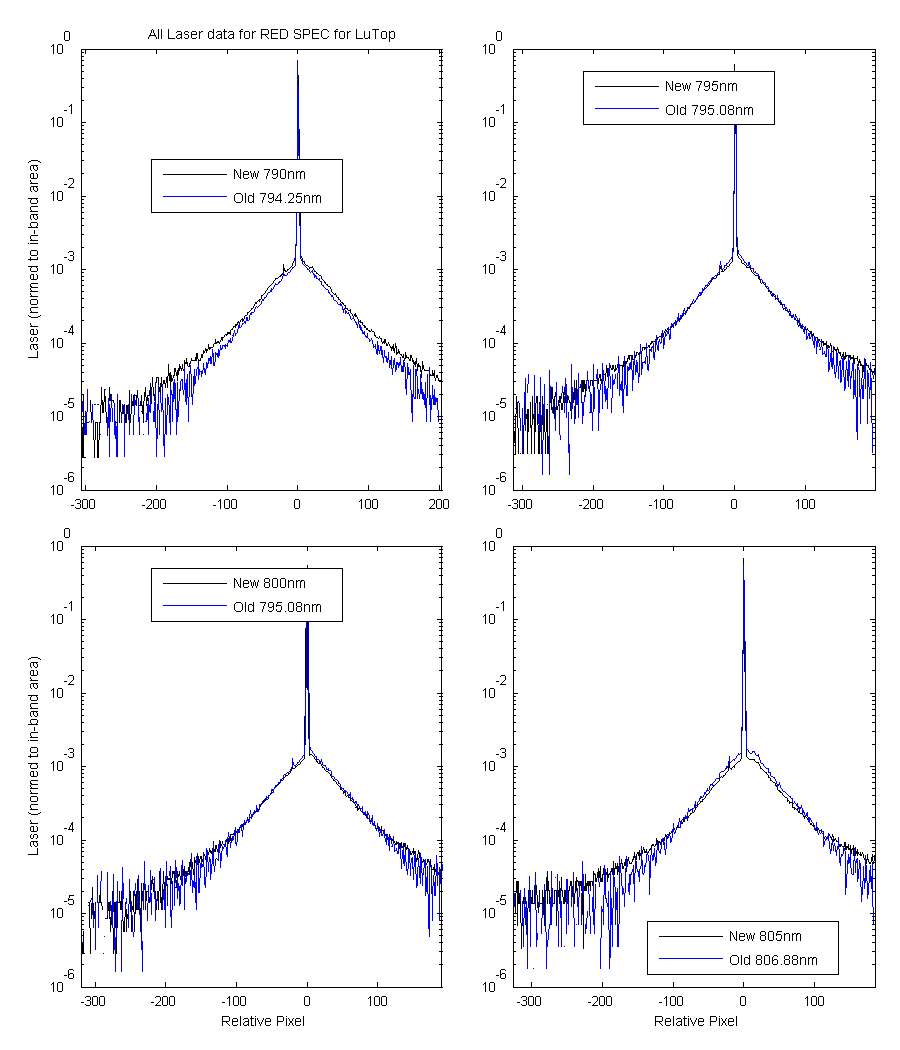
Figure 15
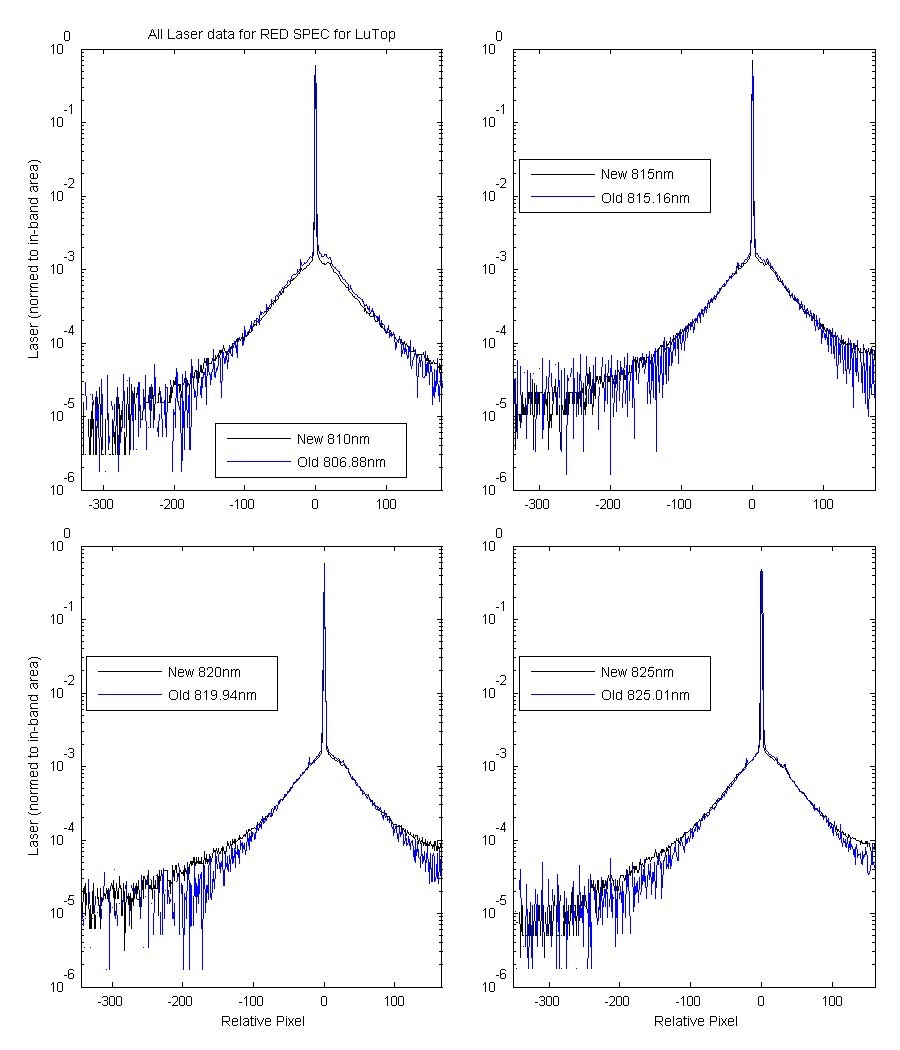
Figure 16
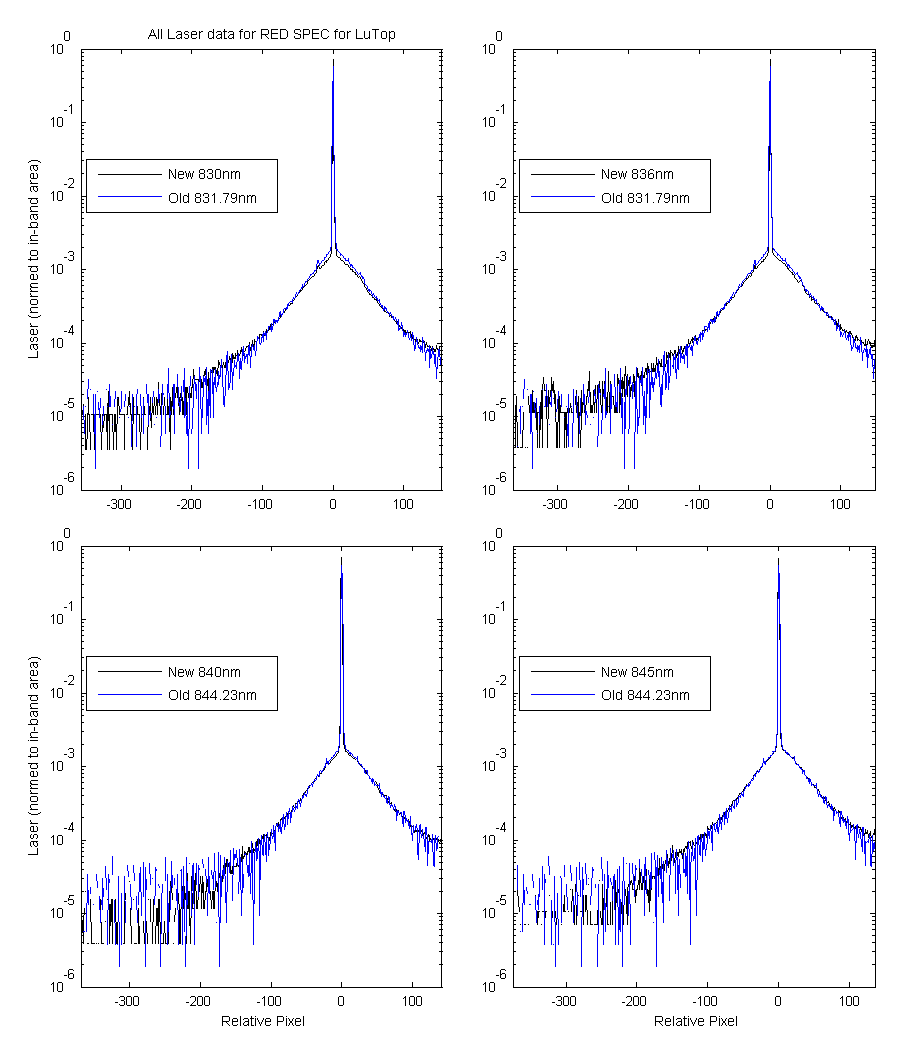
Figure 17
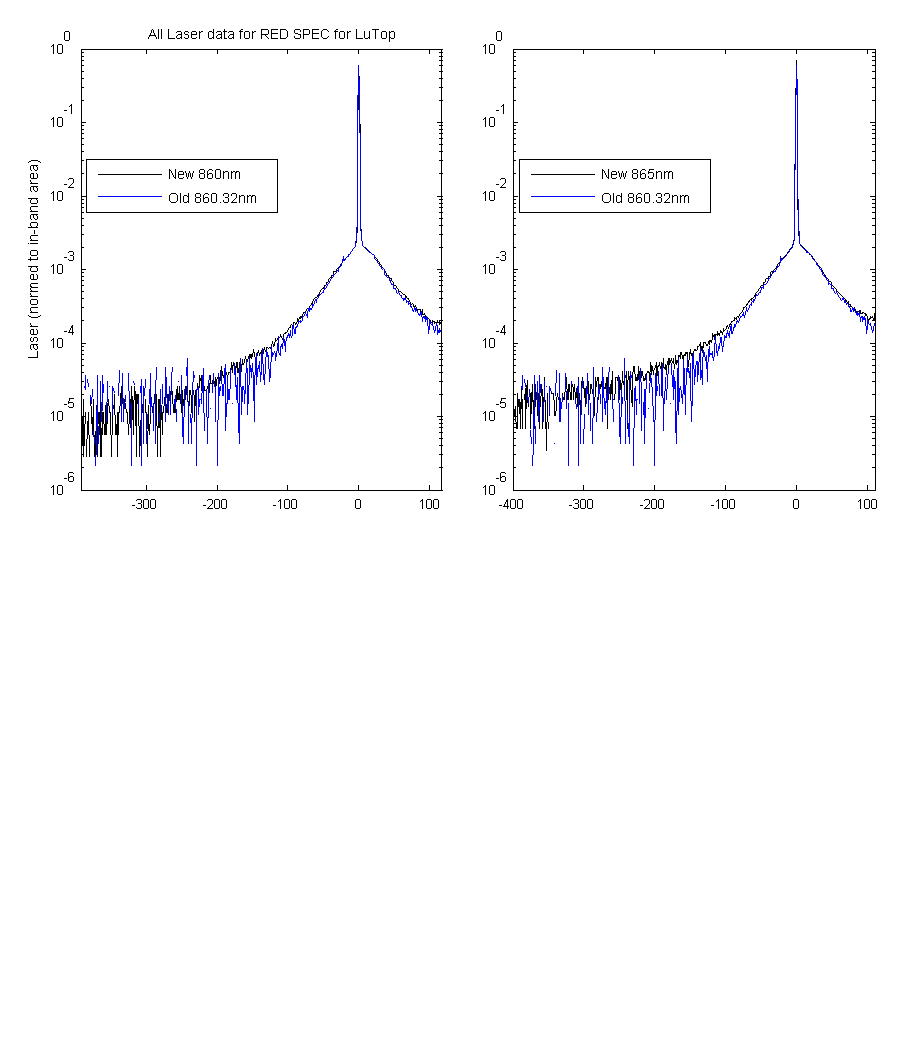
Figure 18