Previously the large bump was not interpolated separately (like the reflection peak is), so the bump sort of morphed its way across the array. After talking to Mike F we decided I should stop the what if questions on the SPR and fix the large bump first. This page is my first attempt to look at the large bump. Info gathered here was used to correctly interpolate the large bump. This process will be shown in the next web page.
This shows the large bump as it moves across the array. In the next 2 figures show the incorrectly interpolated laser data and a zoomed in image of the large bump so you can see what the incorrect interp looks like in the image.
Figure 1
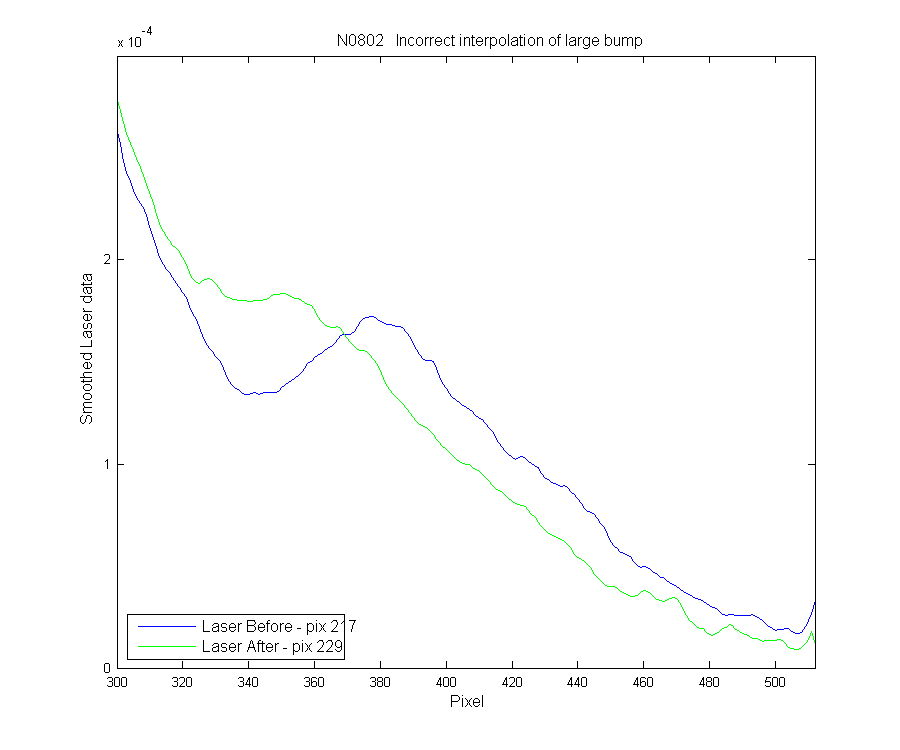
This shows the way the large bump is being interpolated currently. The green line in the interpolated new large bump. Rather than a wider flatter bump it should be taller and narrower and slowly moving from the blue to the red bump. The lower flatter bump exist because I don't pull the before and after bumps out line them up and interpolate then, then stick them back in (which is the way I do the reflection peak).
Figure 2
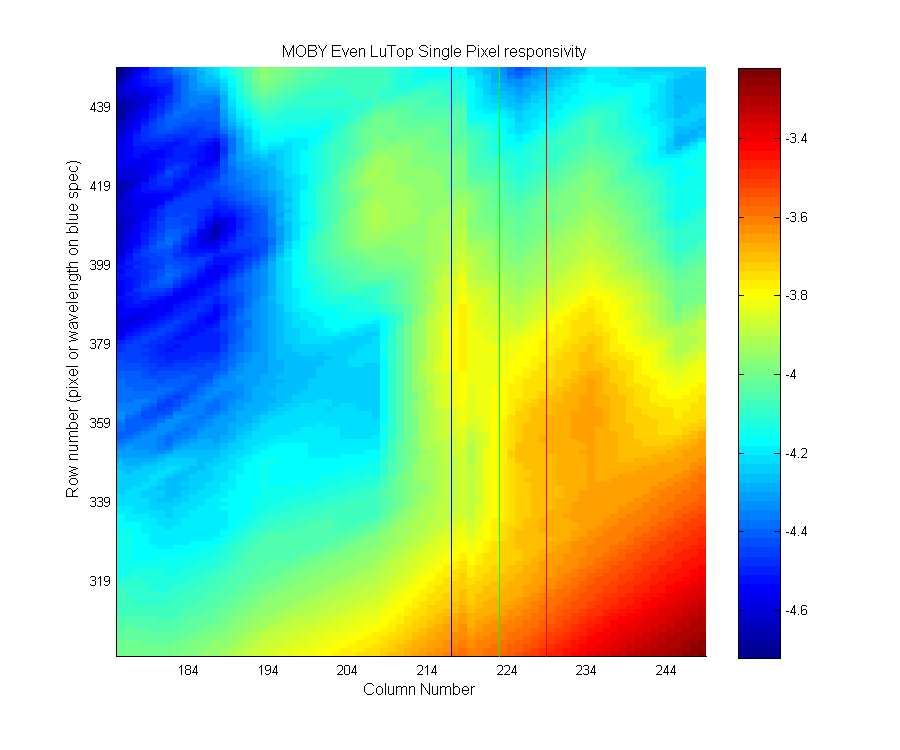
This is a zoomed in view of the SPR in an area were you can see the problem with the current interpolation of the large bump. The red, green and blue lines are the data plotted in figure 2. In this image the larege bump looks like an ocean wave undulating up and down as it moves across the array. It should look like a continuous ridge.
Figure 3
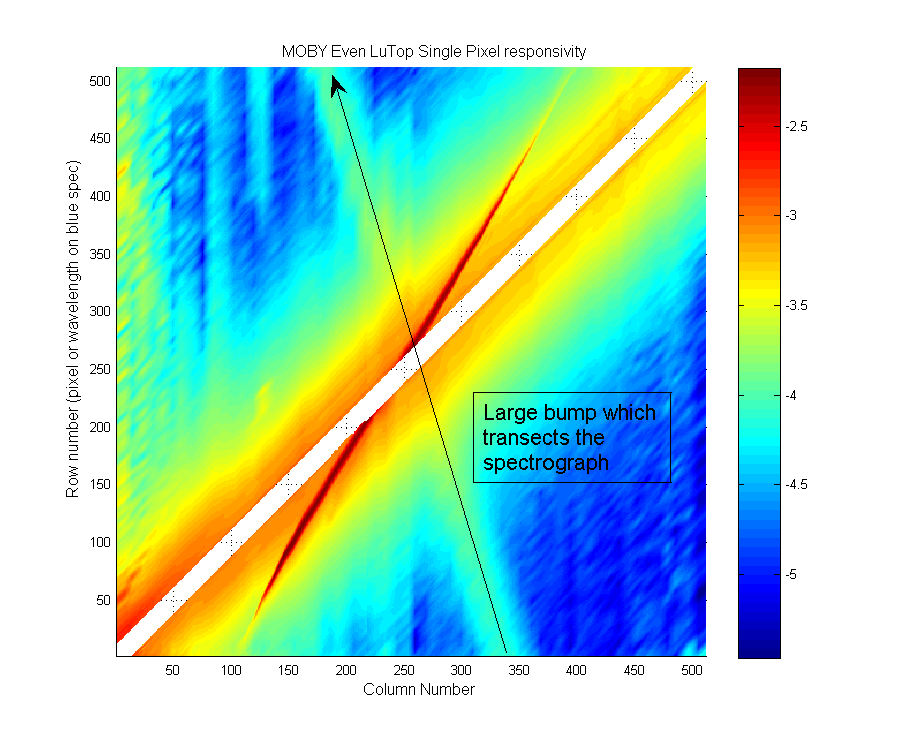
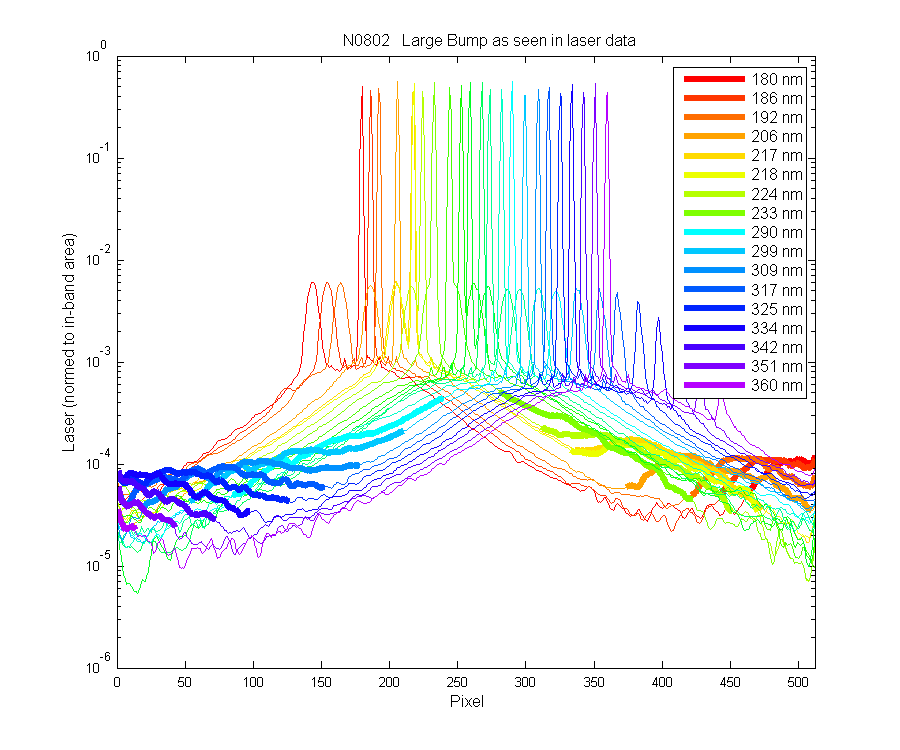
Large bump seen in the laser data.
Figure 4
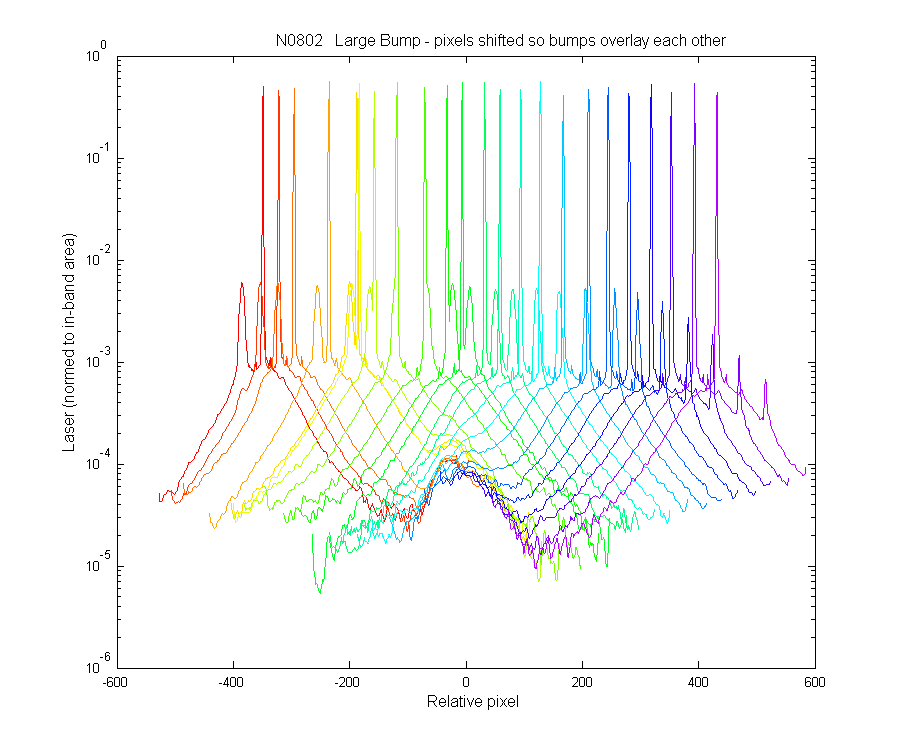
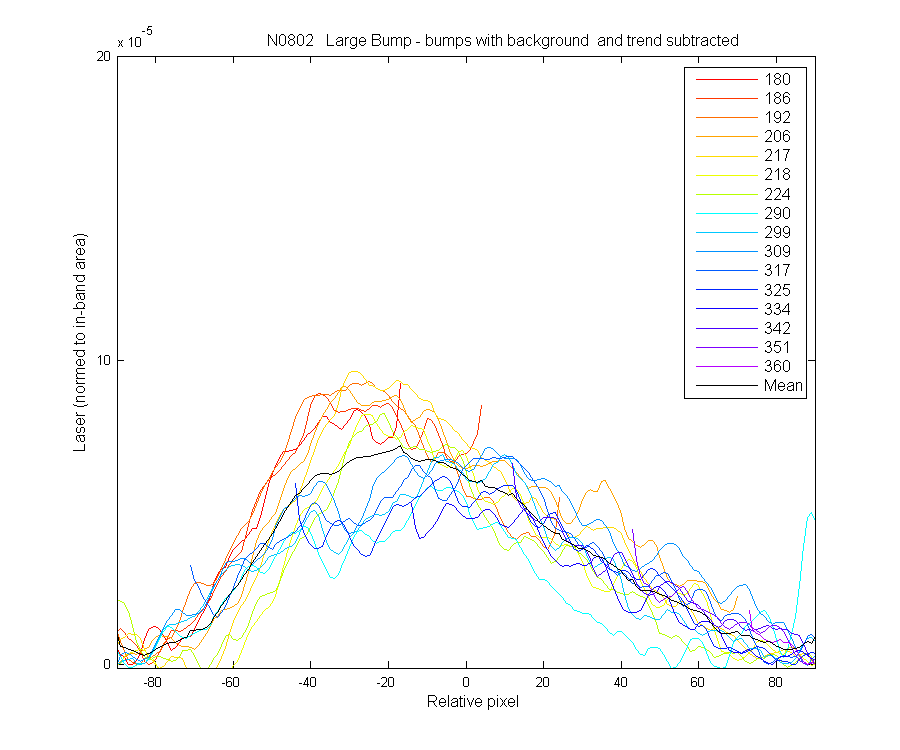
Large bumps overlayed. The back ground straylight makes it a little hard to see the bump
Figure 5
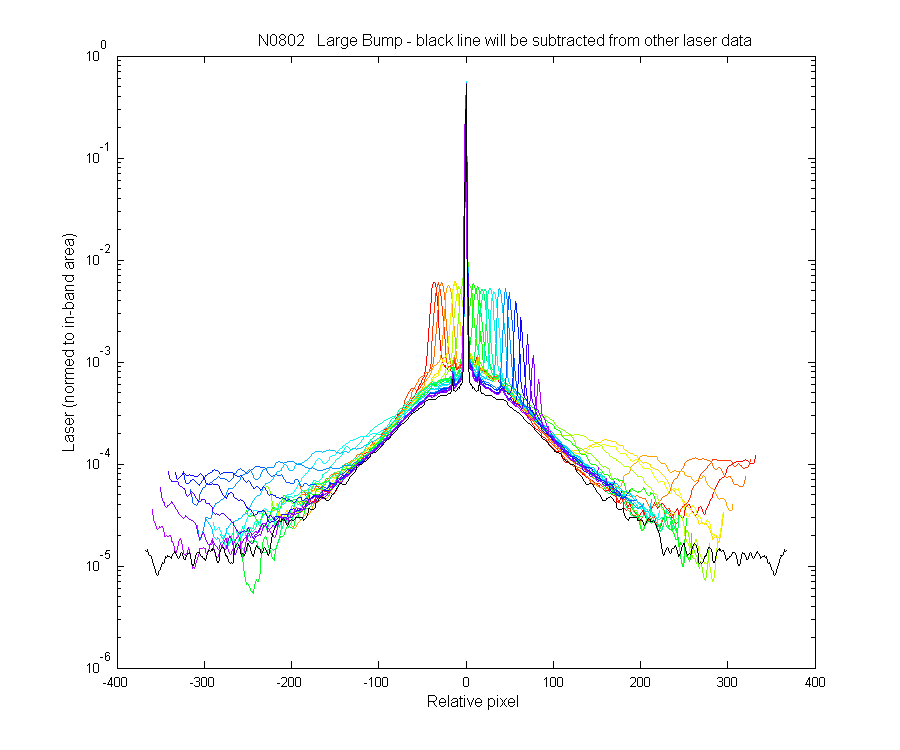
I used the R6G Dye at 570 nm and mirrored the left side onto the right side to get a background without a large bump in it. The black line is the "clean" background which is subtracted from each laser in the next graph.
Figure 6
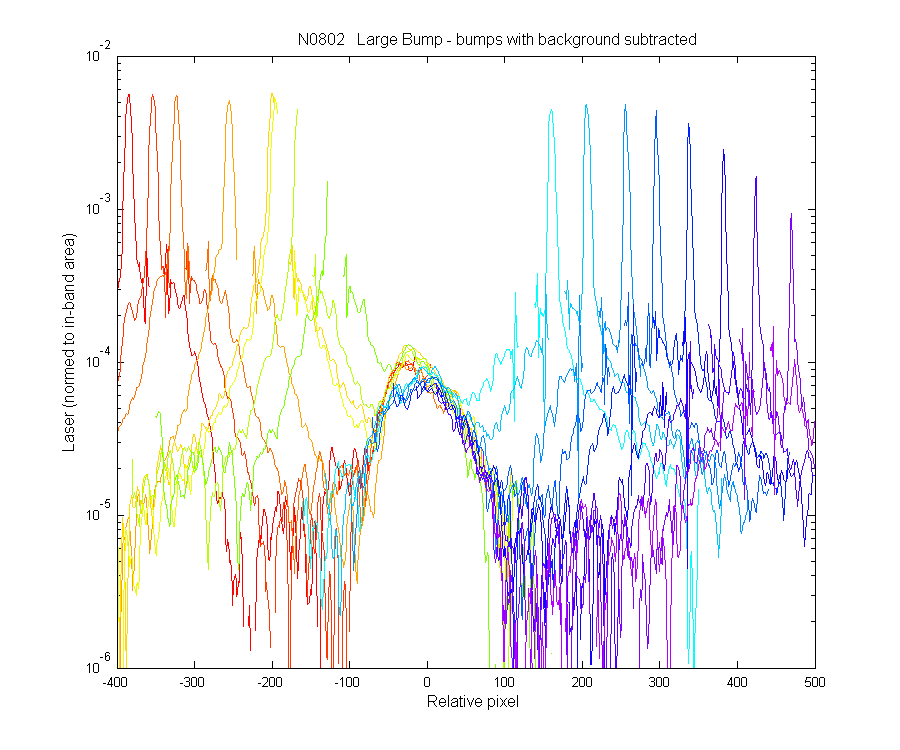
This is what the large bump looks like with the background subtracted. For 550 nm laser purpleist line the bump is a little wider and shorter. At the other end of the array 440 nm laser data the bump is a little taller and narrower.
Figure 7
12 Apr 2010: In the process of working on the large bump I discovered that I had made a mistake for two of the laser obs. The 480 and 482.5 nm laser data had been frankenstiened together to create a complete laser obs. In the process of going this the large bump missing in this new laser data set. To add the laser data in I had to extra the bumps from the data so I could put it back in. See Page Num 3.10 for a complete explination.
Figure 8
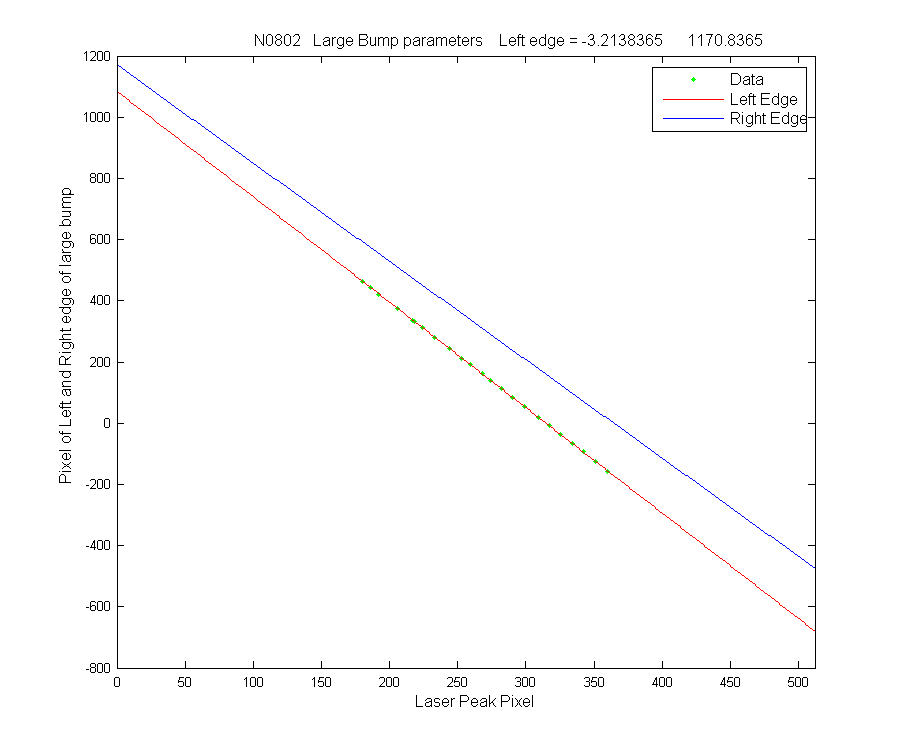
The fitted line for the left and right edge of the large bump. This is used in the SPR creation function to pull the bump out for separate interpolation.
Figure 9
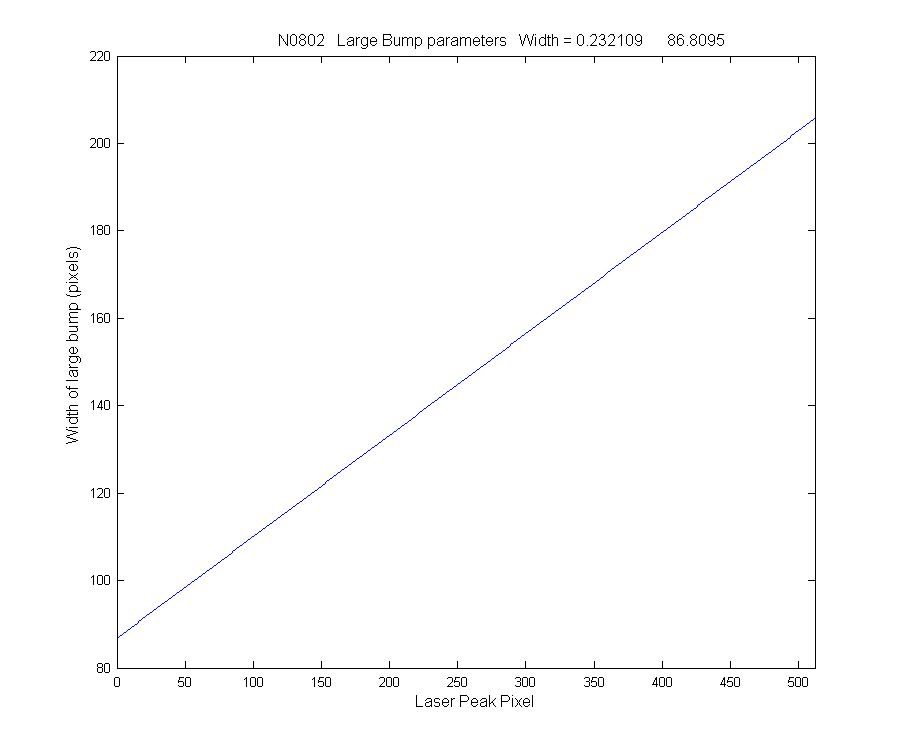
The fitted line for the width of the large bump. This is used in the SPR creation function to pull the bump out for separate interpolation.
The next web page will show how I interpolated the large bump.
Figure 10