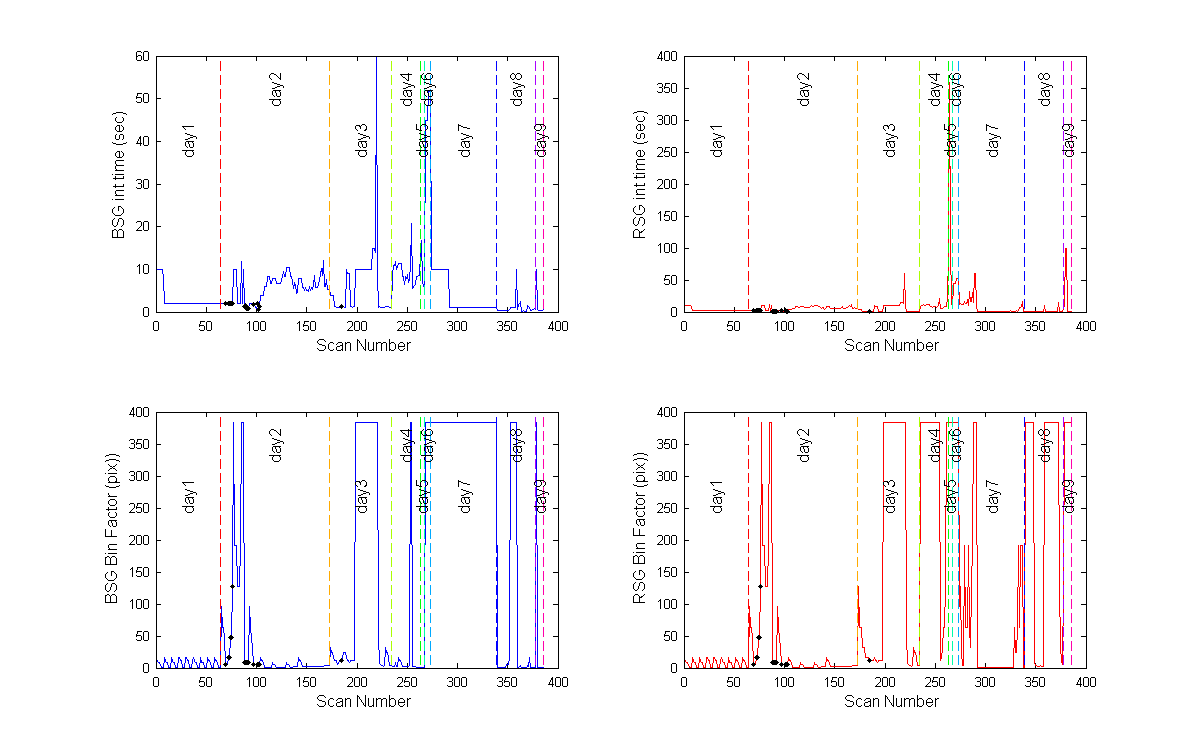
These are the graphs of the data auxilliary data collected by the MOS can. These are the averaged values for the processed data (ie an average of the dark and lite scans used to calculate the net signal. The first 5 graphs are all the data, the second set of 5 graphs are the same data with the two bad data points removed. The black dots show were the problem scans were. These are scans with noise and large jumps in the light scans or dark scans. At the bottom are plots of the blue and red integration time and bin factor.
This for the blue and red spec laser data. And all Lu Es, Ed and LuMOS data.
Figure 1
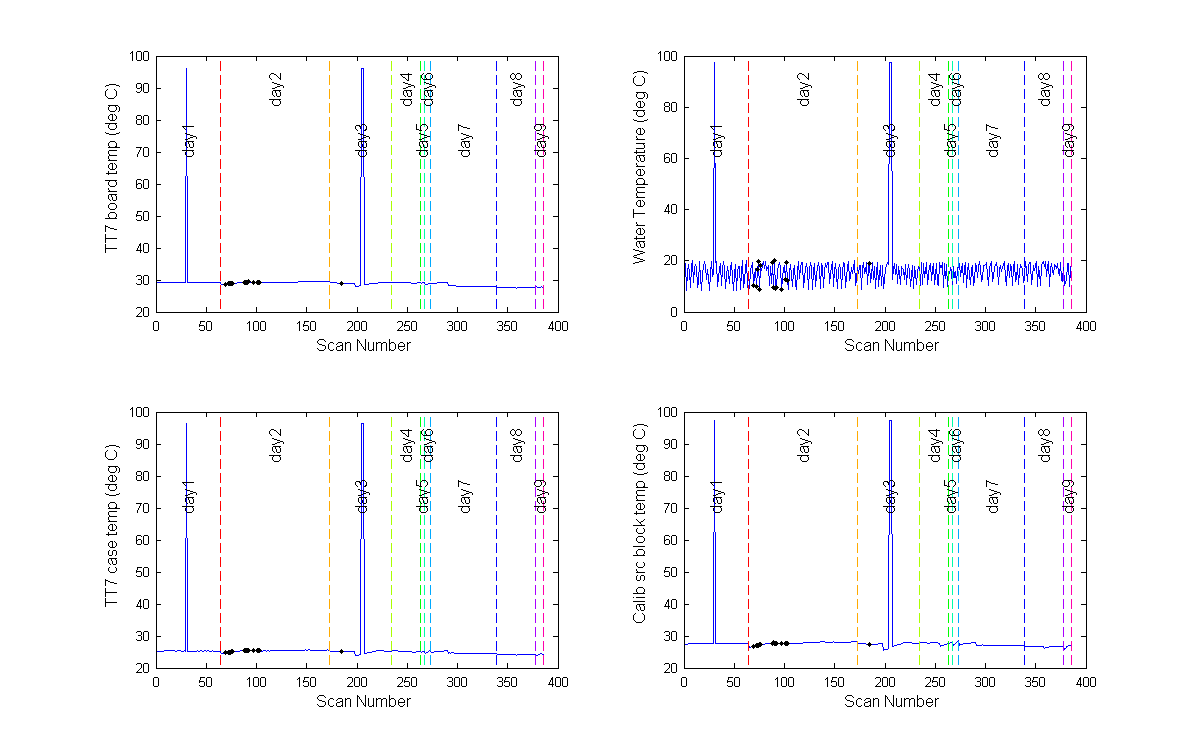
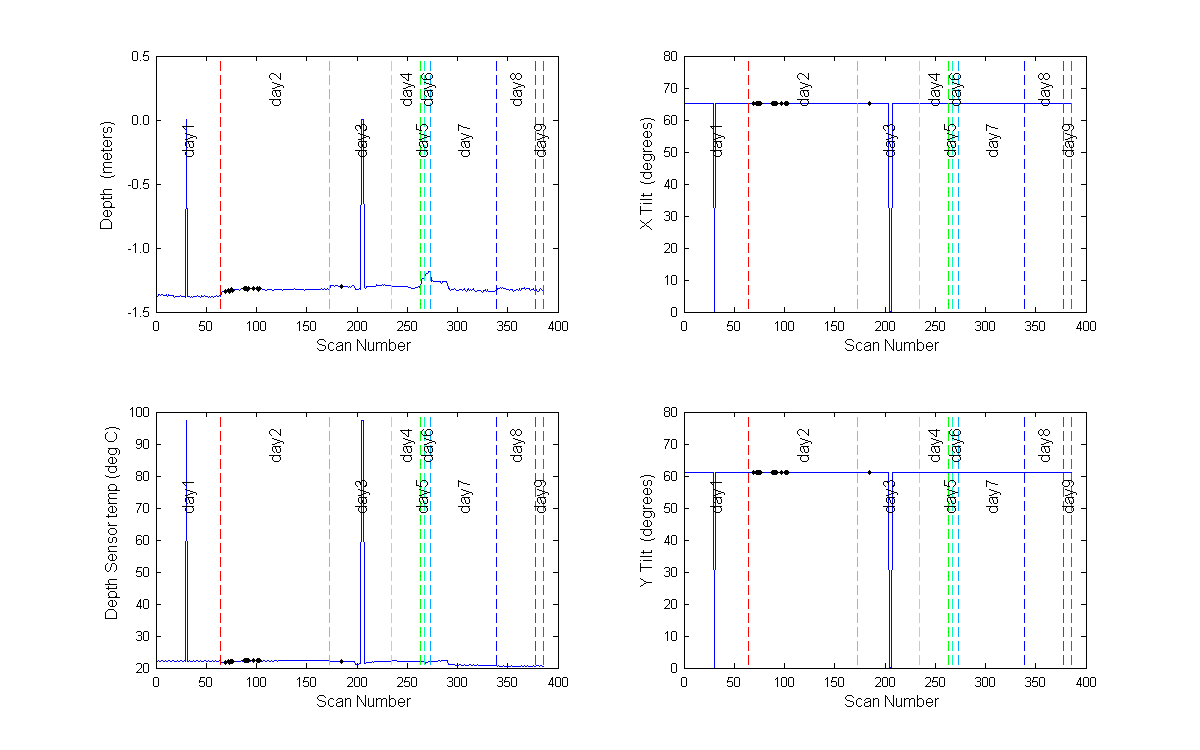
Figure 2
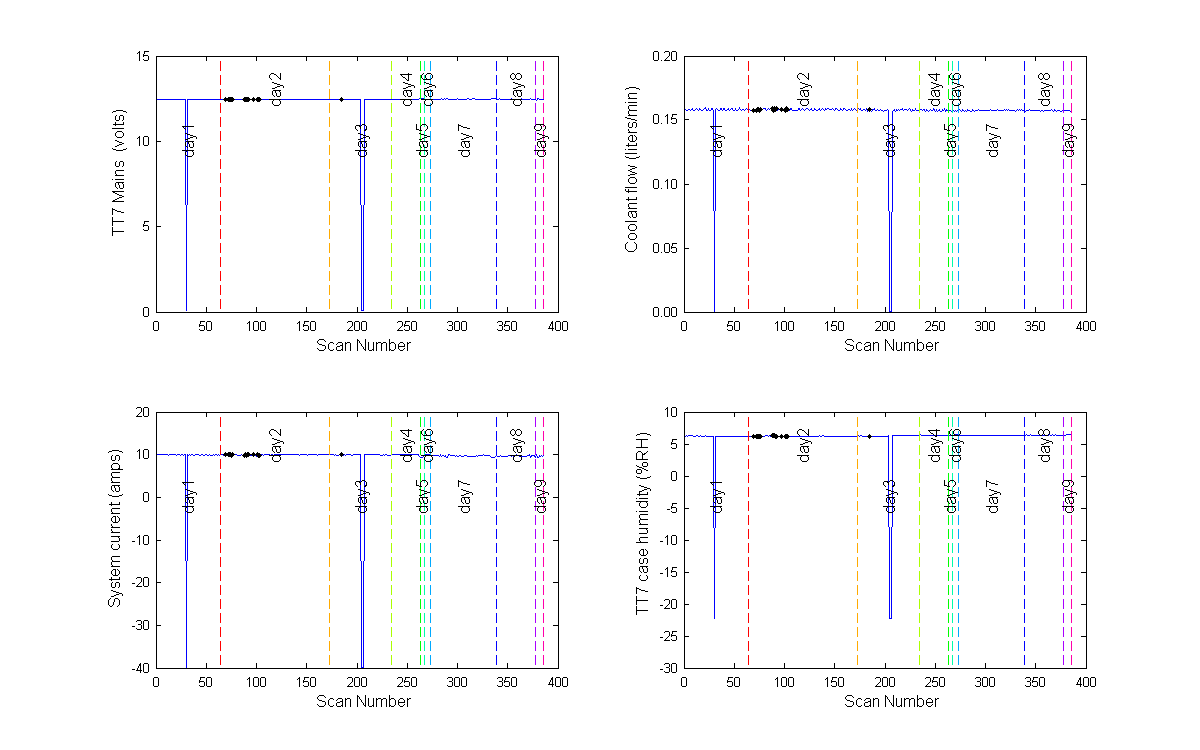
Figure 3
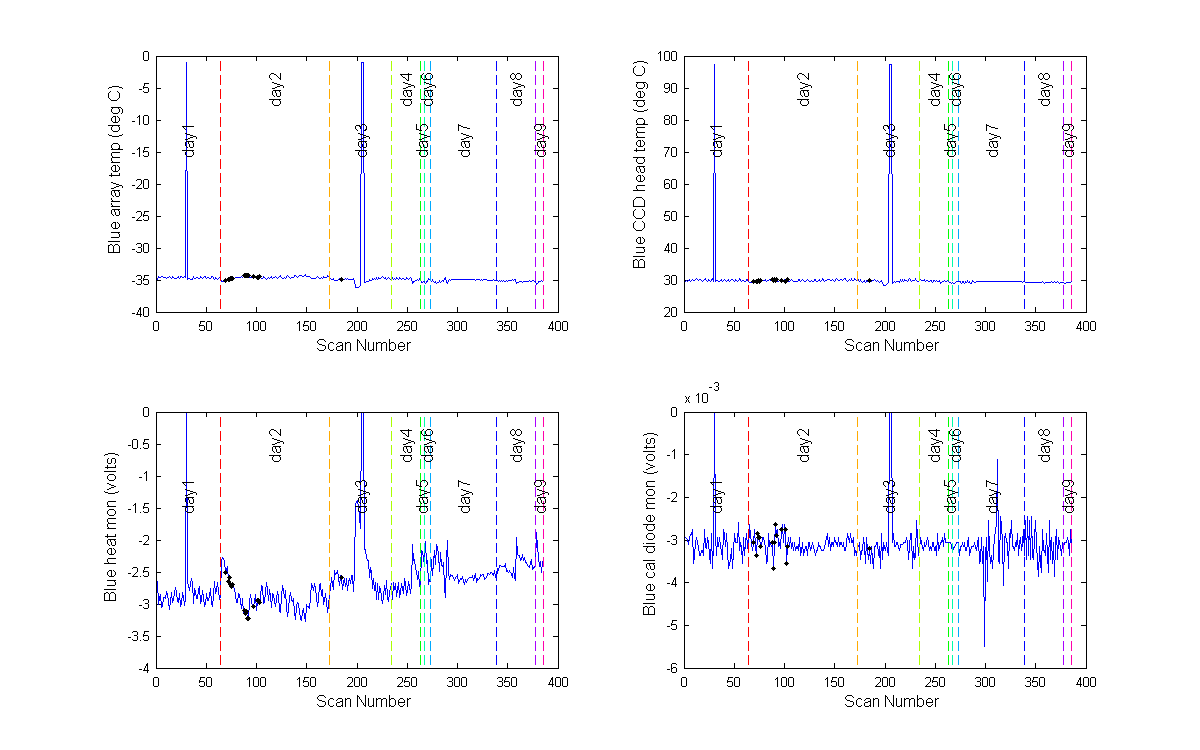
Figure 4
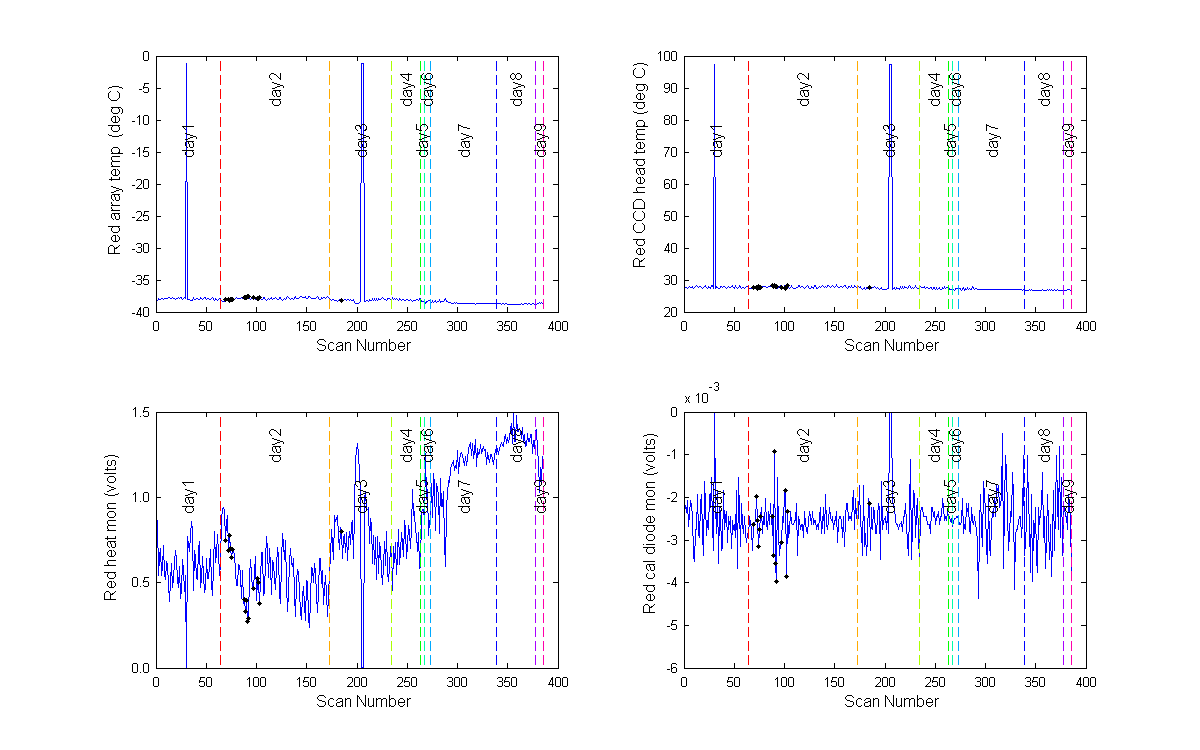
Figure 5
Same graphs with the two bad data points removed.
Figure 6
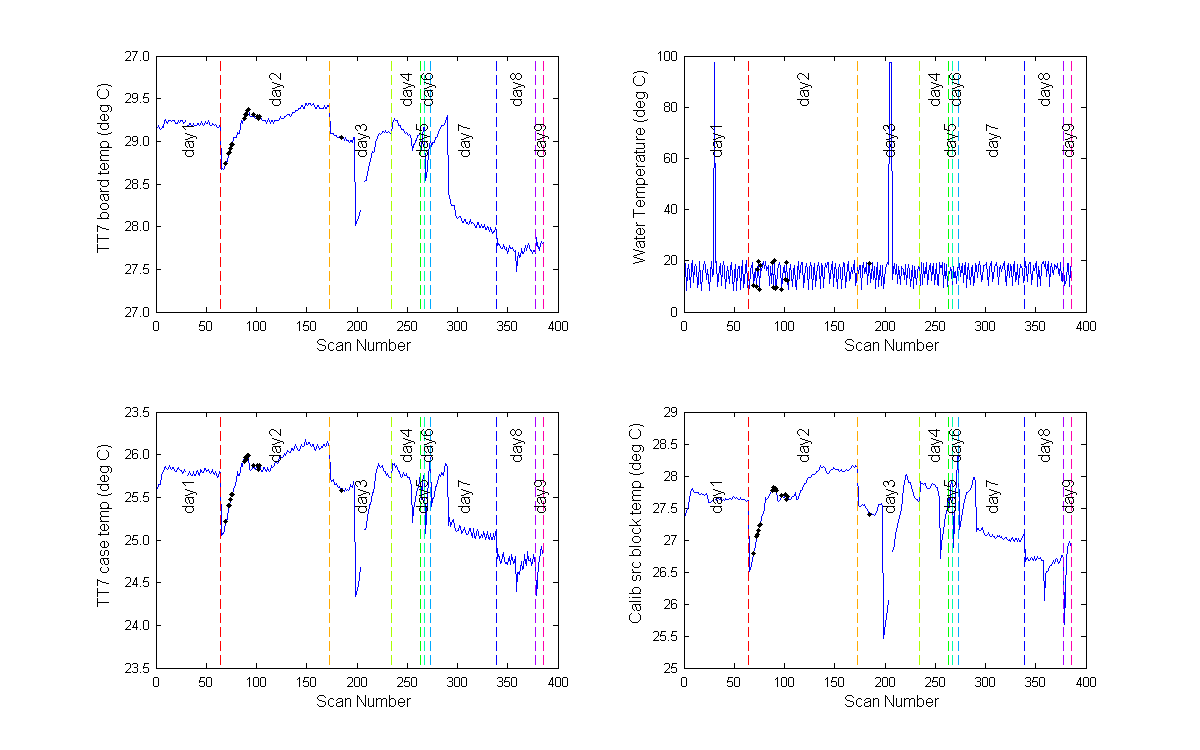
Figure 7
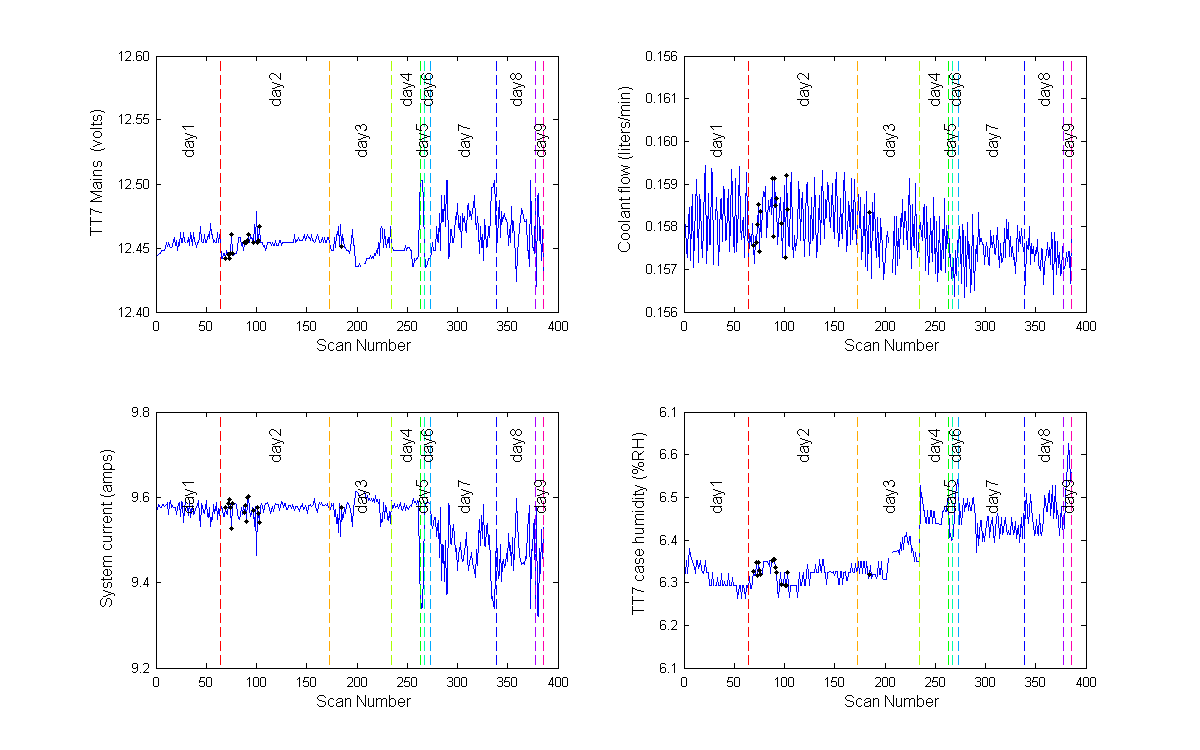
Figure 8
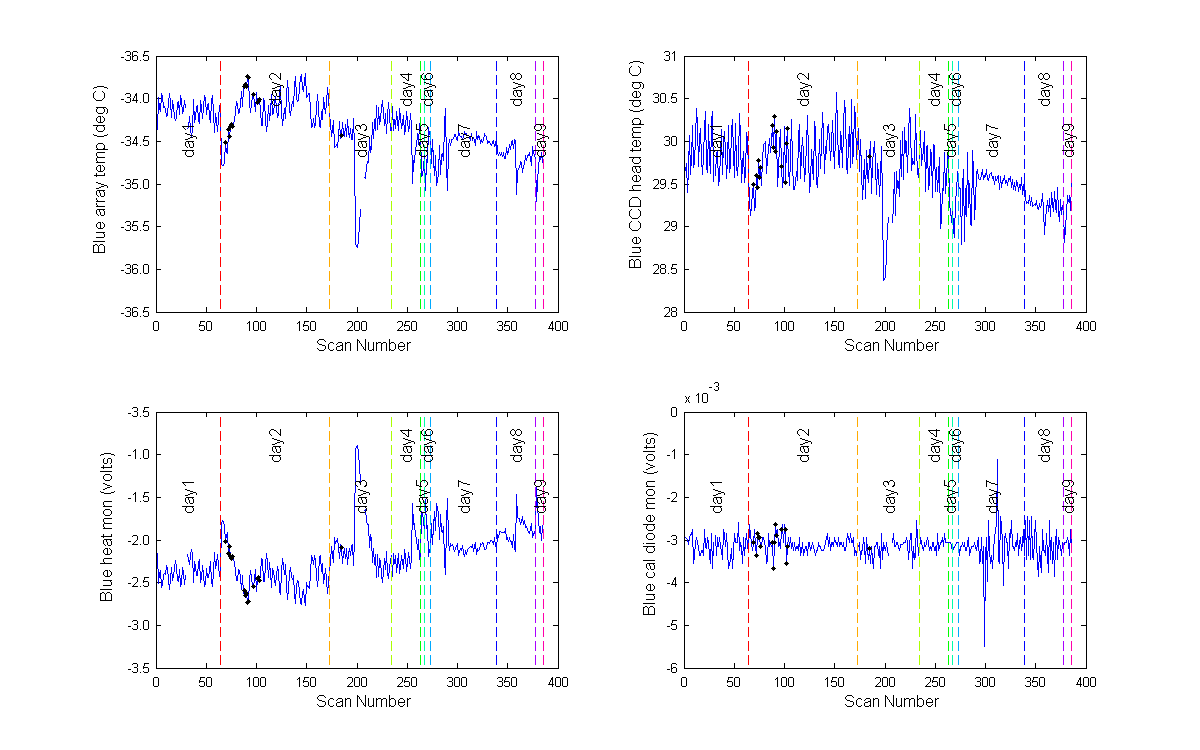
Figure 9
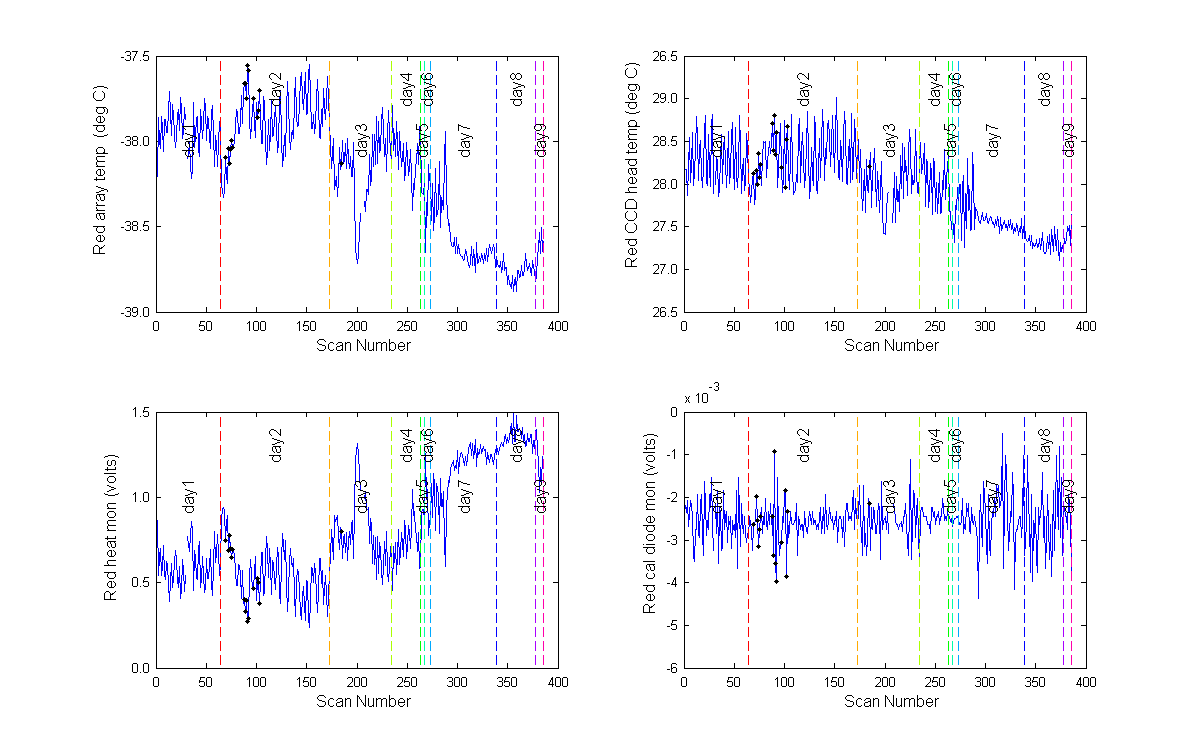
Figure 10
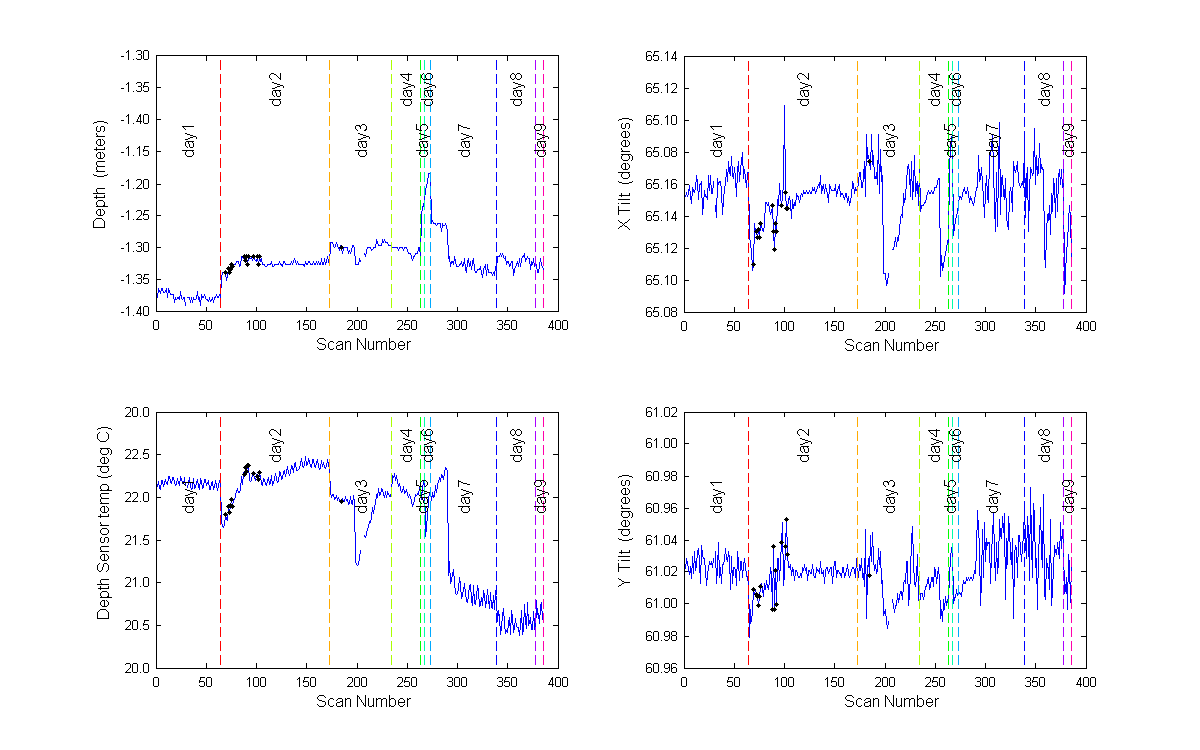
Figure 11