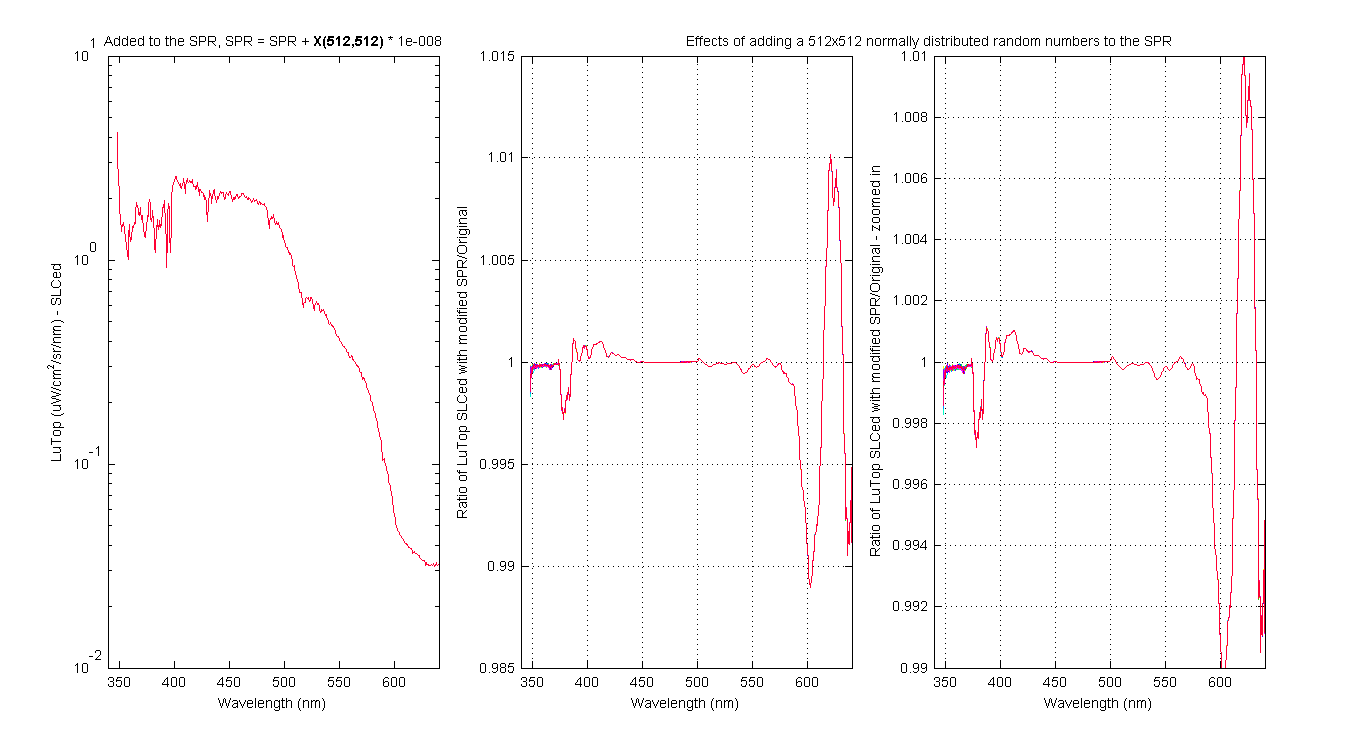
This page is similar to Page Num 3.06. The difference is in the way the SPR was modified. I am still using LuTop data and the LuTop data and it's system respone are SLCed using the same SPR. Plotted are the converted in-water LuTop. The idea is to create a 512x512 matrix of normally distributed random numbers to the SPR before using it to SLC the in-water and lamp signal. In this case the formula is to generate a 512by512 matrix and then multiply if by a set value to scale it (see title for scaling value). This was done 30 times in each plot. So each graph contains the 30 lines create with the 30 512by512 randomly chosen matrixes.
Figure 1
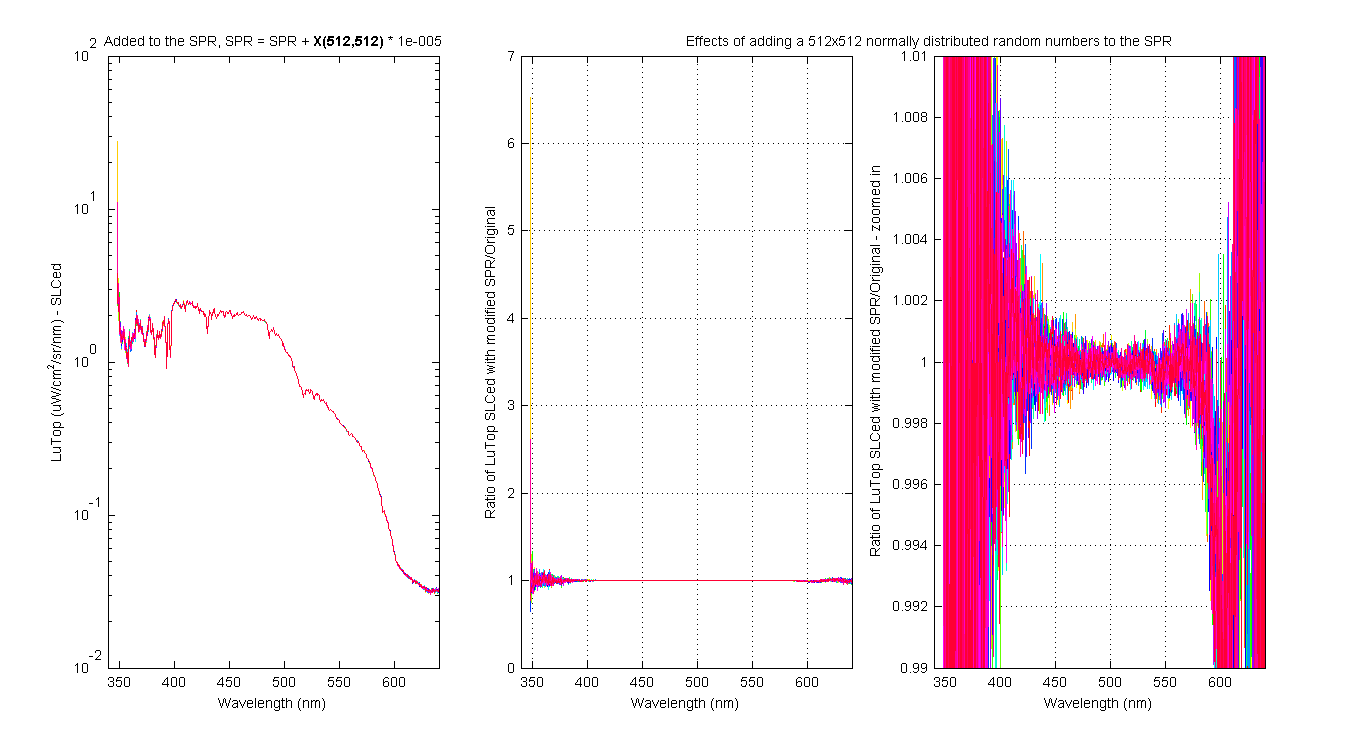
Figure 2
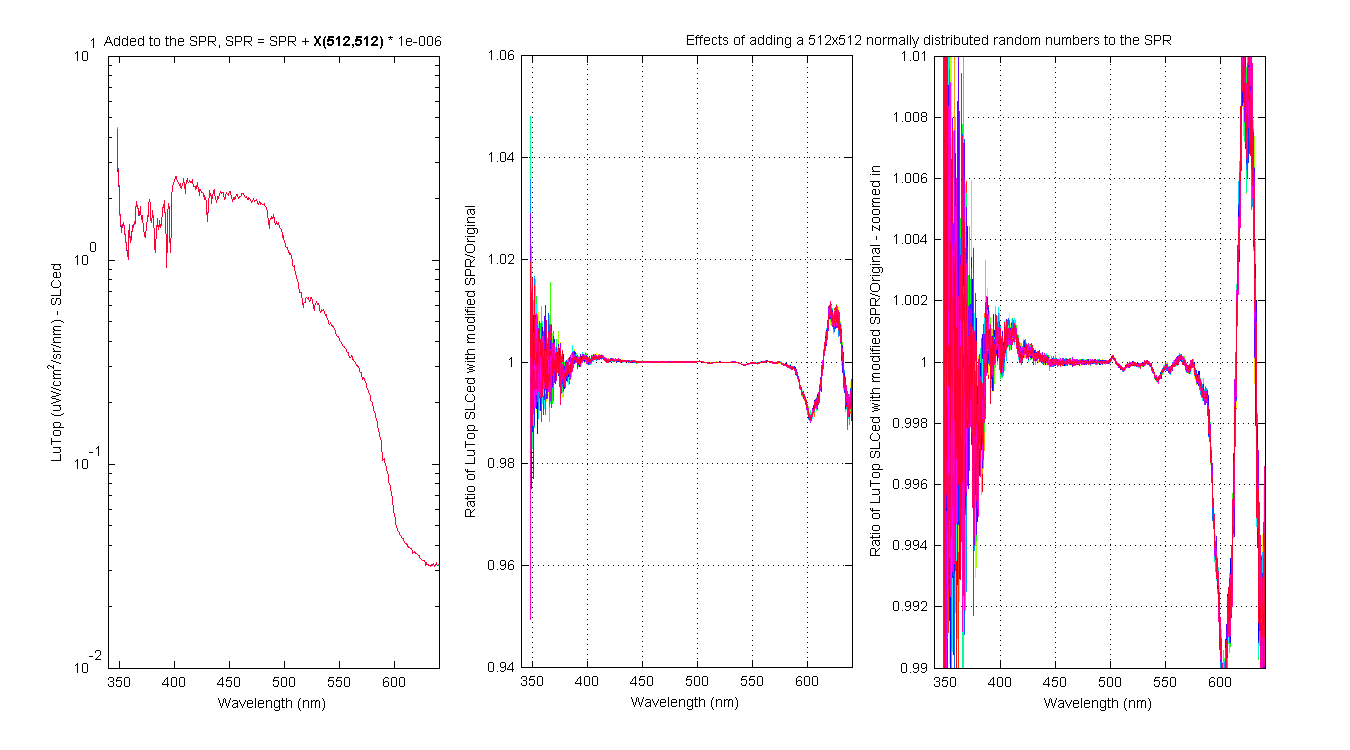
Figure 3
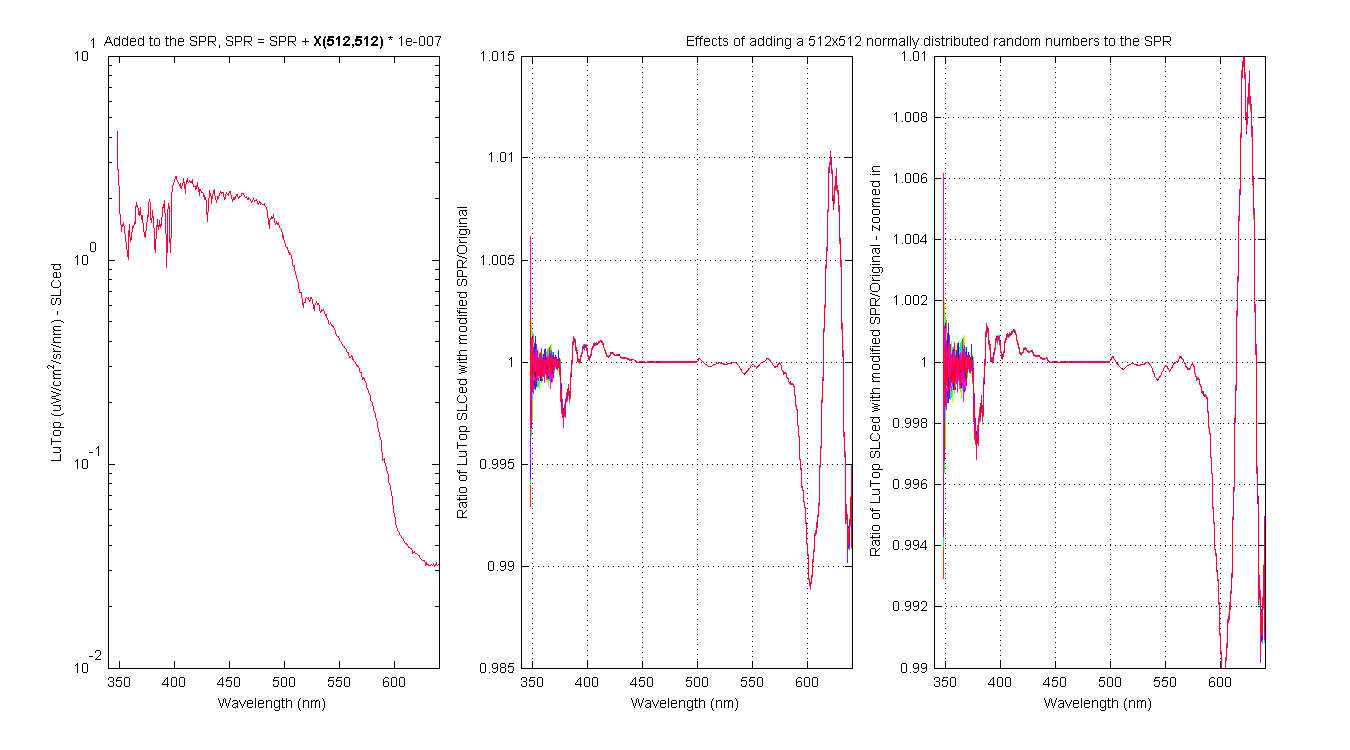
Figure 4