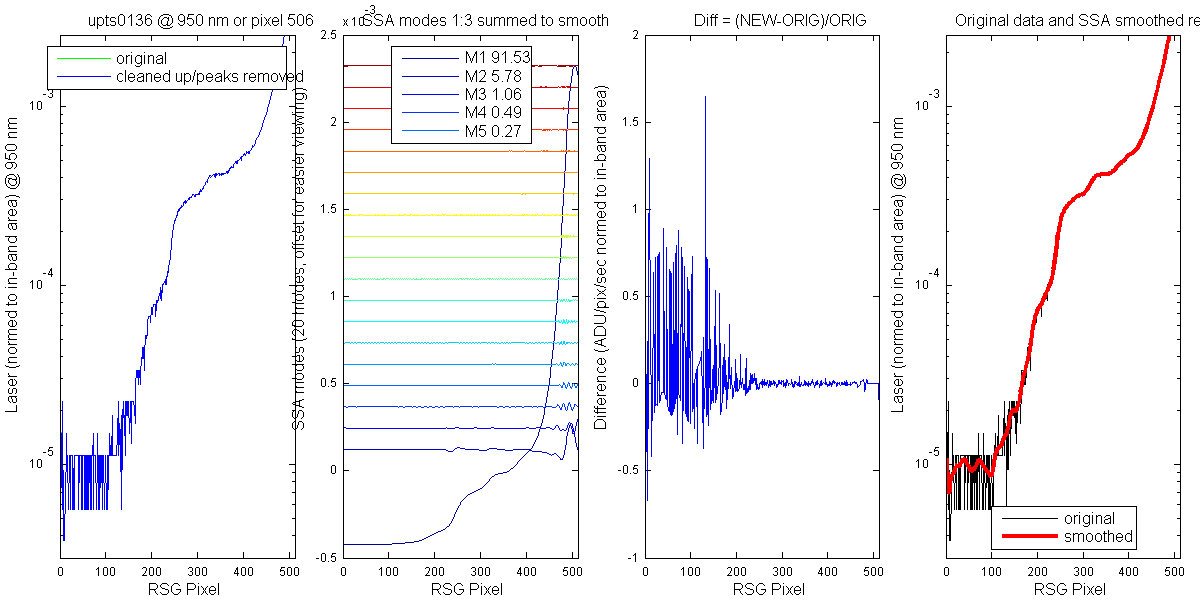
Plot showing the process of smoothing the BSG laser data. I used an SSA to smooth the data with 20 modes. The smoothed data is the sum of the first two modes. As you can see in the figures below for most of the laser data the first mode is nearly 98% or more of the variablility. I already had code which removed the main peak, reflection peak and secondary peak prior to smoothing. This helps the SSA modes to focus on the noise rather than trying to "fit" the peaks. The main peak and reflection peaks dont really need smoothing anyway.
Figure 1
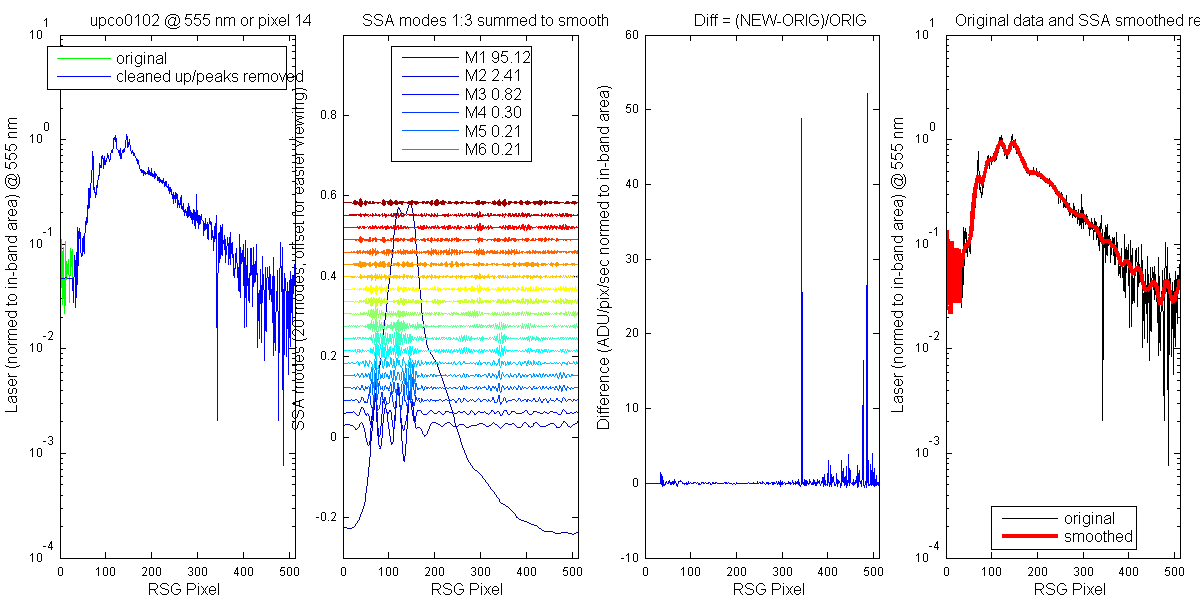
Figure 2
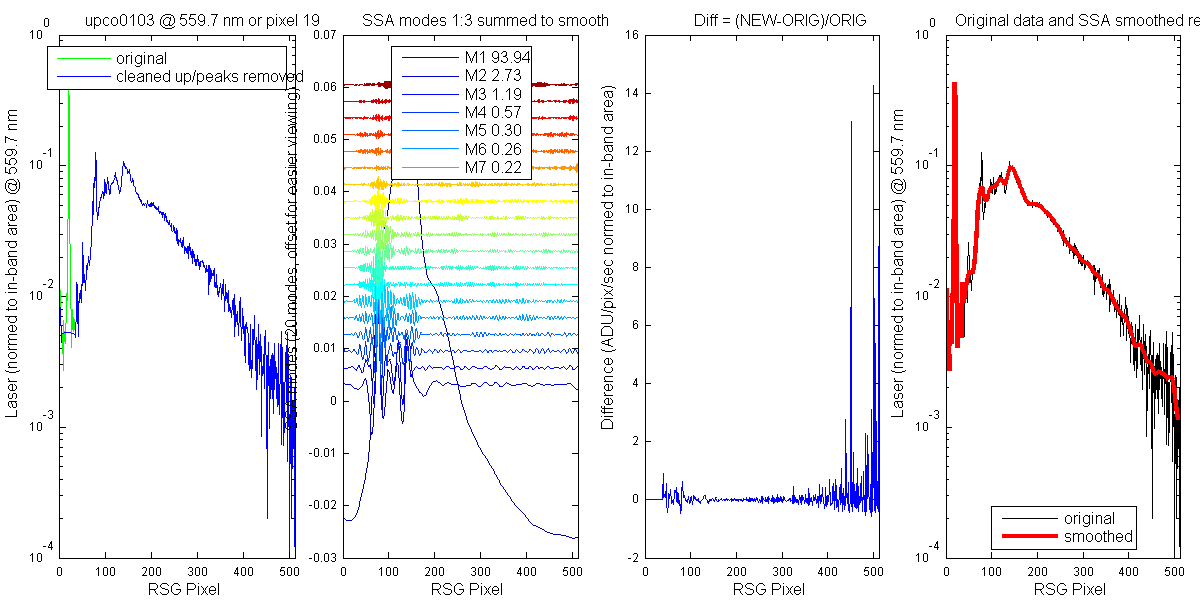
Figure 3
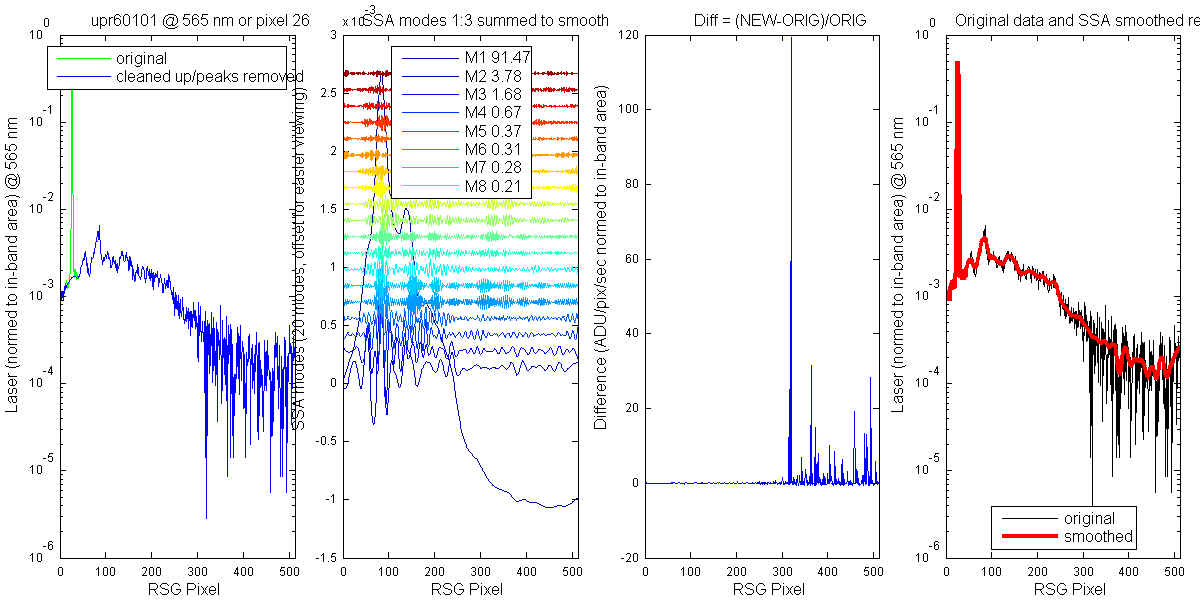
Figure 4
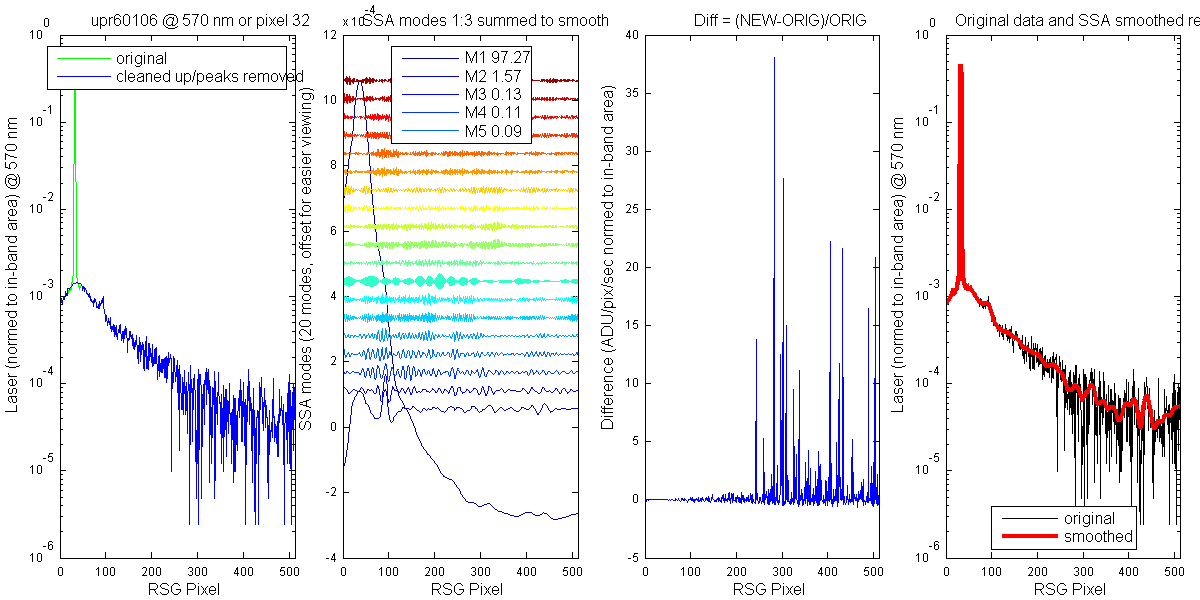
Figure 5
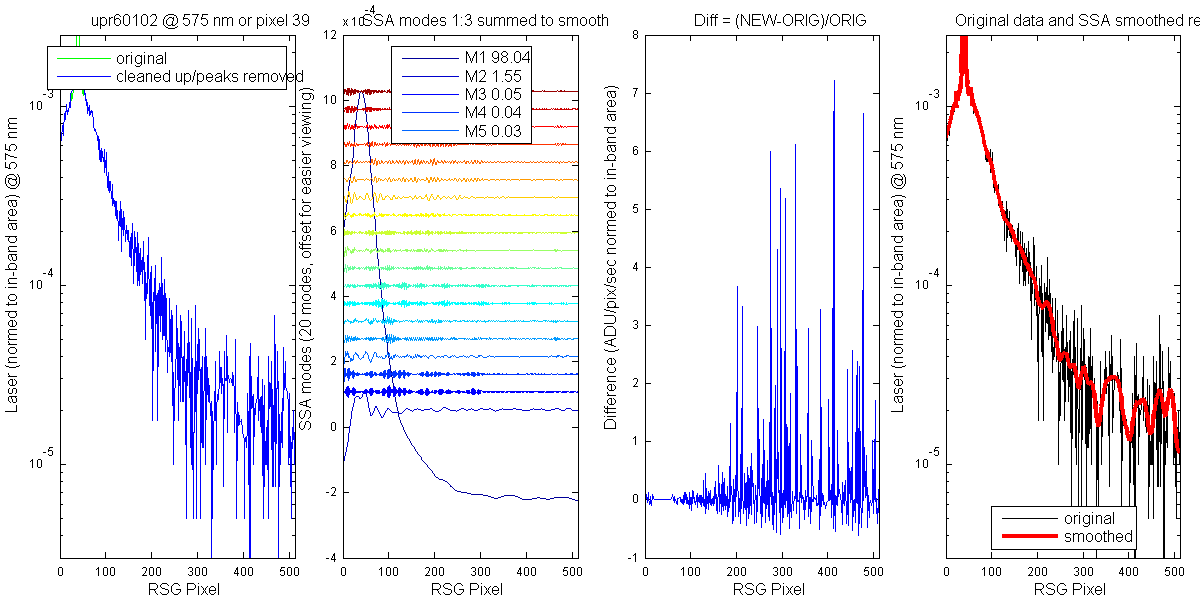
Figure 6
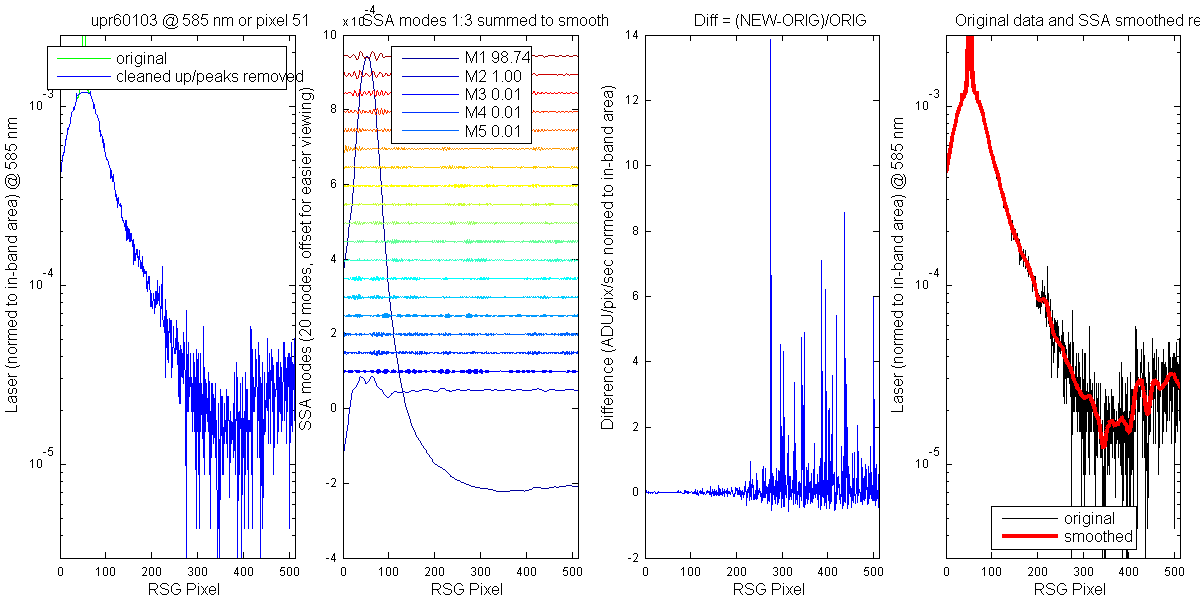
Figure 7
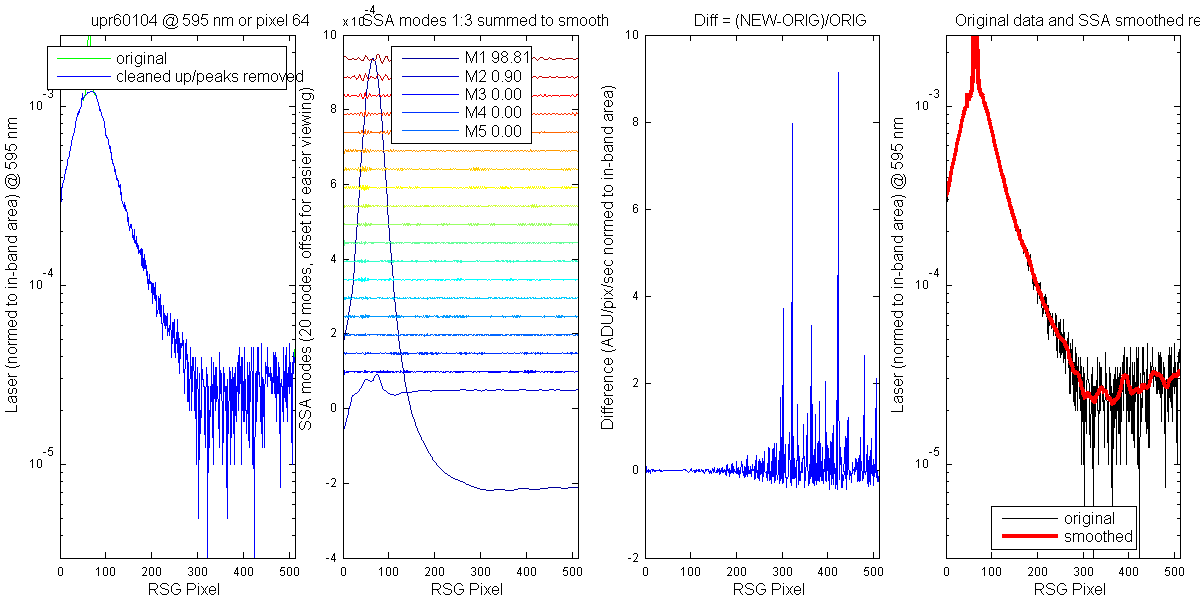
Figure 8
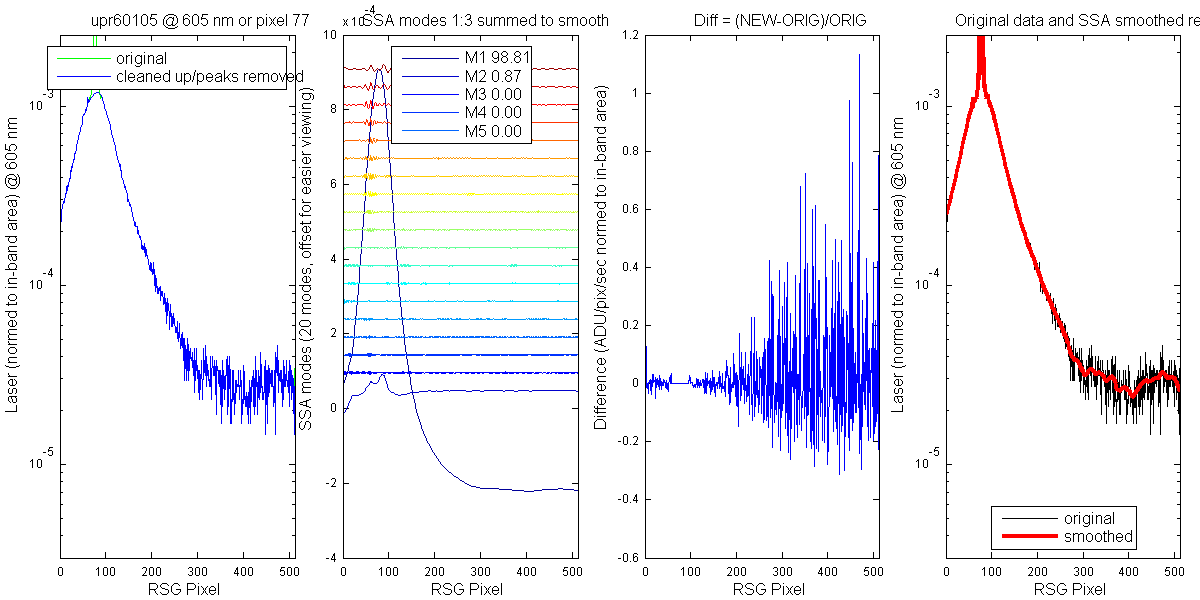
Figure 9
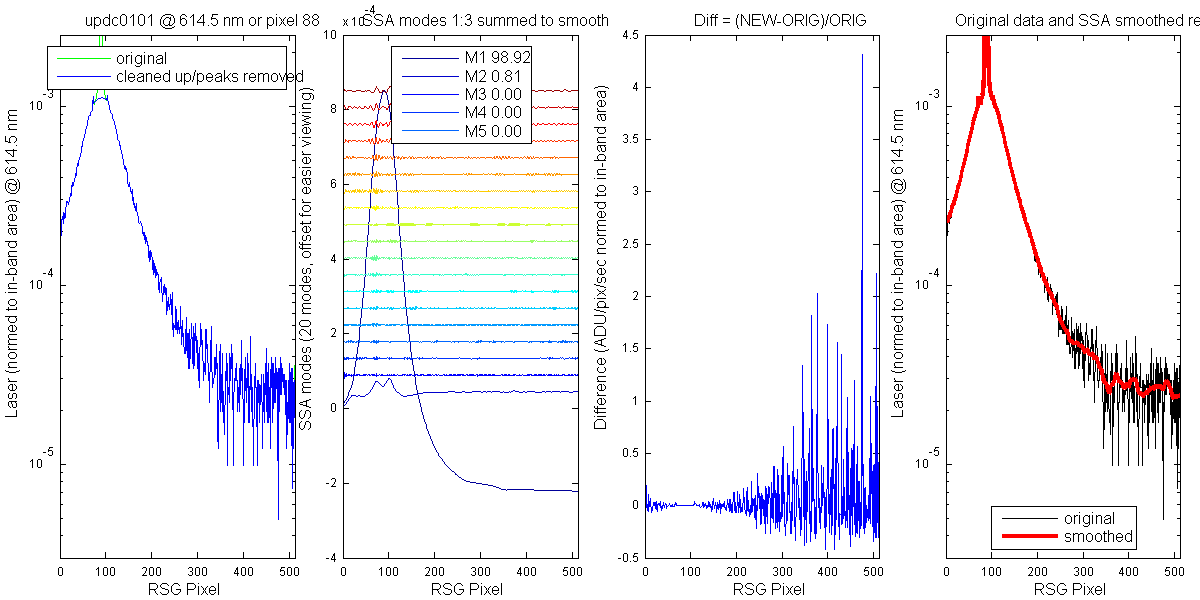
Figure 10
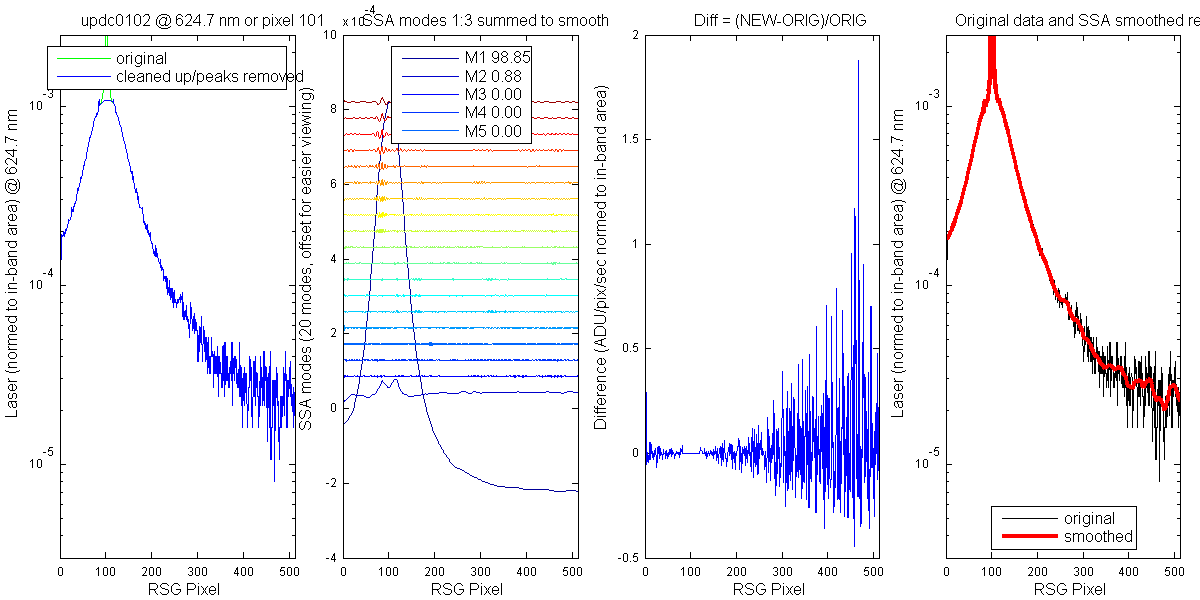
Figure 11
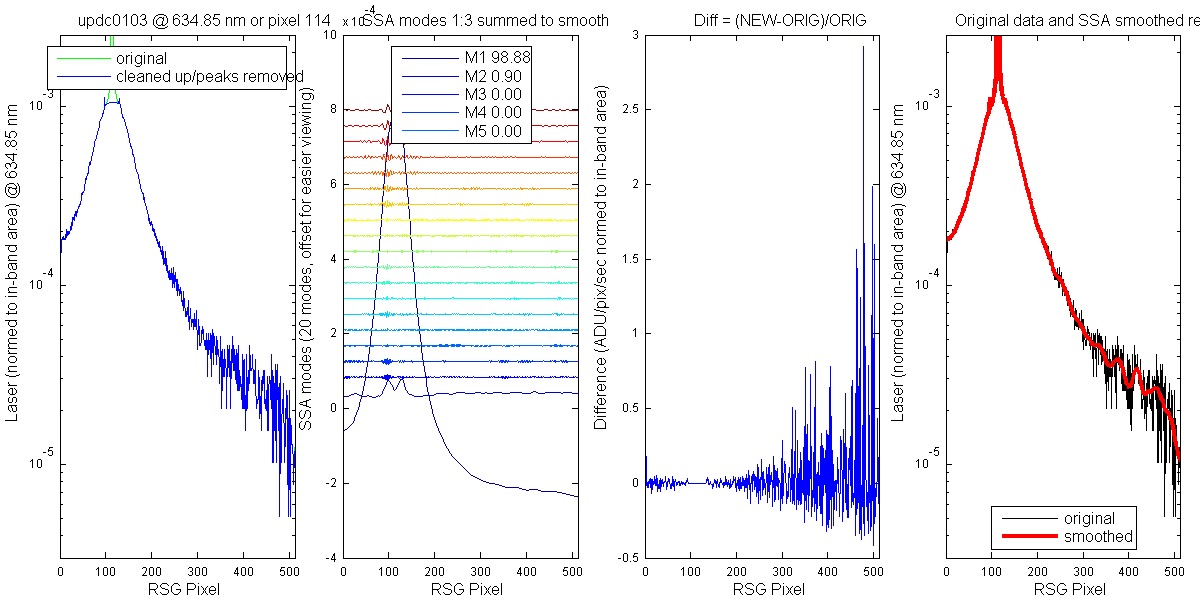
Figure 12
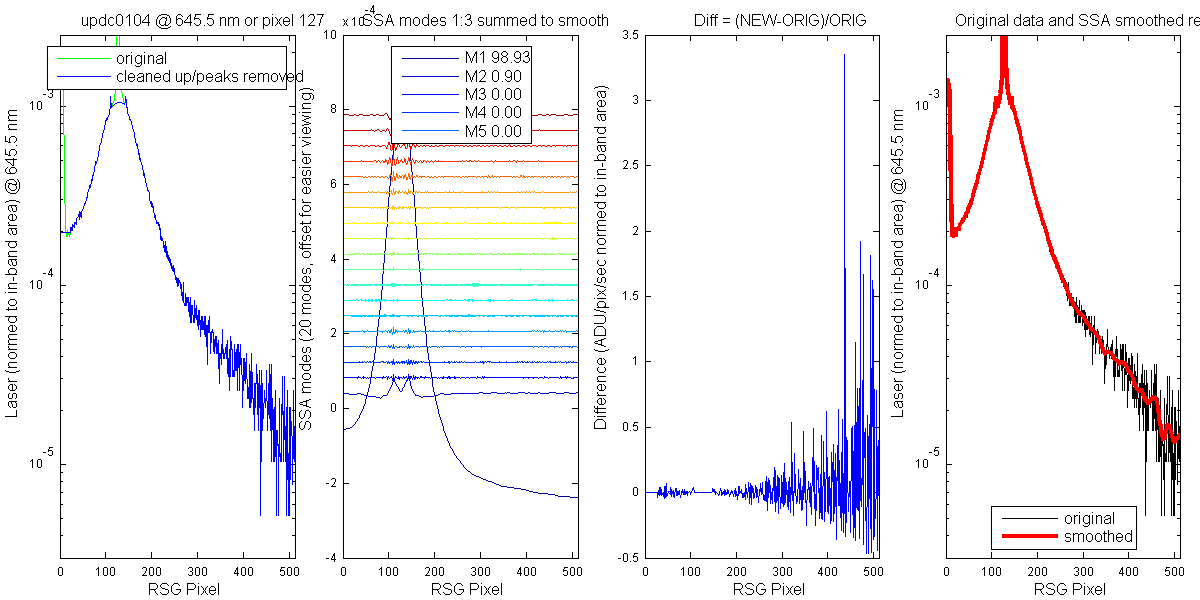
Figure 13
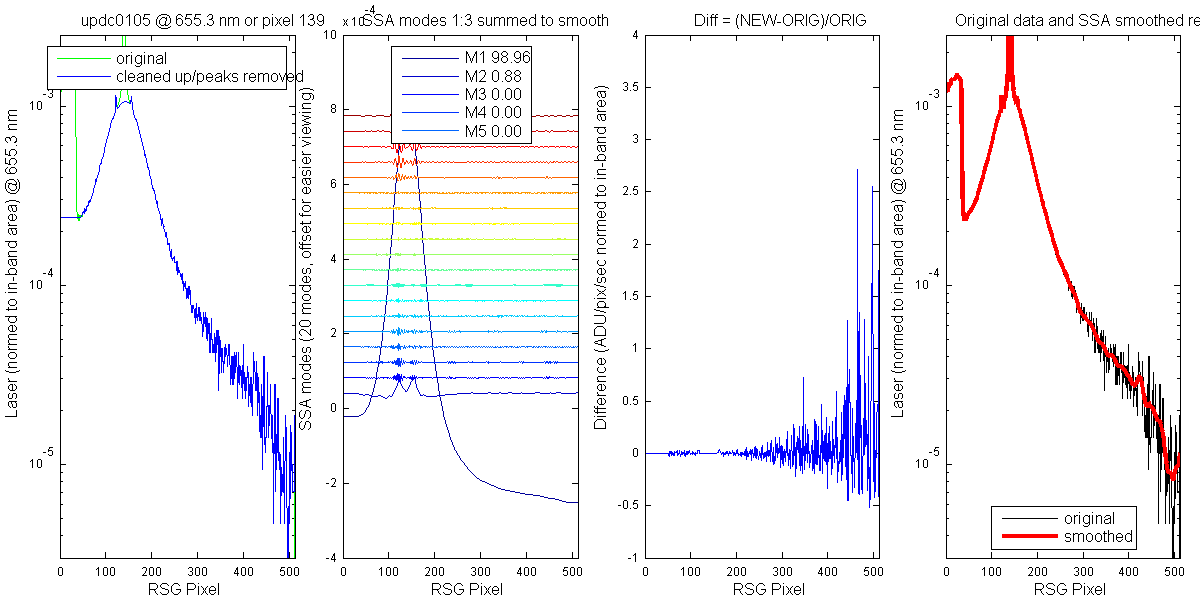
Figure 14
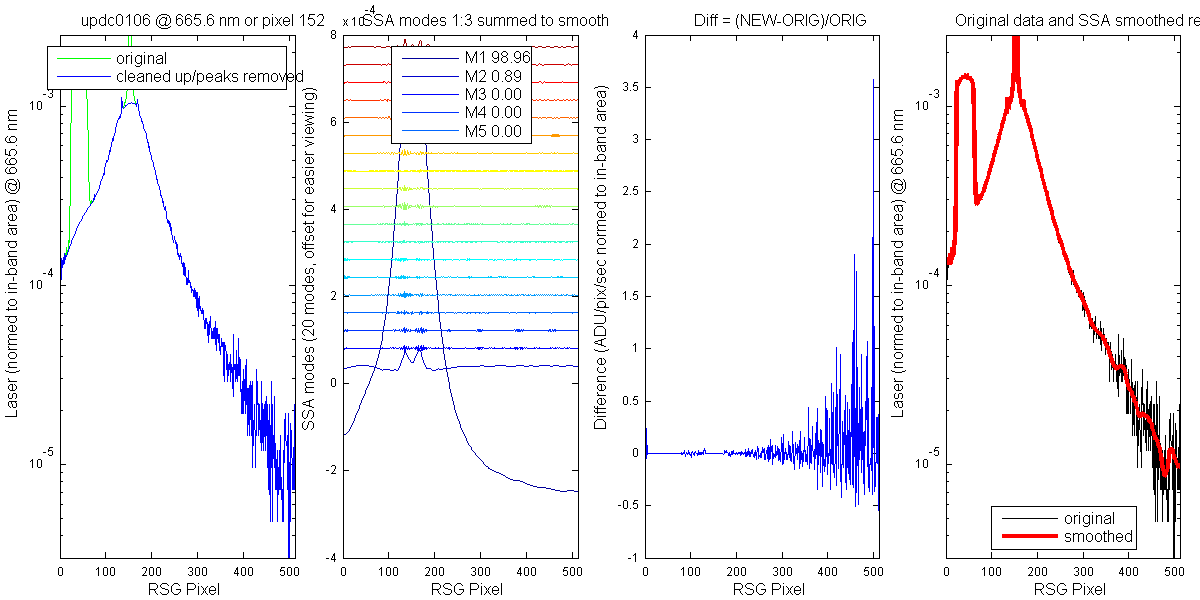
Figure 15
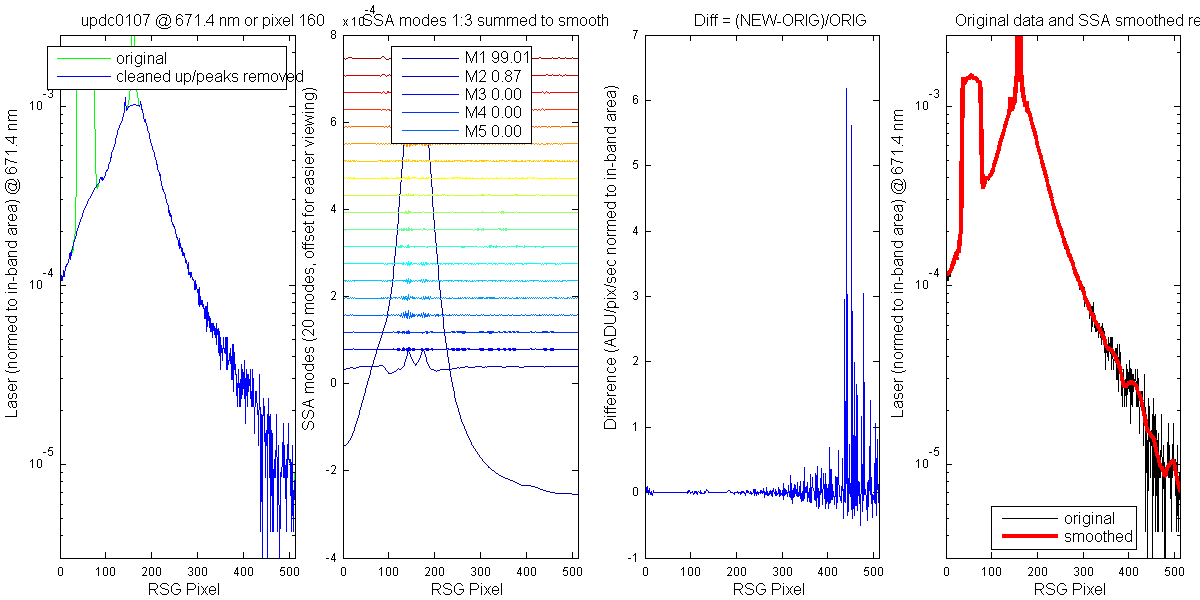
Figure 16
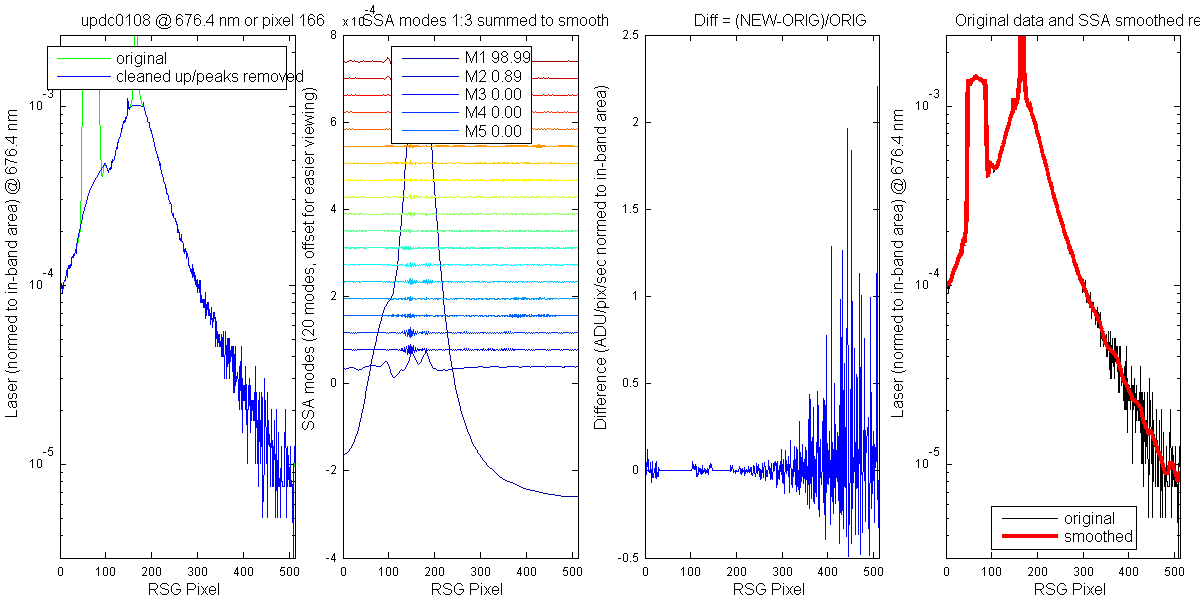
Figure 17
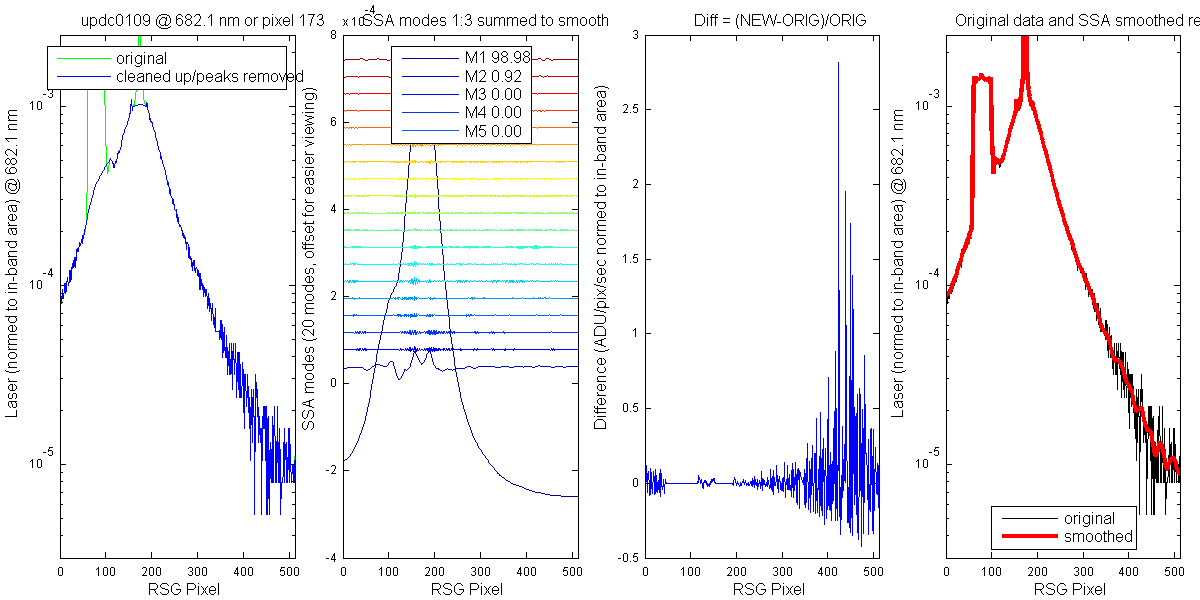
Figure 18
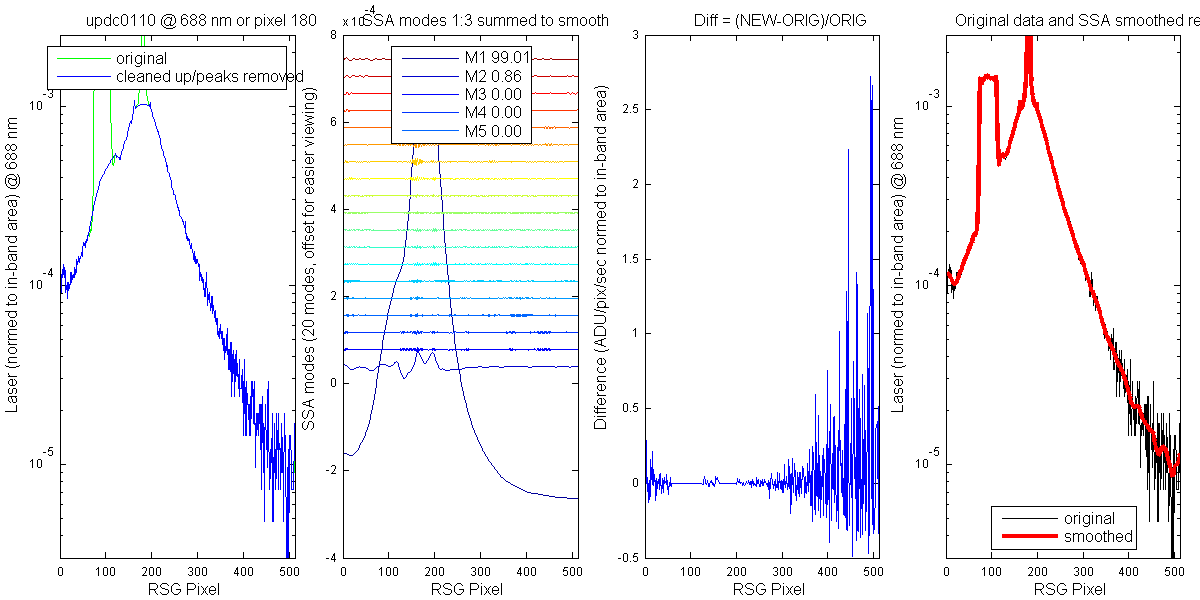
Figure 19
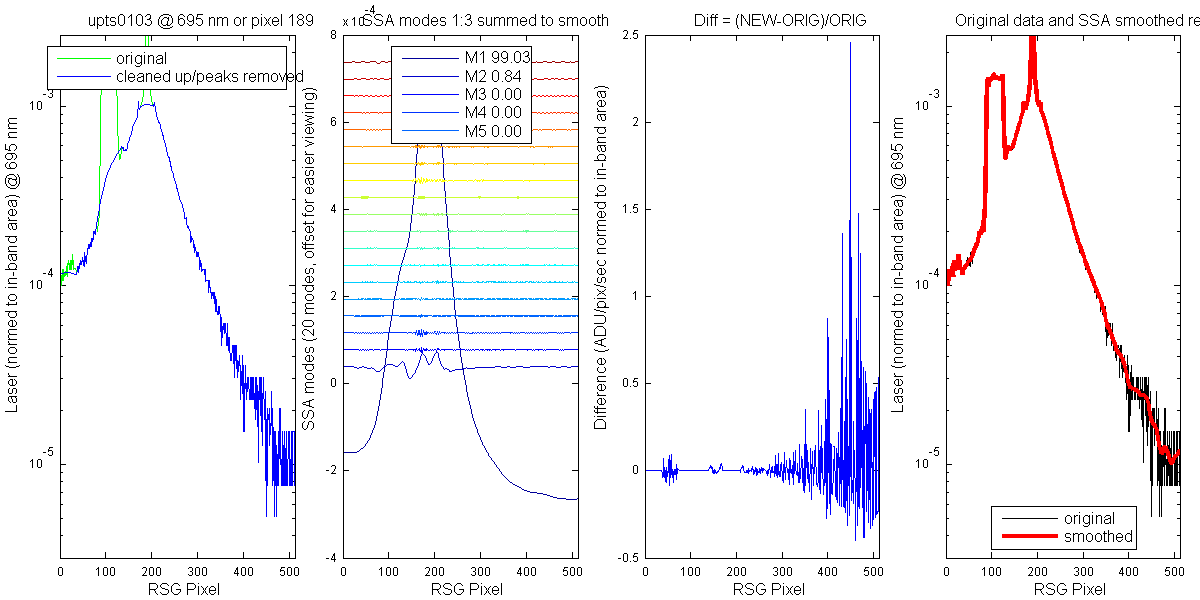
Figure 20
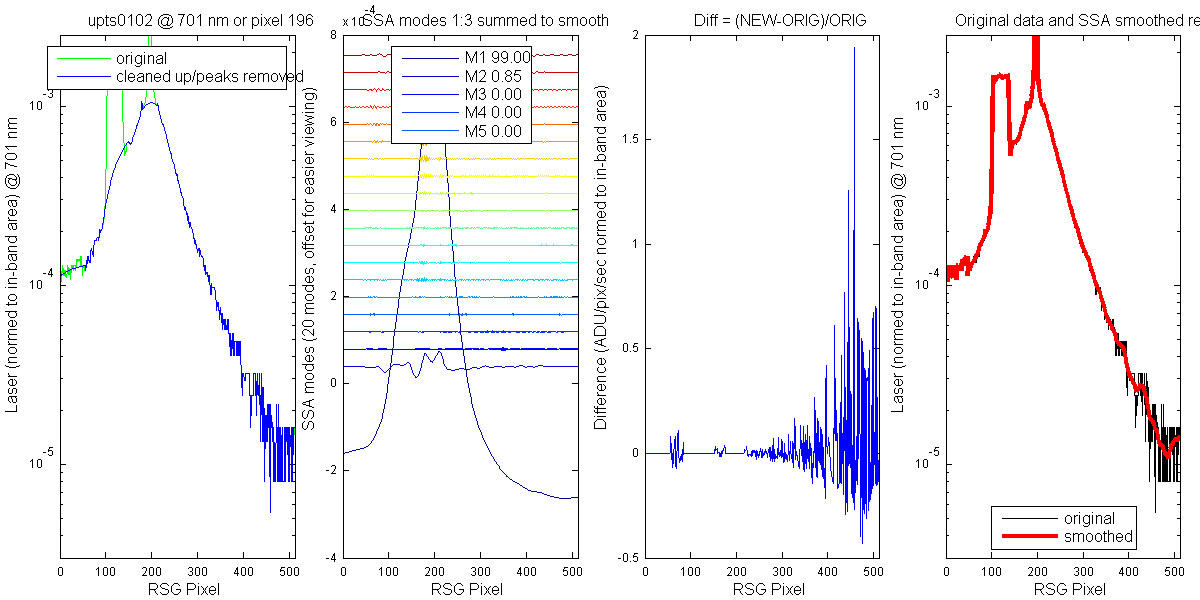
Figure 21
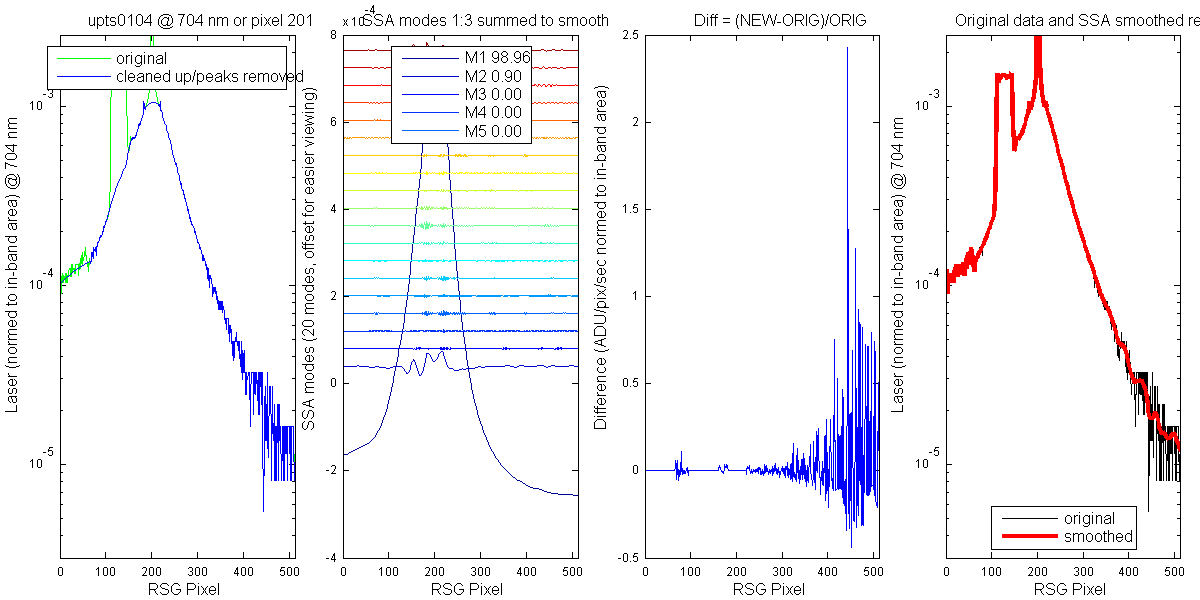
Figure 22
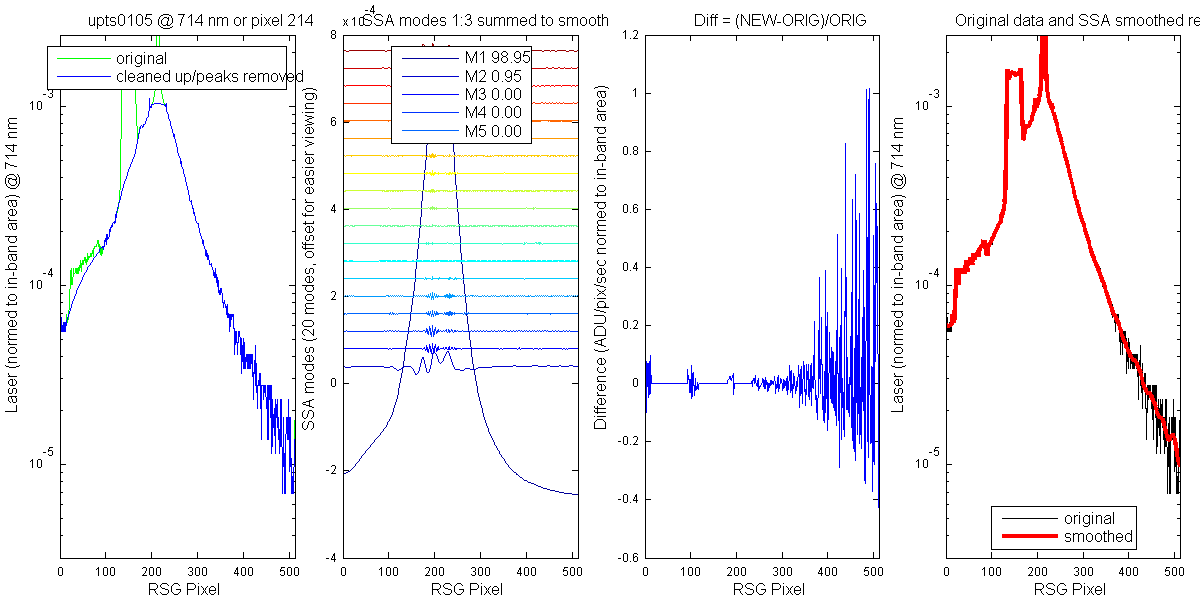
Figure 23
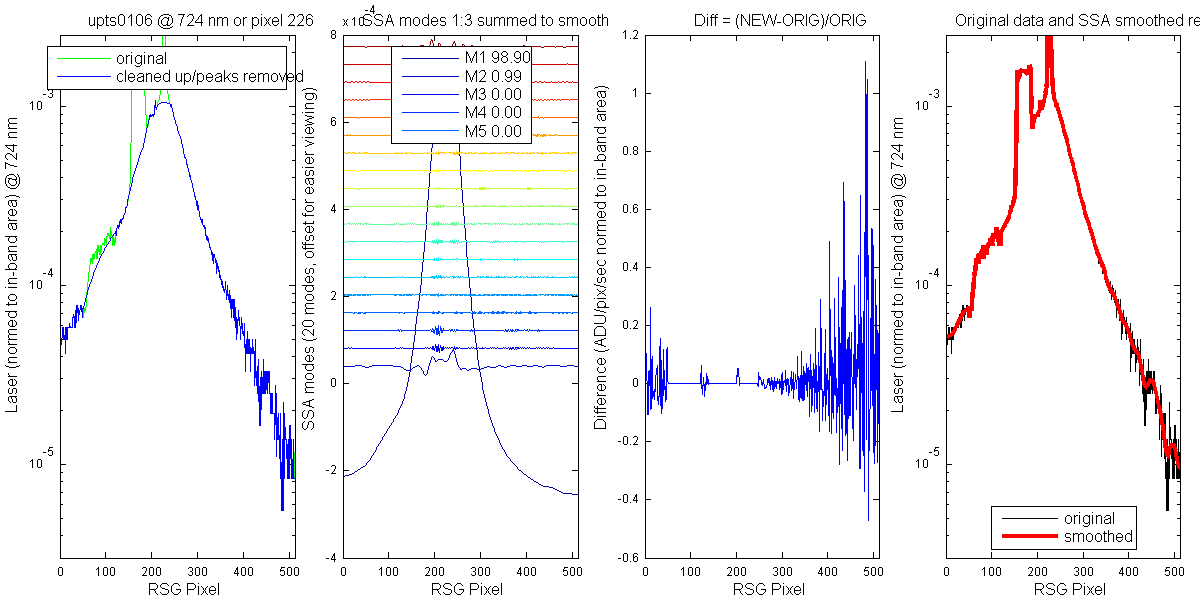
Figure 24
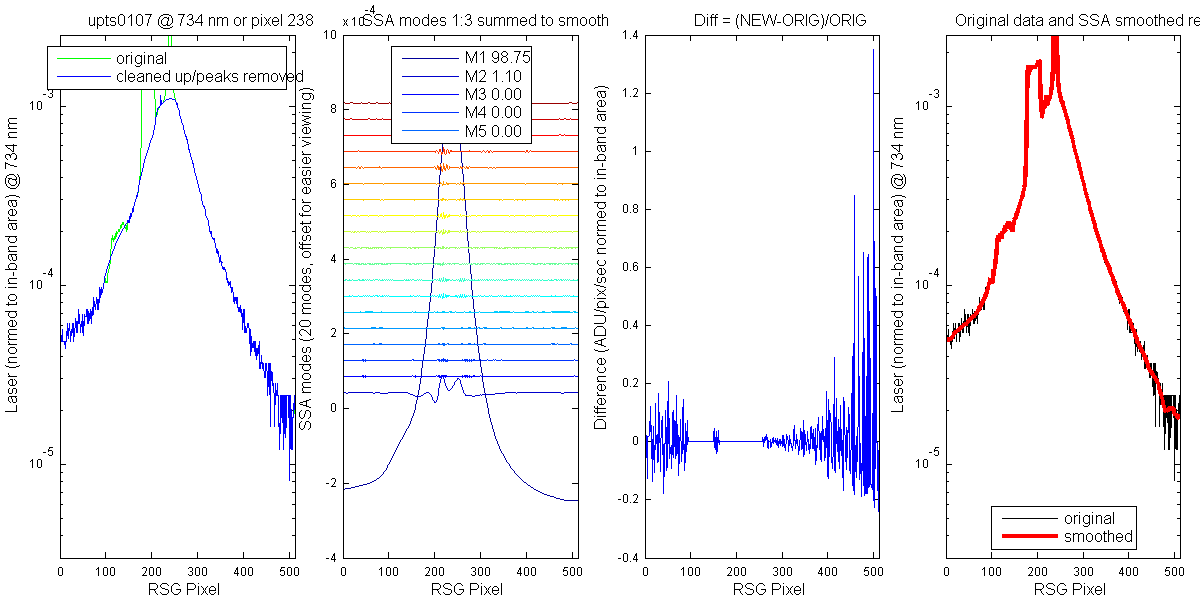
Figure 25
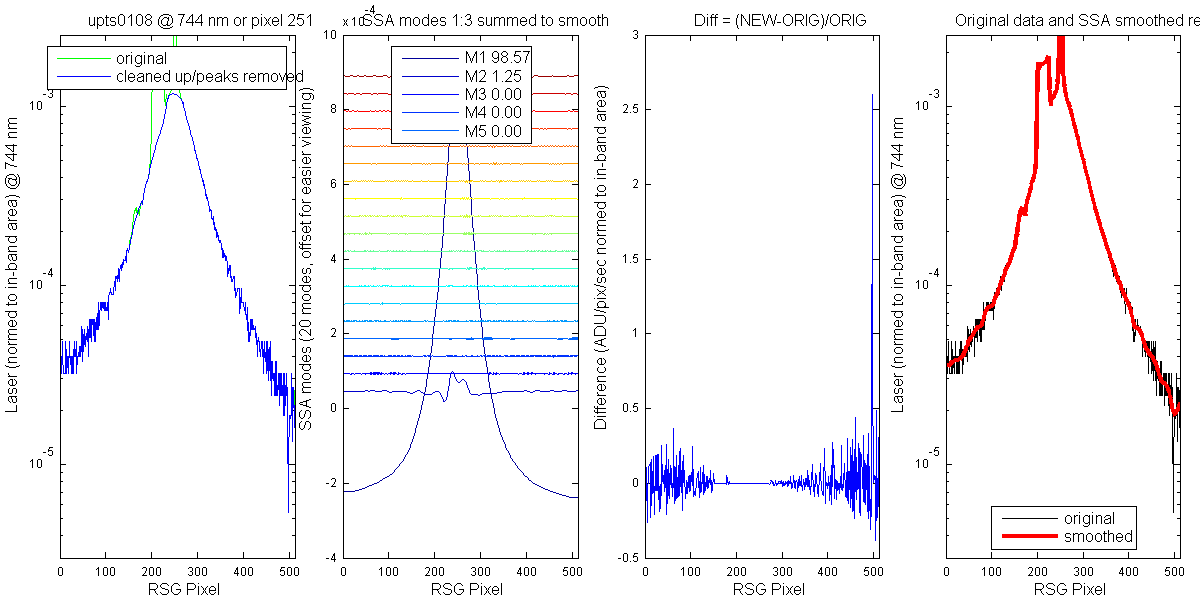
Figure 26
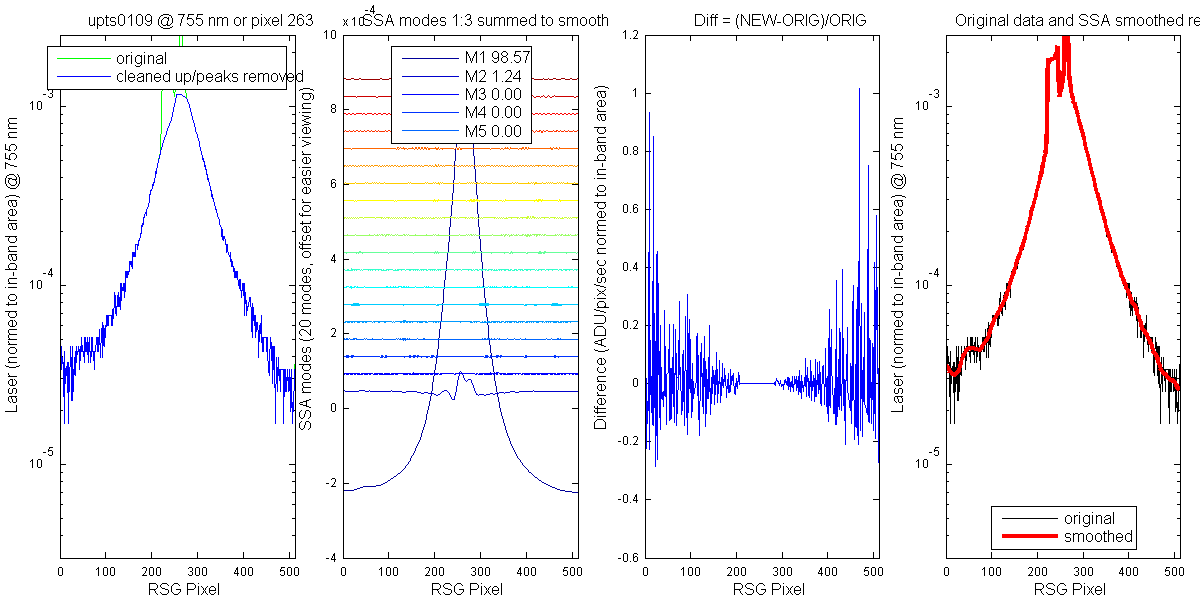
Figure 27
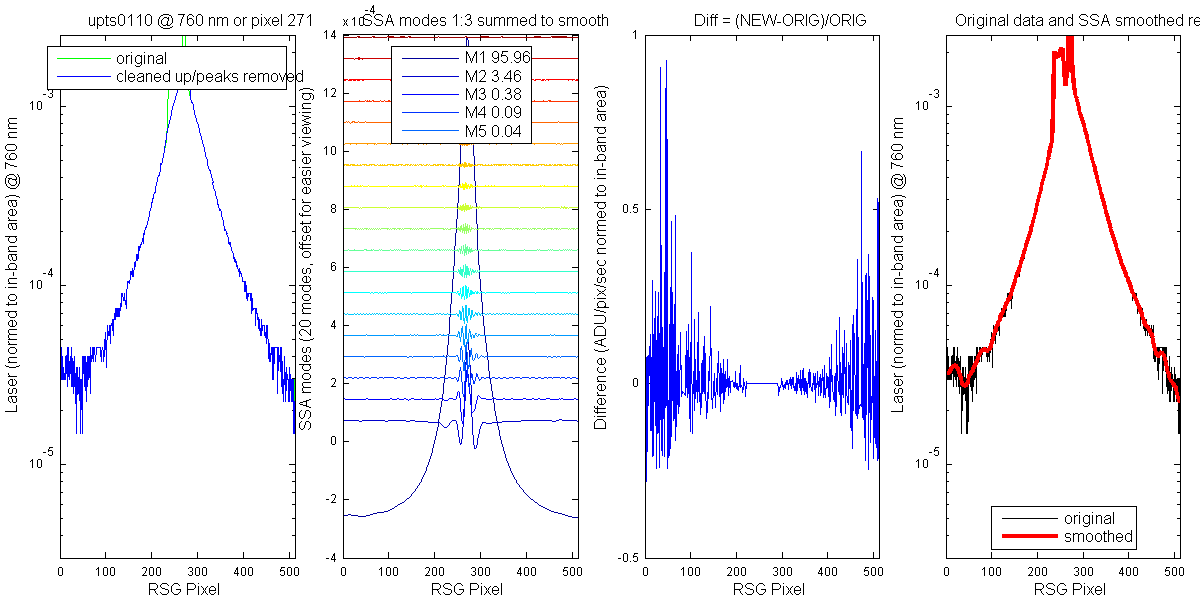
Figure 28
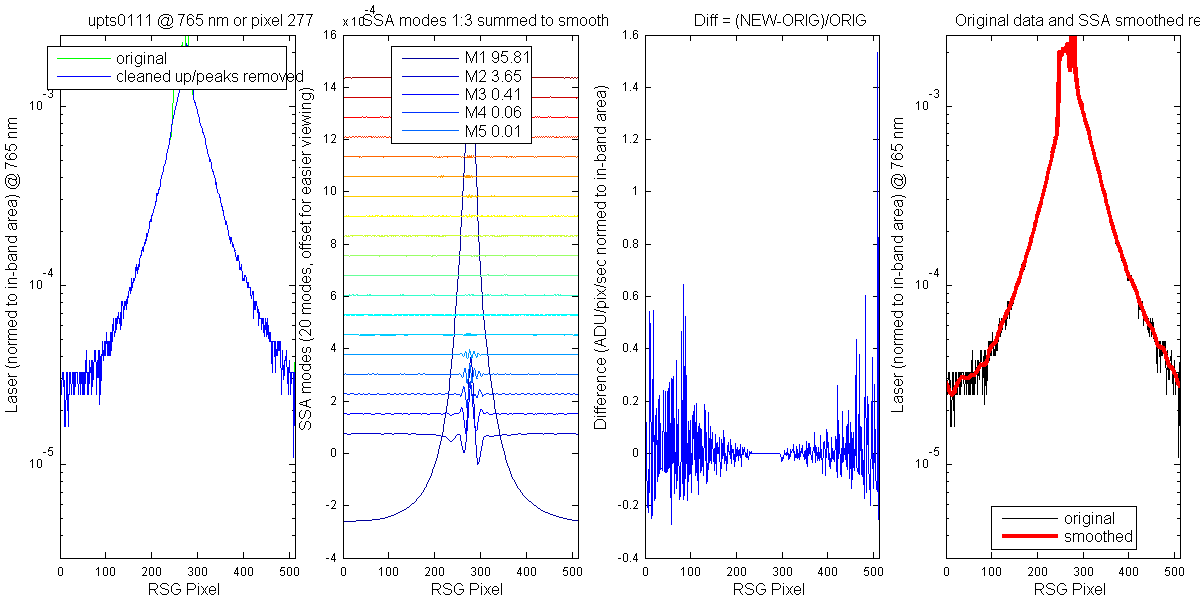
Figure 29
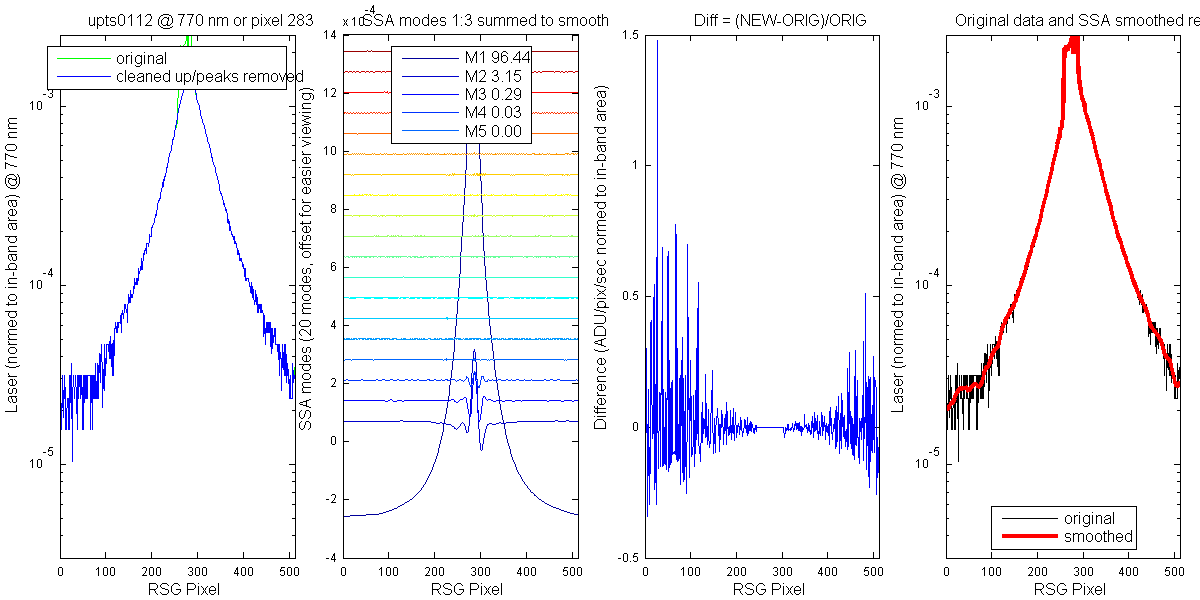
Figure 30
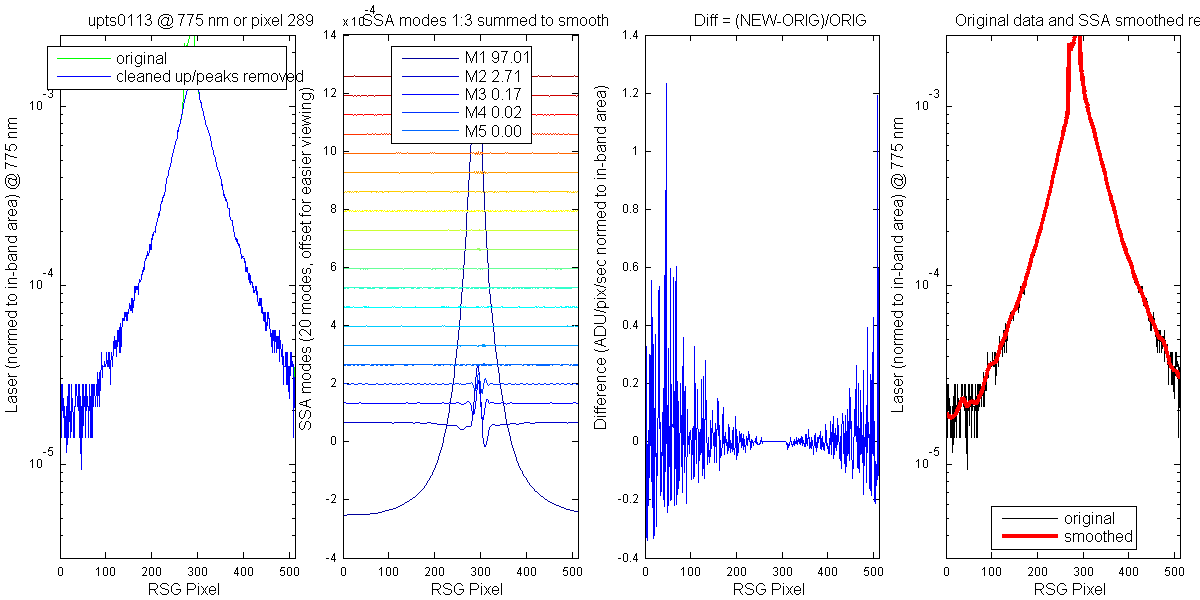
Figure 31
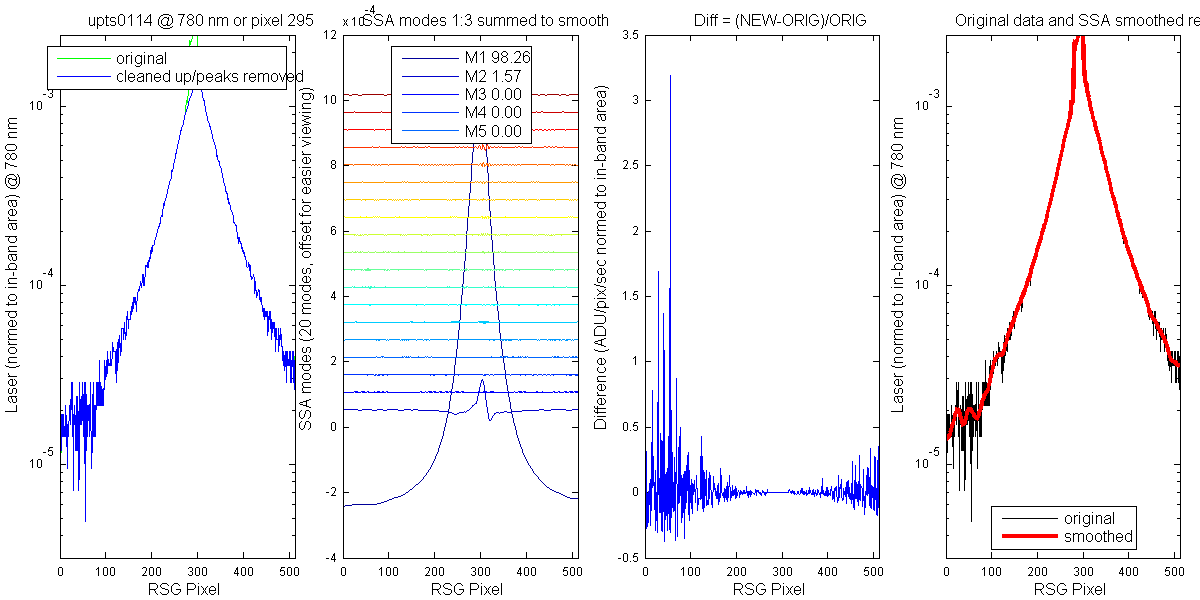
Figure 32
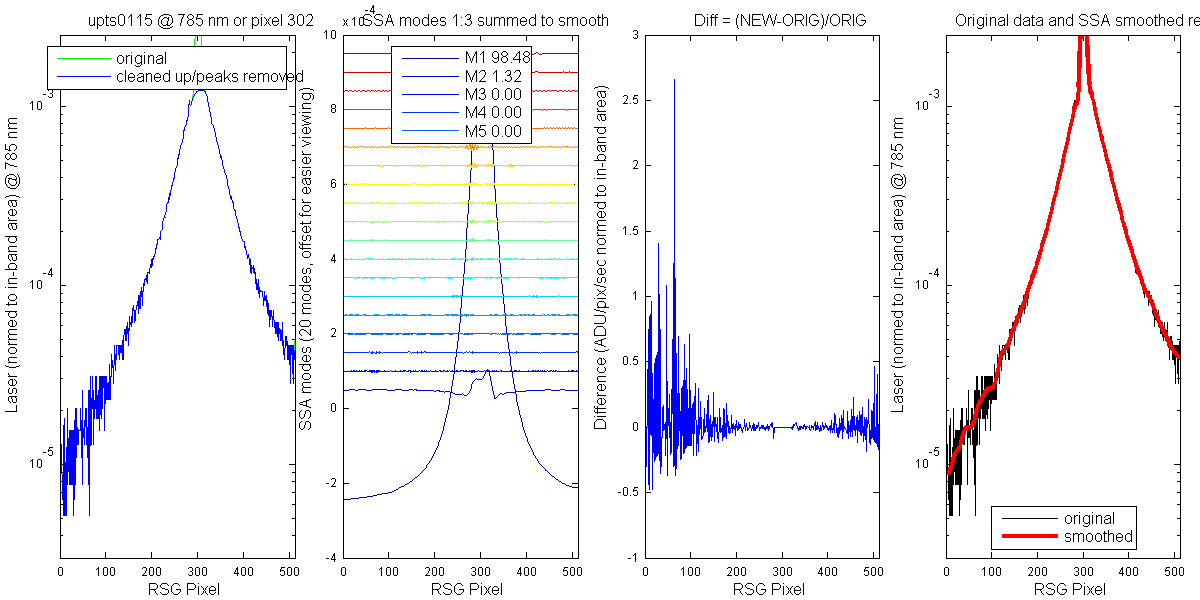
Figure 33
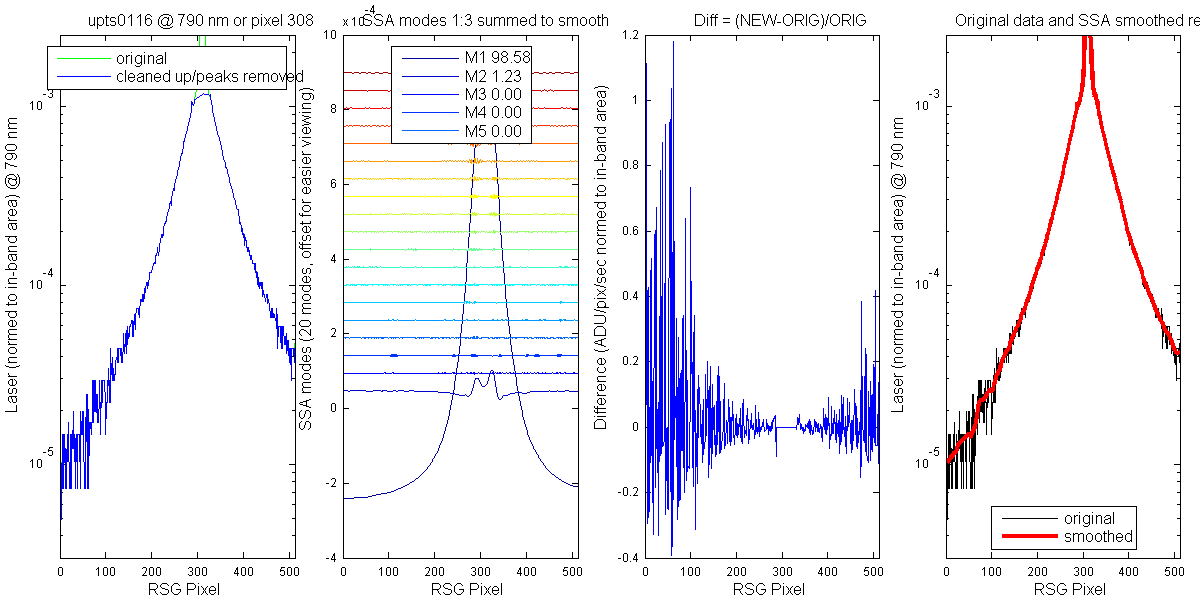
Figure 34
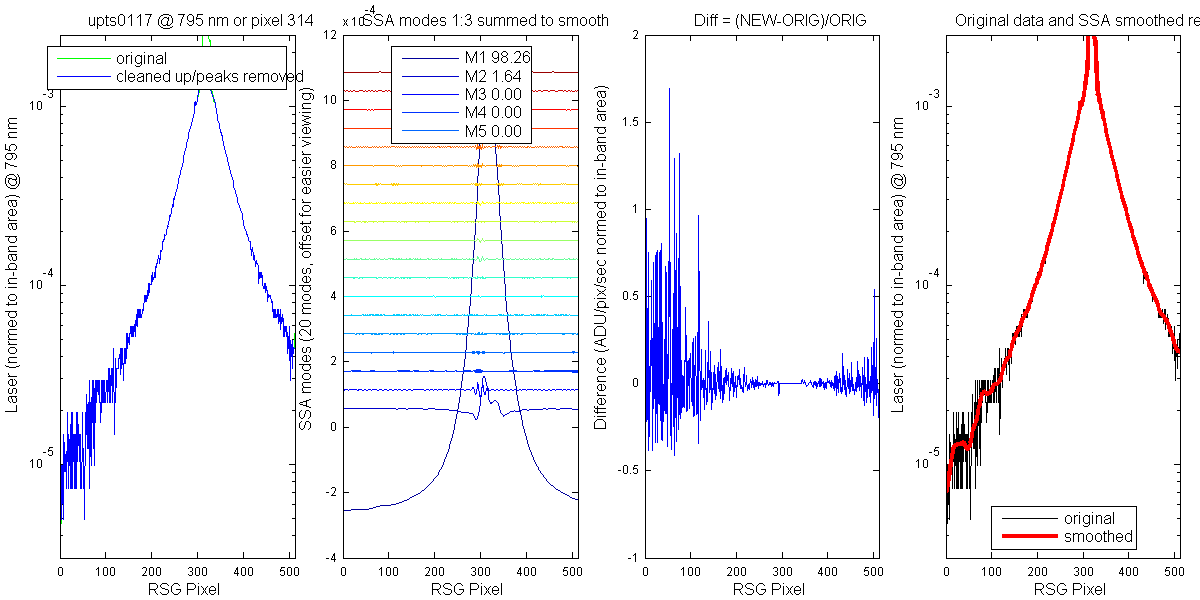
Figure 35
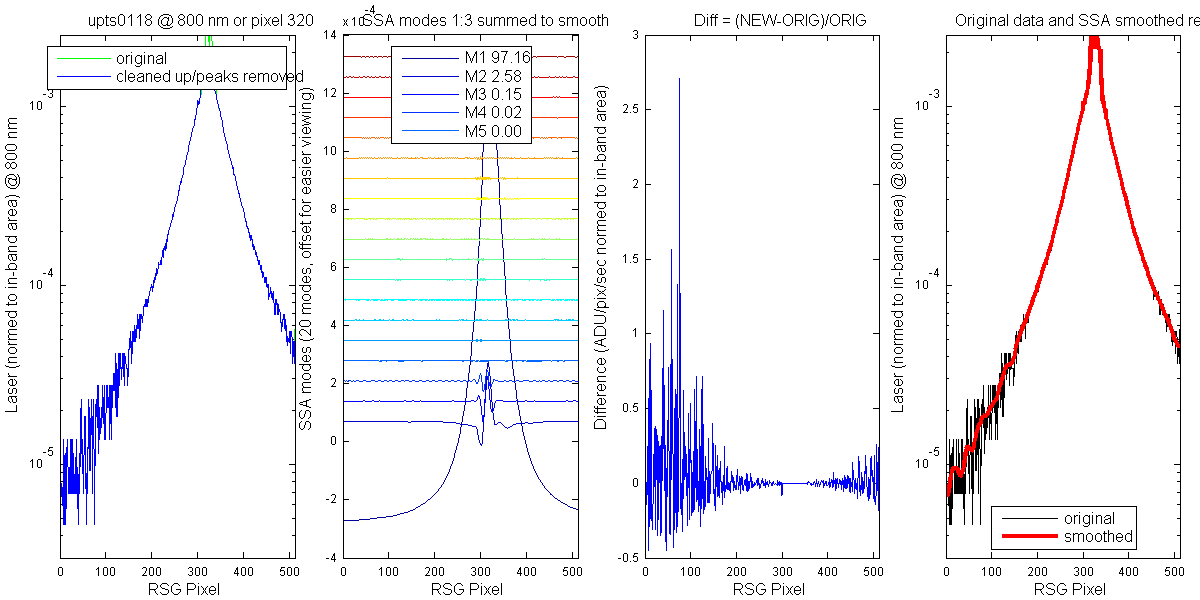
Figure 36
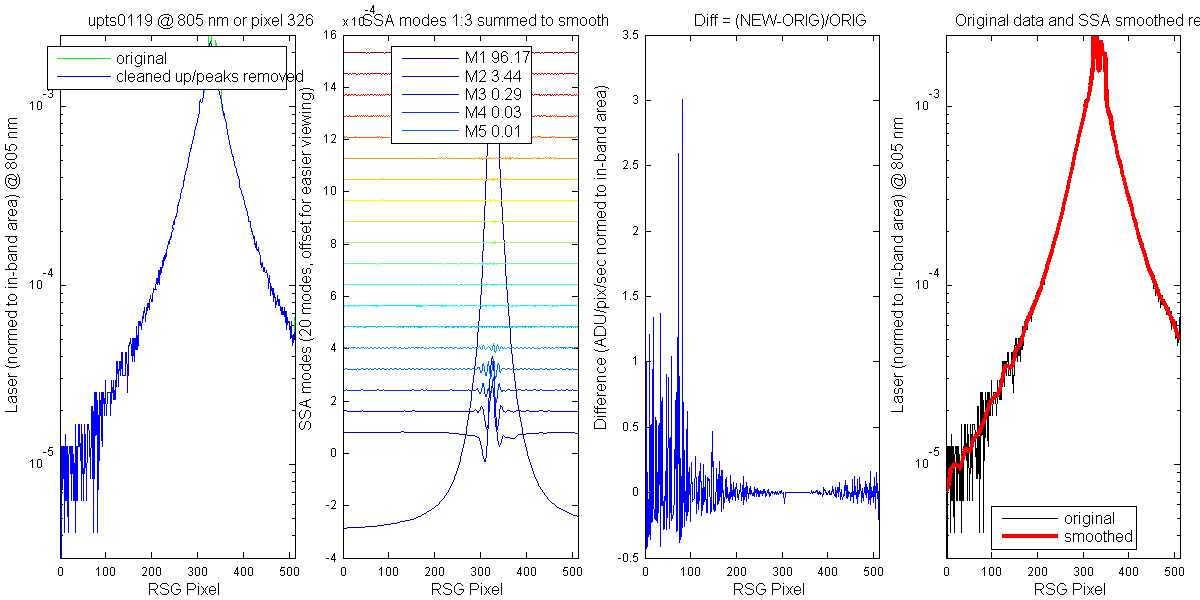
Figure 37
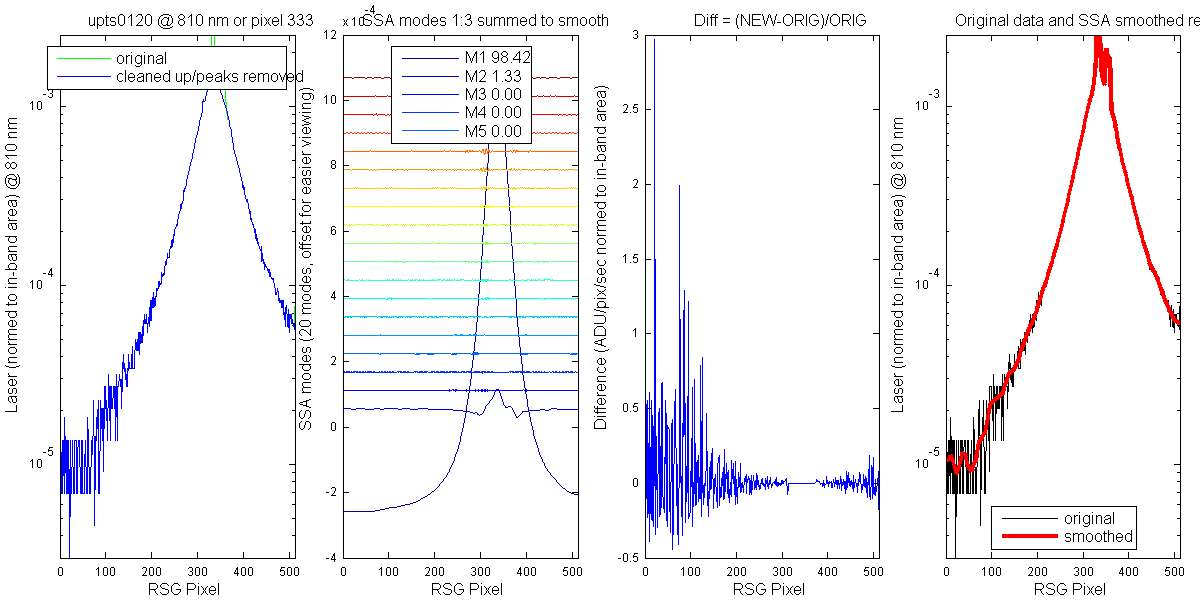
Figure 38

Figure 39
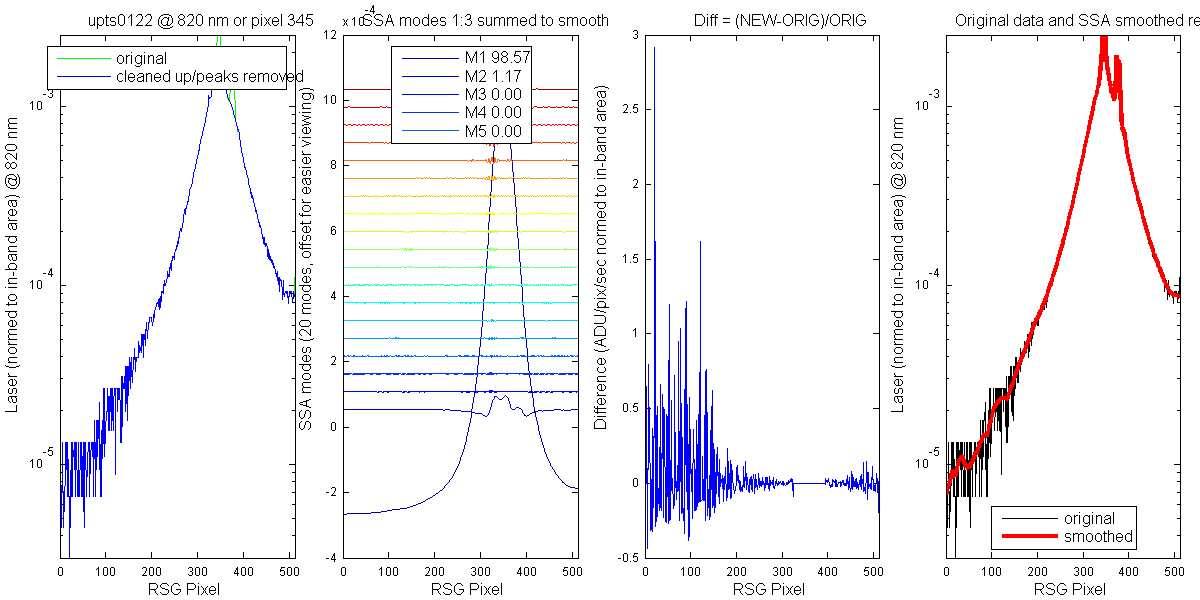
Figure 40
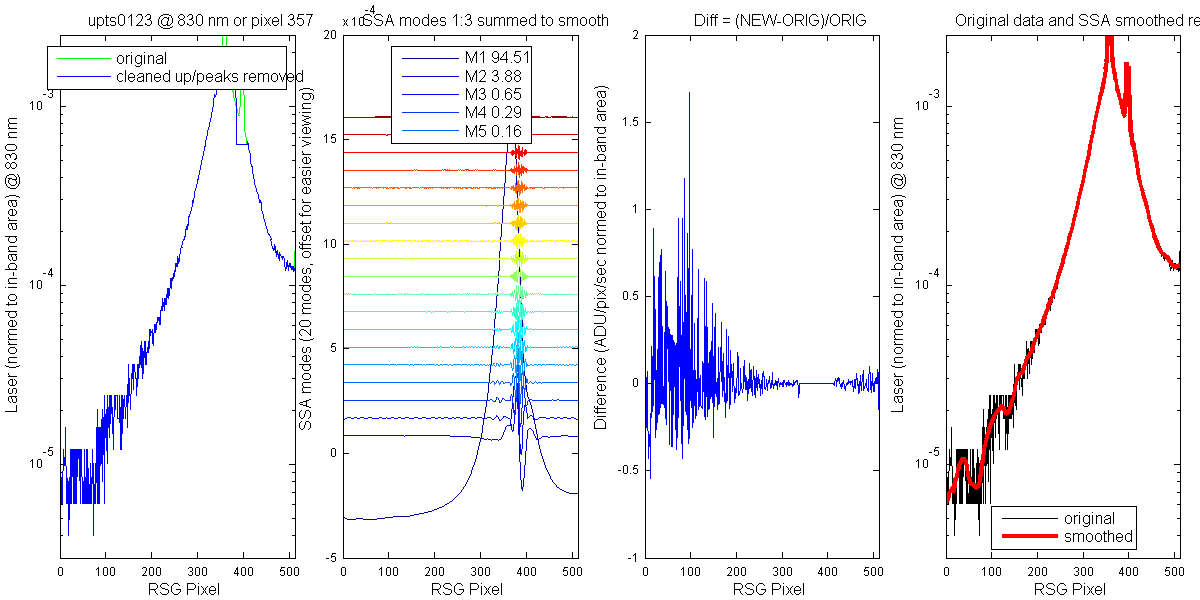
Figure 41
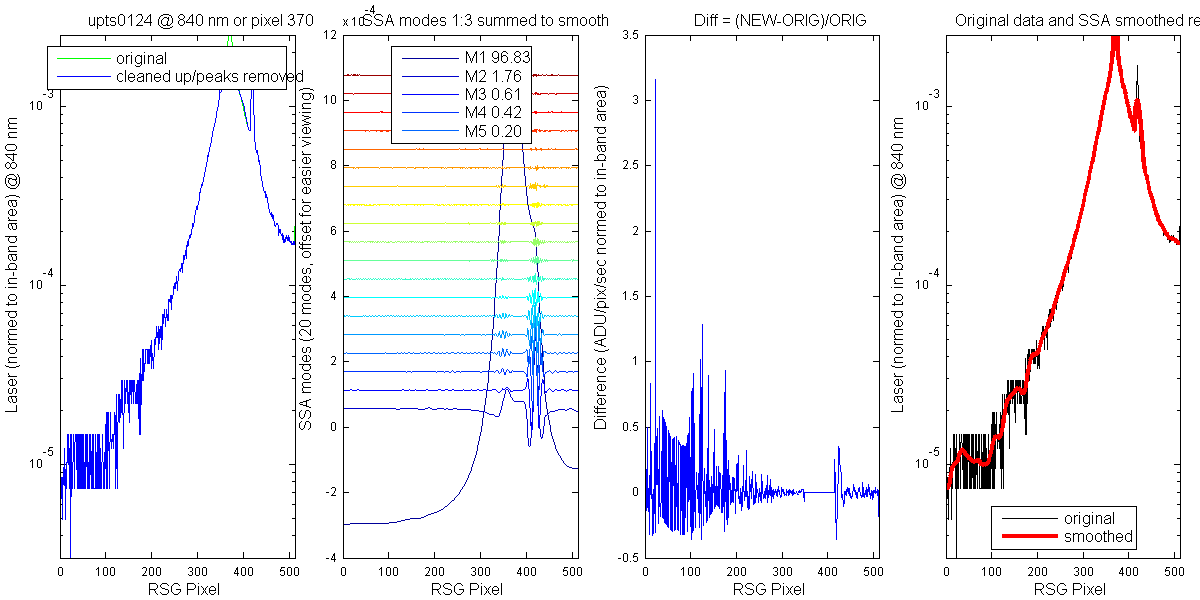
Figure 42
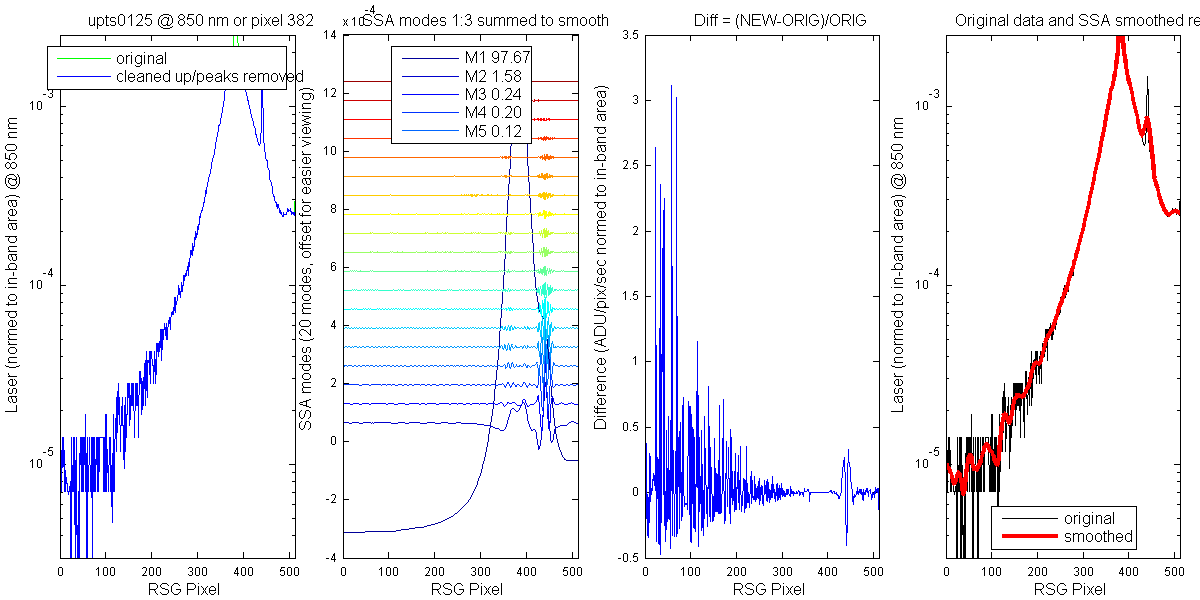
Figure 43
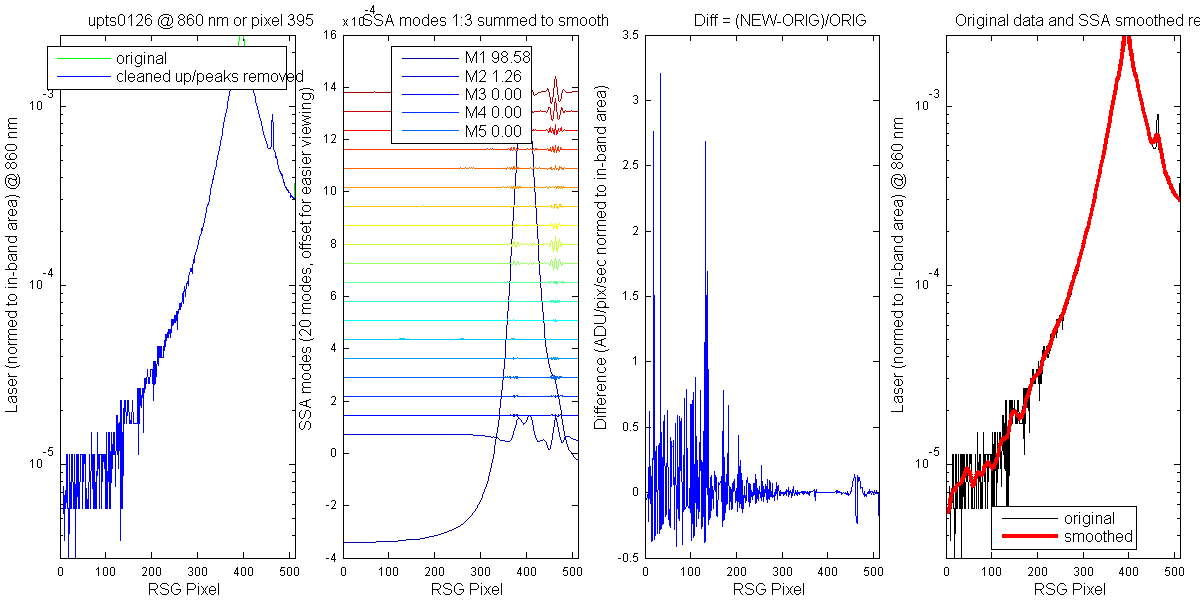
Figure 44
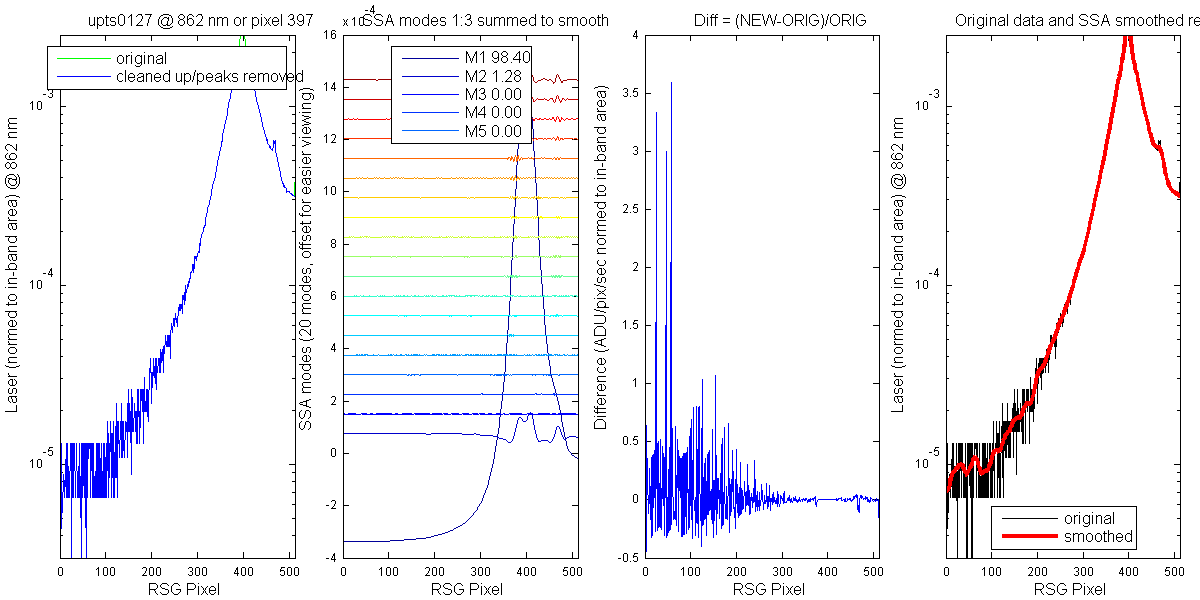
Figure 45
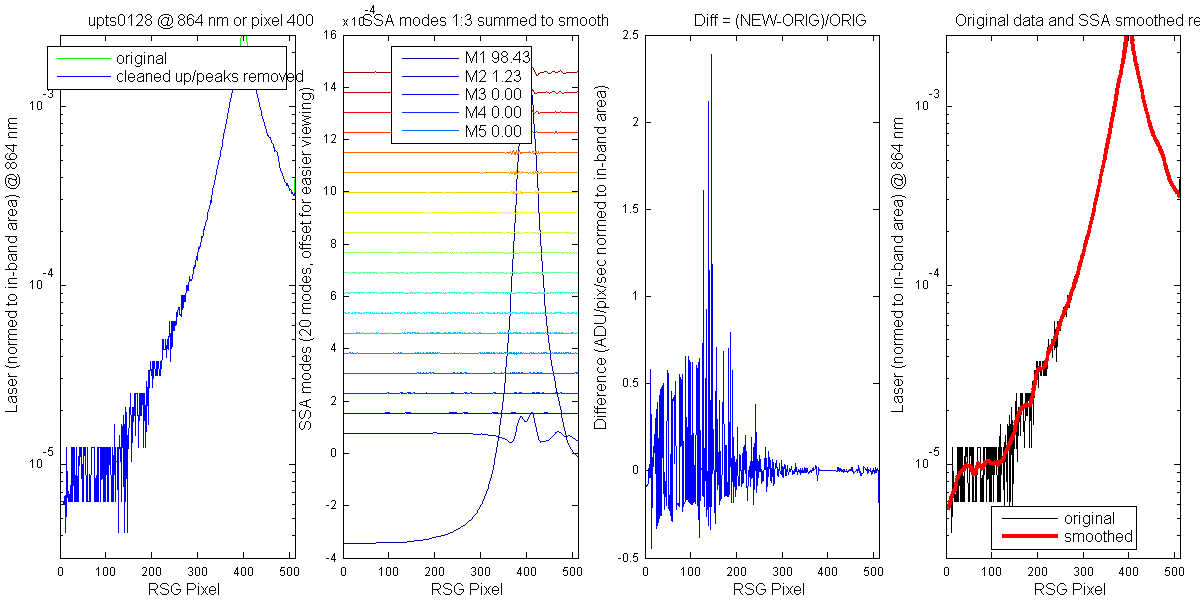
Figure 46
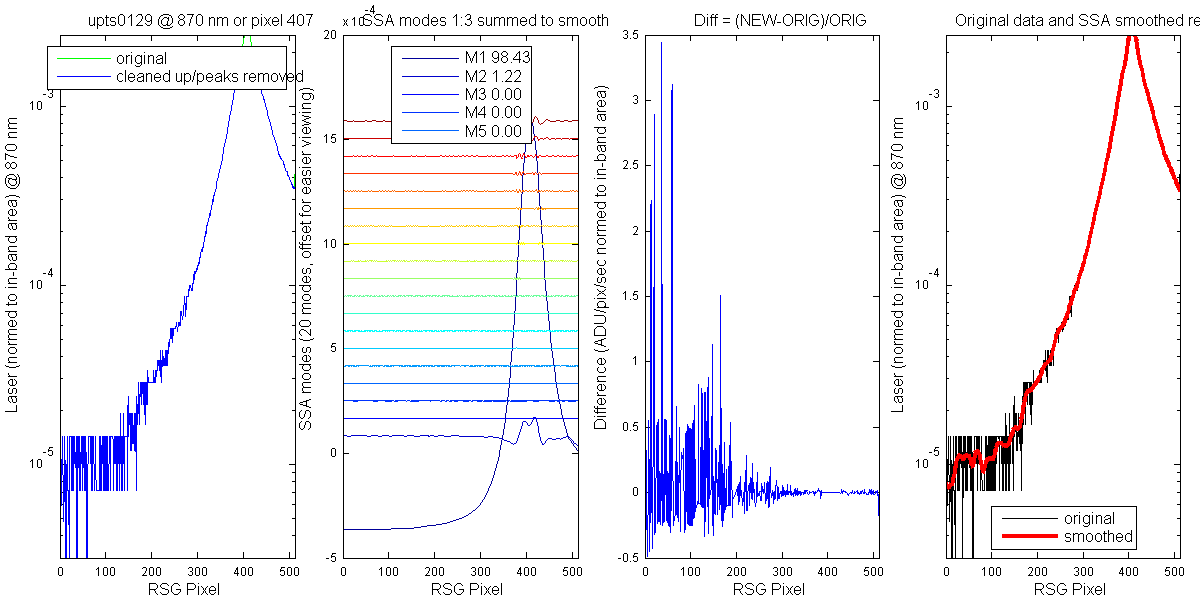
Figure 47

Figure 48
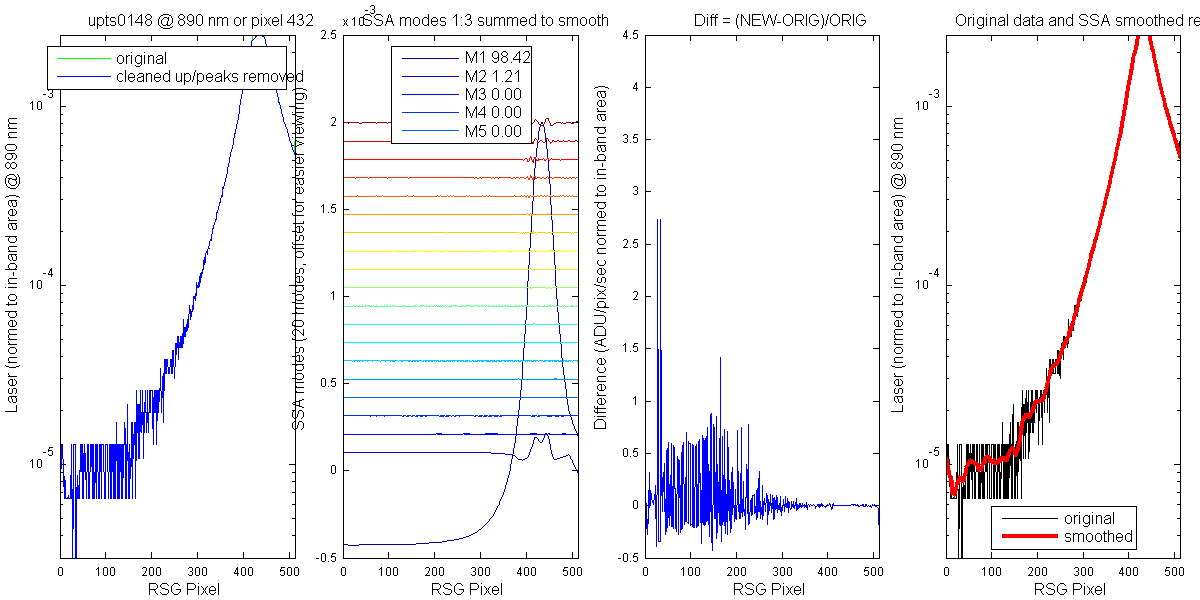
Figure 49
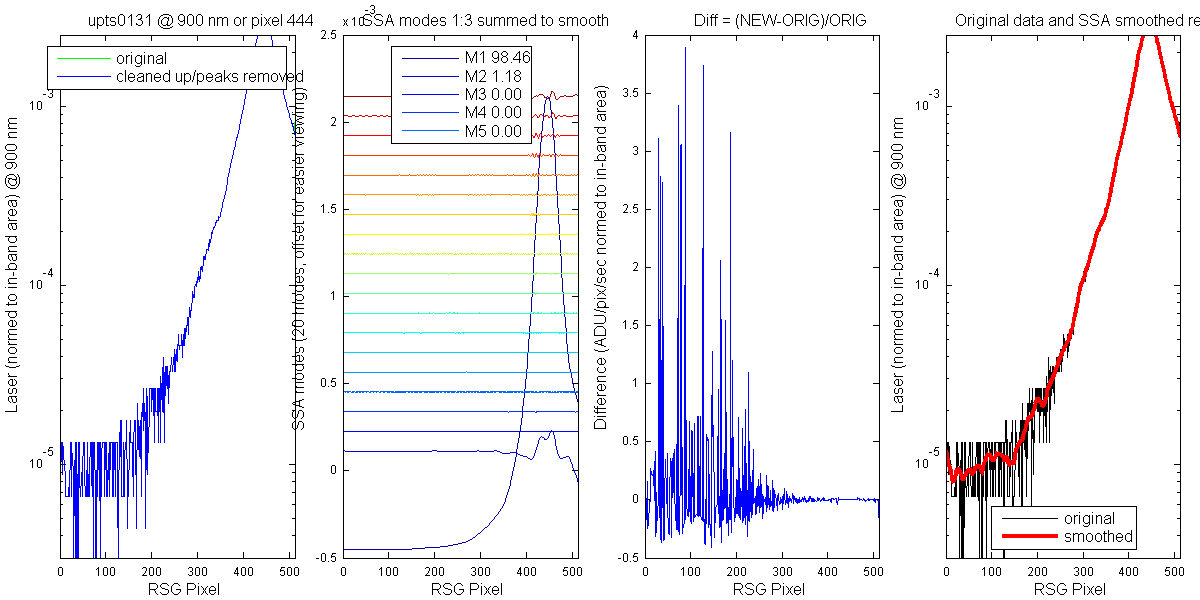
Figure 50
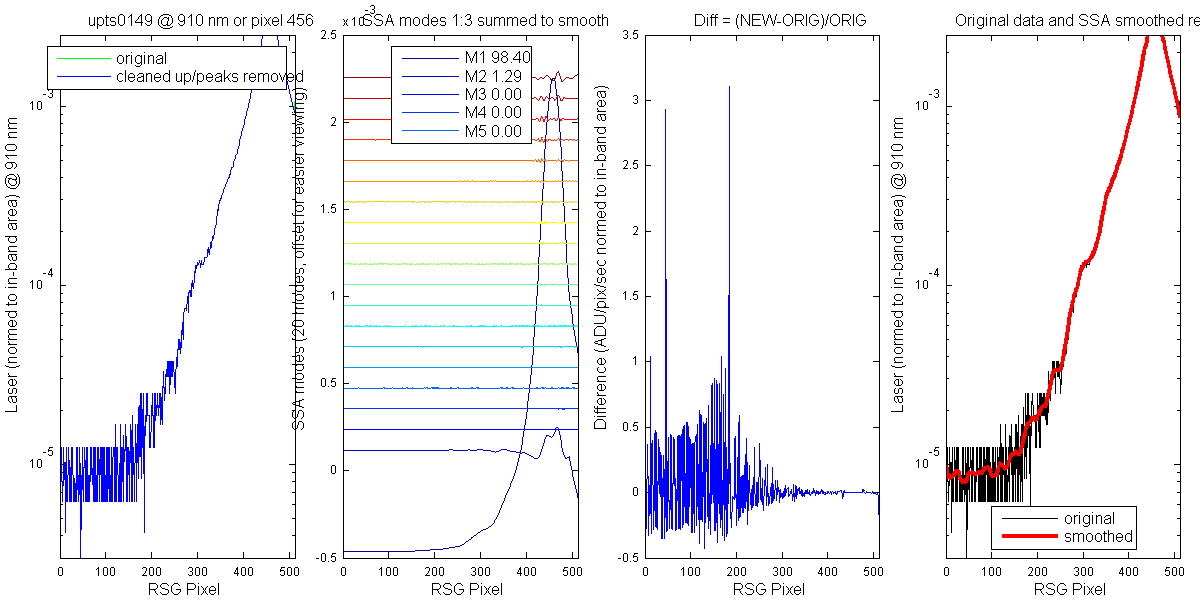
Figure 51
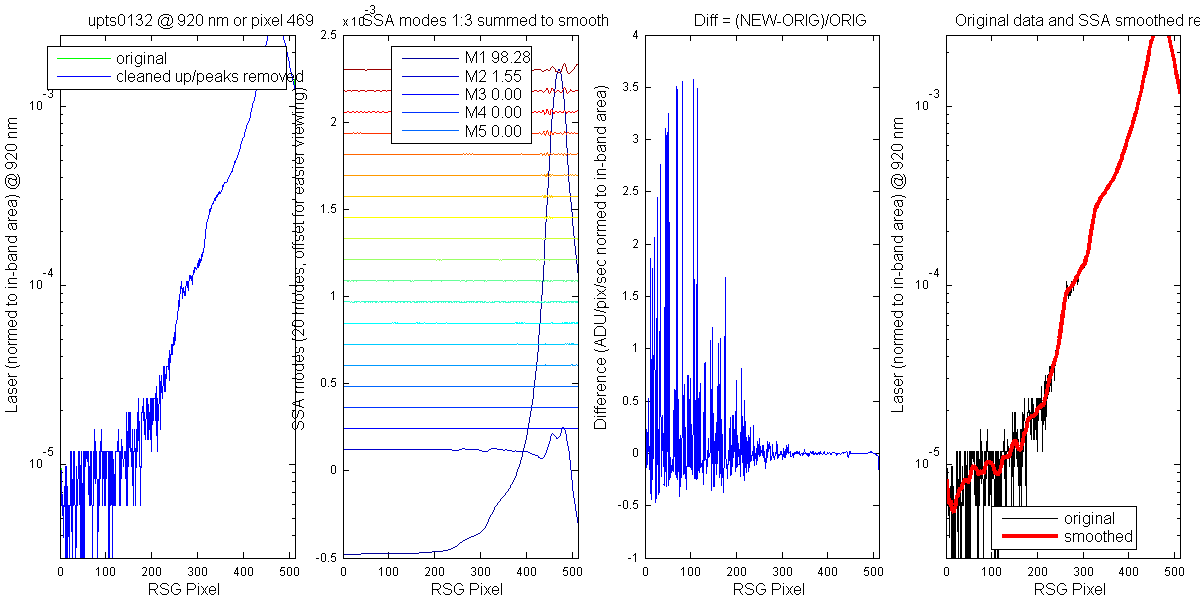
Figure 52
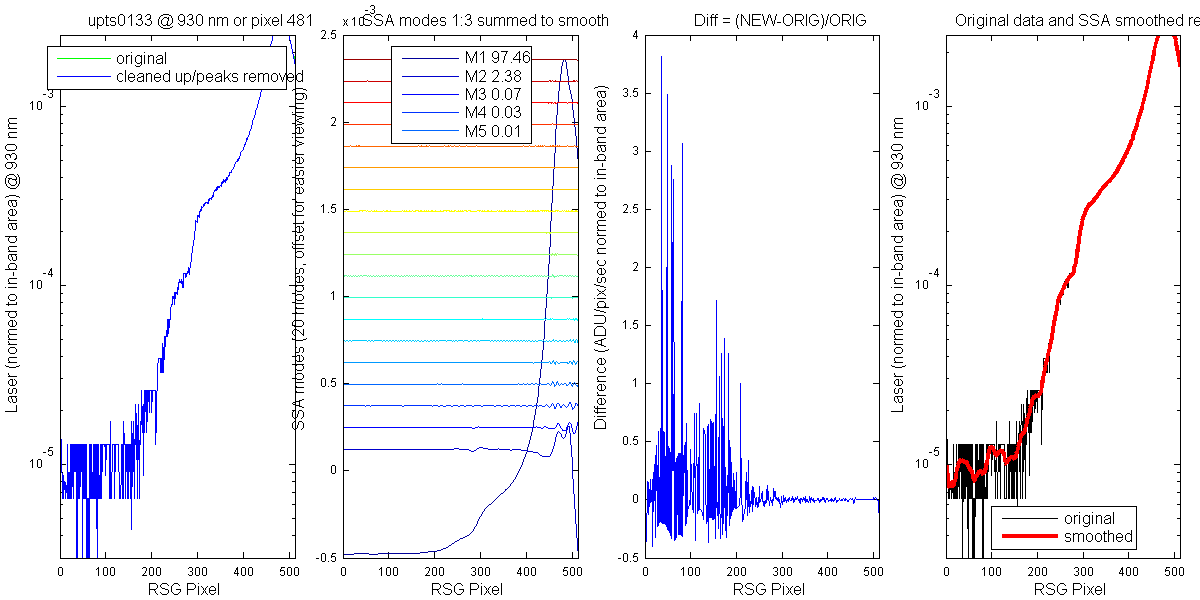
Figure 53
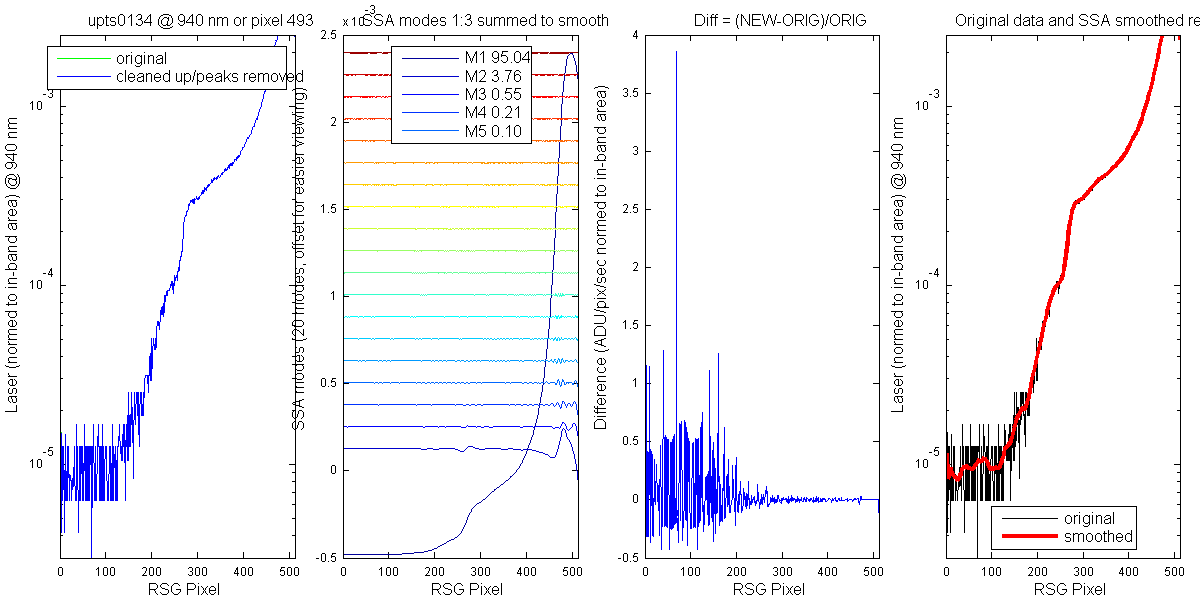
Figure 54
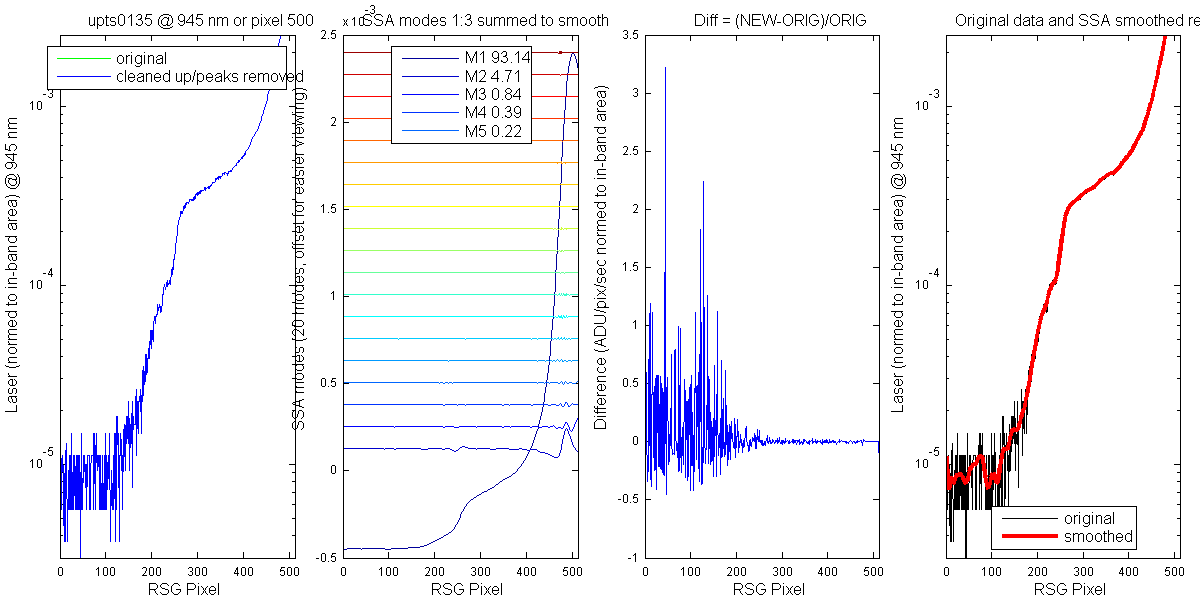
Figure 55