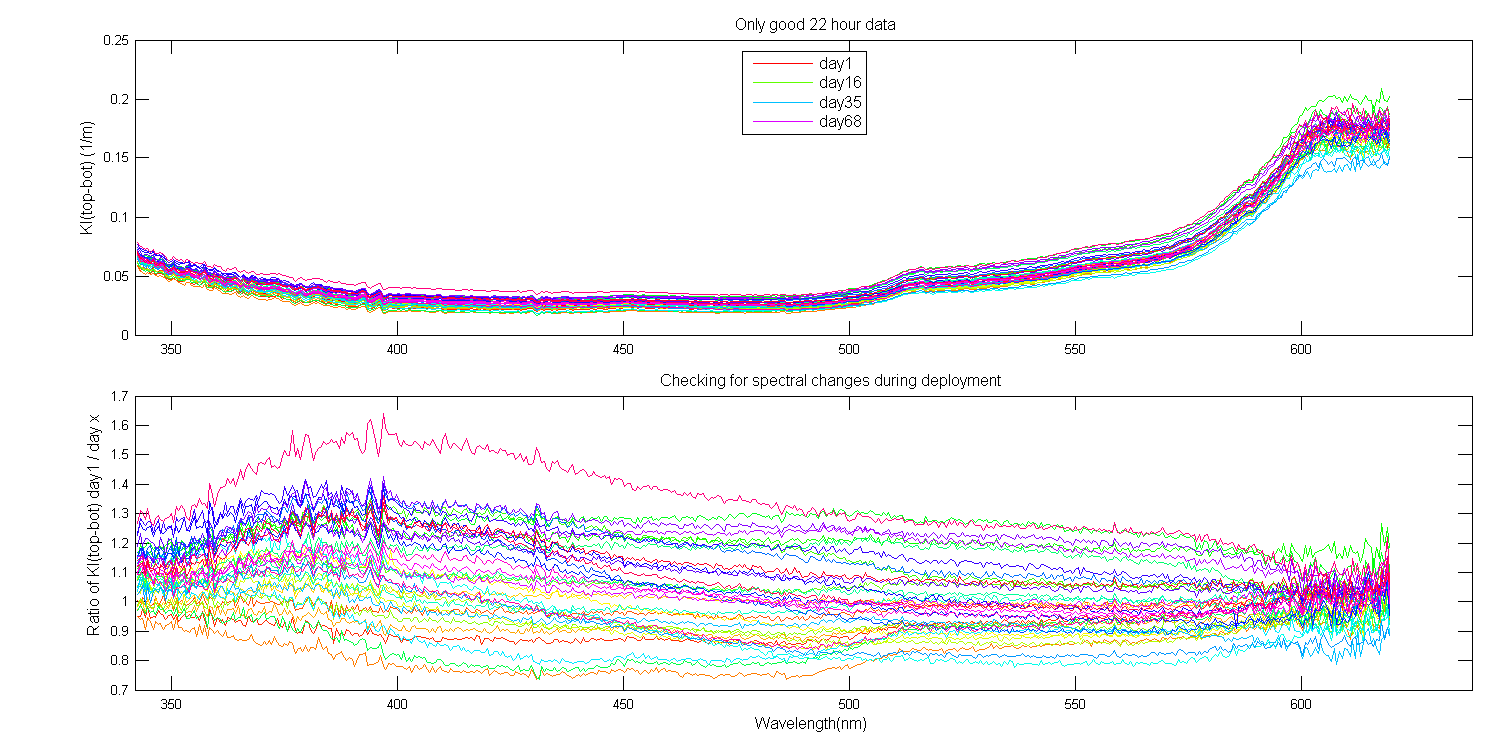
SECTION 1:These plots are just quick check to make sure Kl(top,bot) looks good. These are for 22 hour good data only. Top axes is all the Kl data (The legend shows a subset of days from the start of the deployment and gives you some idea of the days the colors represent). The bottom axes shows the ratio relative to day one. All looks good to me.
Figure 1
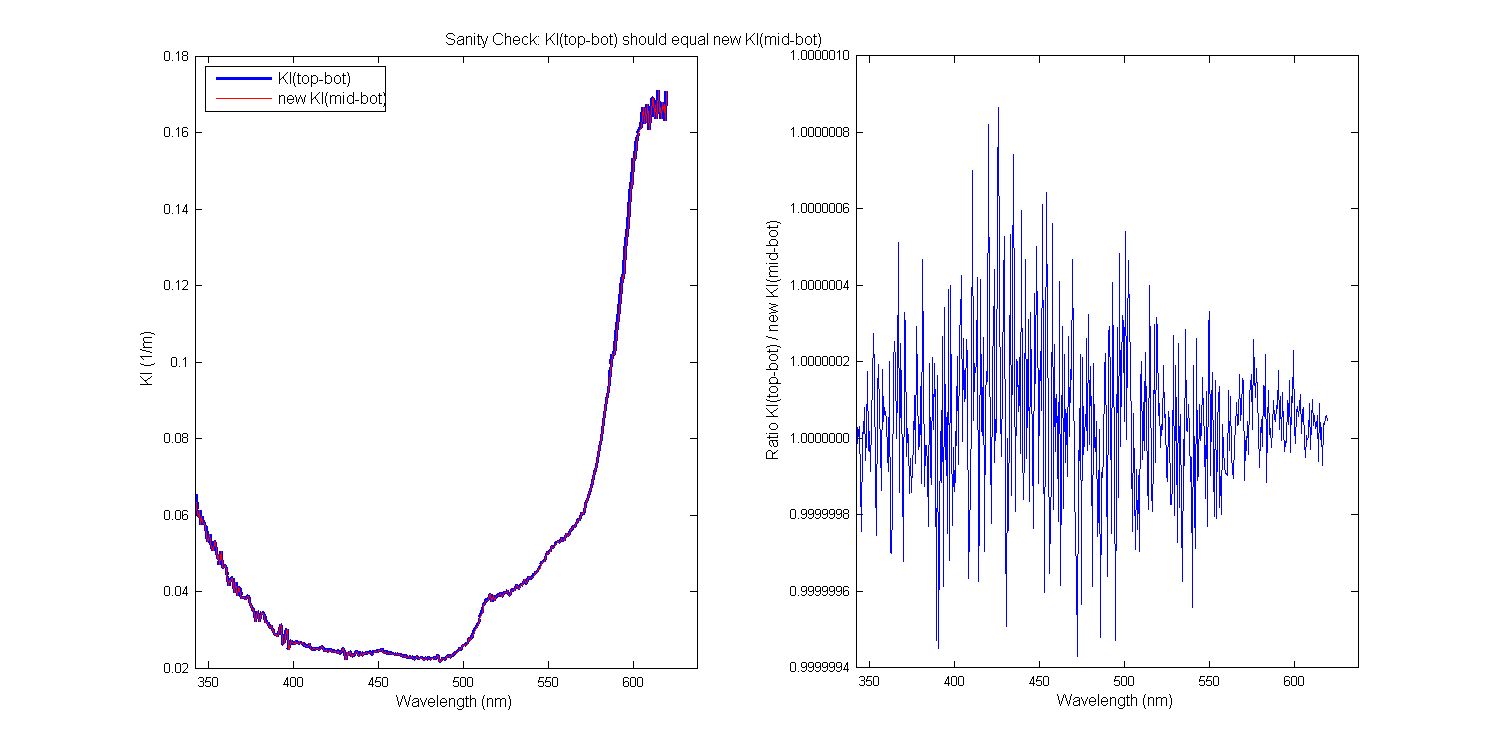
SECTION 2:This is the sanity check section, The images below show the equations used to calculate the new LuMid. The figure below shows the math was done correctly and that KL2 does equal KL3. Yea. Note I only calculate a new LuMid for the blue spectrograph.
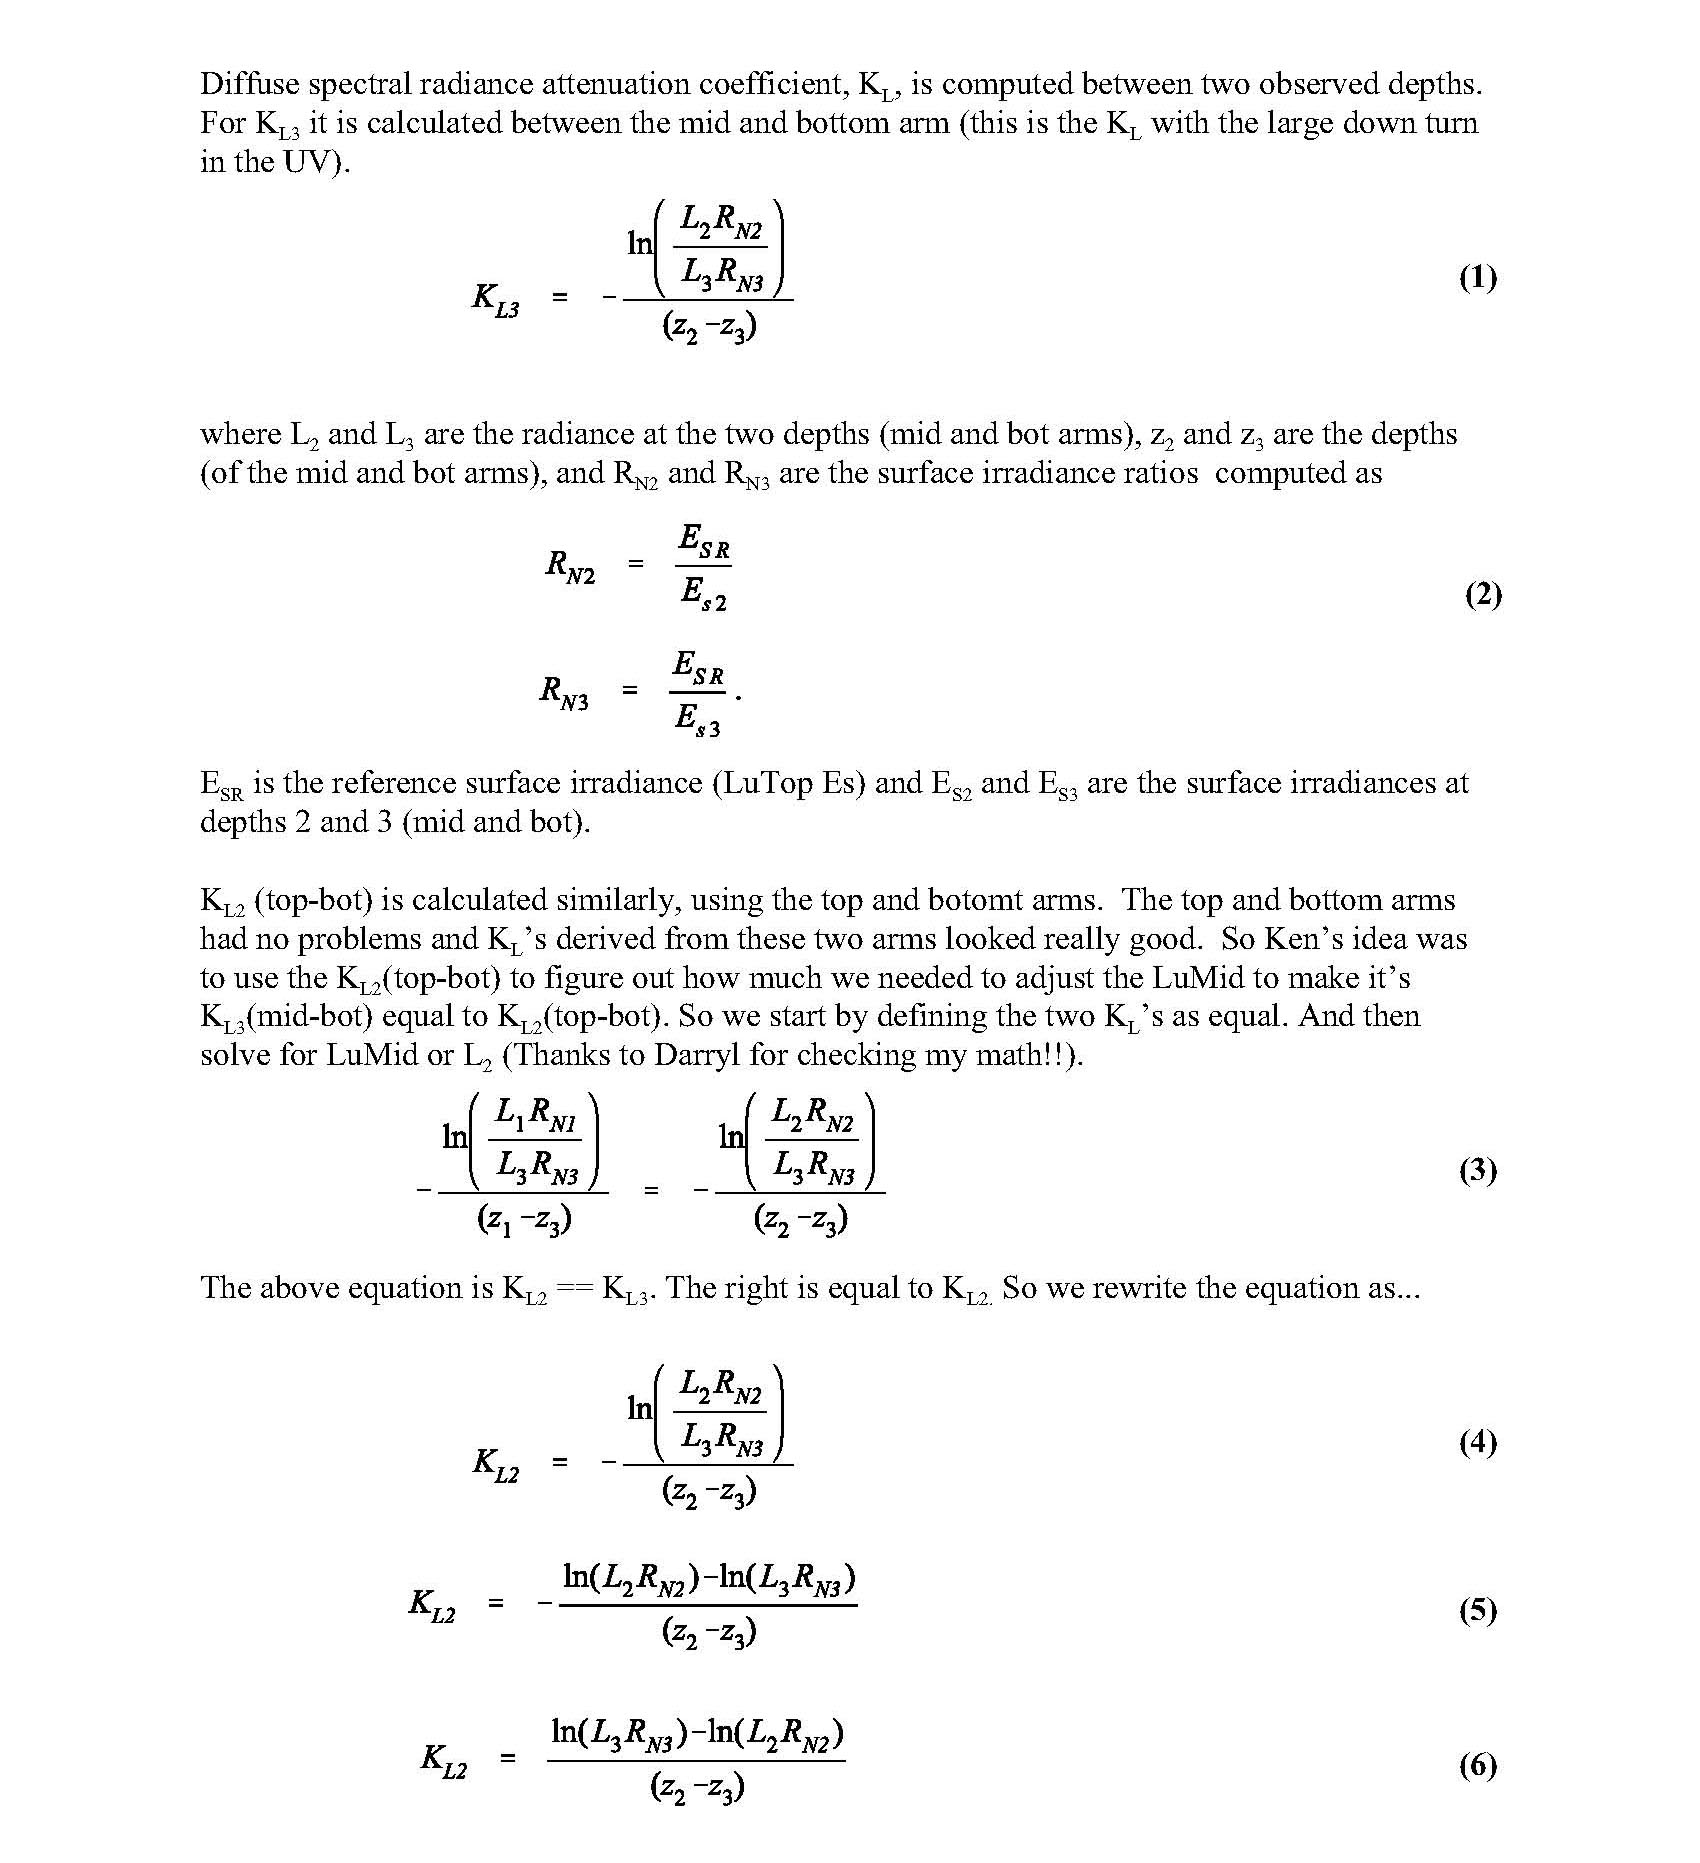
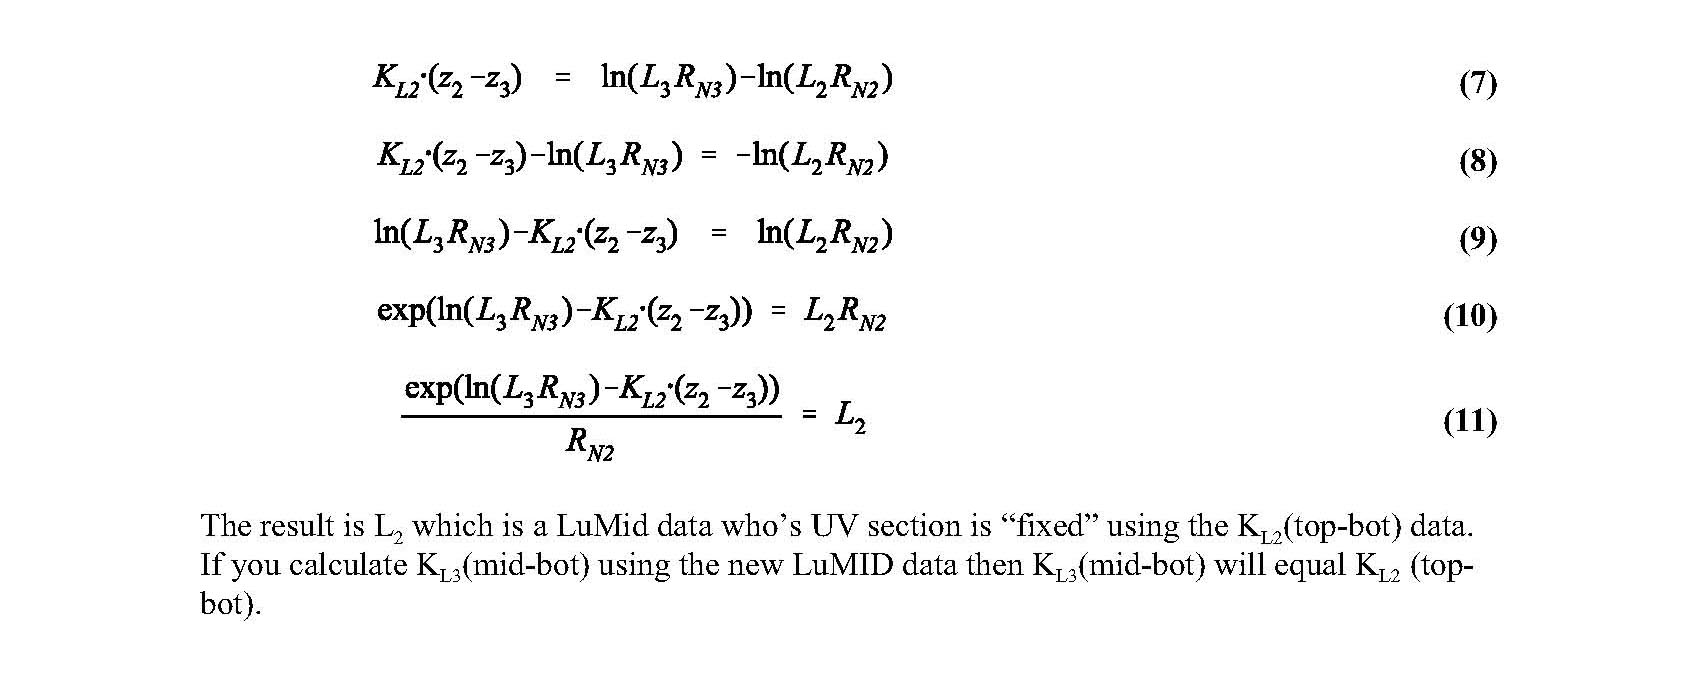
Figure 2
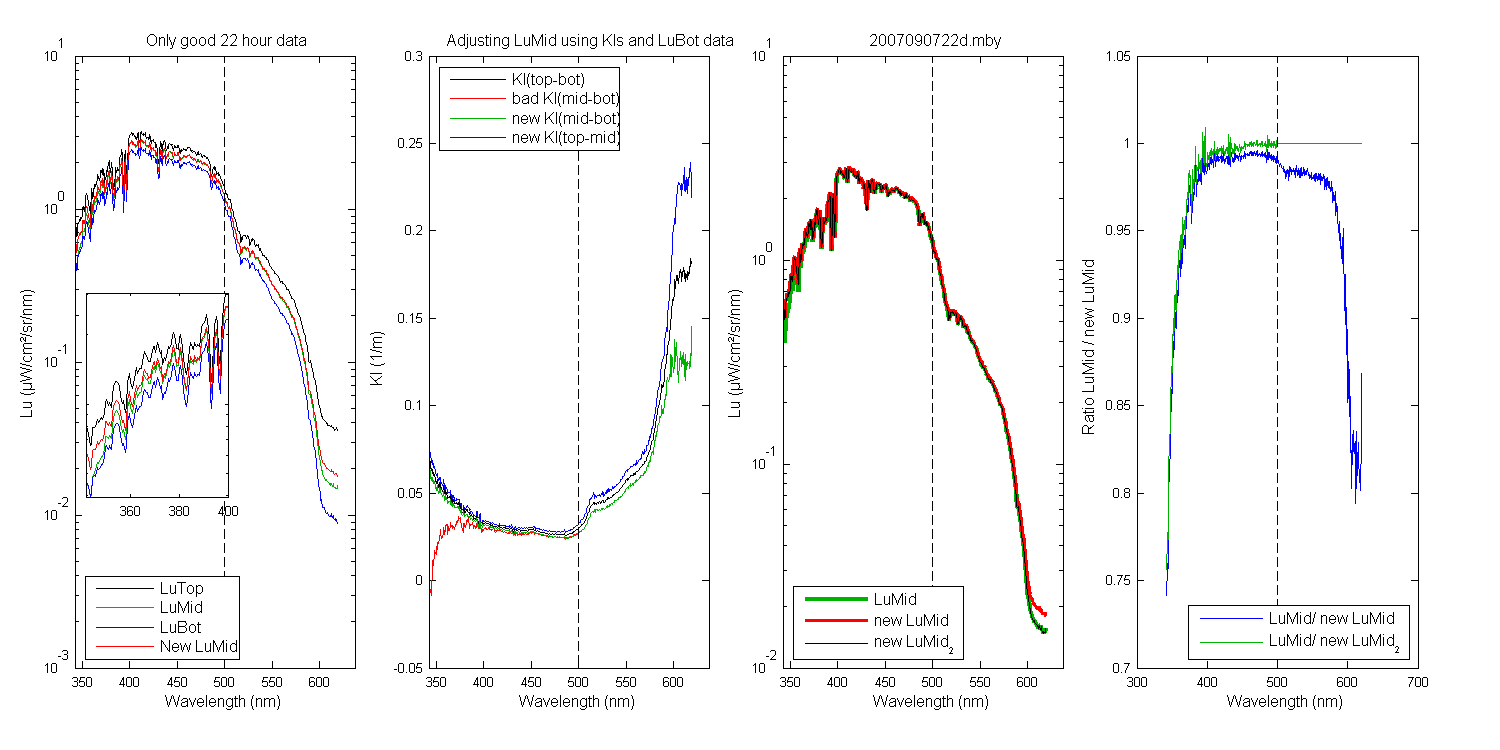
SECTION 3: In this section we apply the new LuMid data. The rest of the figures below show the data manipulations applied to some good 22 hour data at different points along the deployment.
The first panel shows the 3 Lu's and the one new LuMid data (red). The dashed black line is at 500 nm. The inset axes lets you see the improvement in the UV for the new LuMid. The new LuMid was calculated using Equation 11 above.
At this point I should note that we don't want to just take the new LuMid and overwrite the old LuMid data. This is because the new LuMid is not correct on the red side of the blue spec. So I need to select a wavelength which I know does not have the UV problem, 500 nm seemed safe so that is the stiching together point. I then adjusted the new LuMid (up or down) to match the measured LuMid at 500 and then overwrote the old data with the adjusted new LuMid data for those pixels. KEN EMAIL: on changing from 520 nm to 500 nm I think it would be better, on your graph, 500 is really basically 1. Also in the spectral graphs of KL, the deviation (I think due to Raman) starts around 500....is definitely there by 520.
KEN VOSS email: I think the reason for the divergence above 500 (500 might be safer) is Raman (we always blame Raman). The reason is, there will be excess upwelling light in the red due to Raman, the effect is bigger the deeper you go. Thus the Ktopbottom will be smaller than the Kmidbottom should be. When you go adjust Lmid so Kmidbottom is same as Ktopbottom, you have made it smaller than it probably should be. WHen Lmid is smaller than it should be, it shows up as Ktopmid being bigger than it should be.......
The second panel shows how the Kl's changed. KL(top-bot) is the Kl which is correct and unchanged throughout this process. You can see the original bad Kl(mid-bot). Once the new LuMid was create, adjusted and merged with the LuMid data, the Kl's were recalculated using the standard equations. The new Kl(mid-bot) is shown and it should be noted is not equal to Kl(top-bot) because of the adjustment of the new LuMid to match the old. The new Kl(top,mid) is also shown. So the adjustment made to LuMid "fixes" the two Kl's calculated from it. When you look at the Kl on the red side you can see when you can not use the new LuMid past 500 nm. The LuMid Kls would be wrong in this area, since the three Kl's diverge on the red side. Using the new Kl for the entire spec would make the LuMid Kls look too much like the top-bot Kl.
The third panel shows the original measured LuMid, the new LuMid and the new LuMid adjusted to match the measured LuMid at 500 nm and merged with the measured LuMid past 500 nm.
The fourth panel shows the ratio of the measured LuMid to the new LuMid (no adjustment) and the adjusted/merged new LuMid_2. You can see how spectrally different measured and new LuMid are on the red side of the spec (blue line). After adjusting/merging you can see only the blue/UV side of the spec was changed (green line).
Figure 3
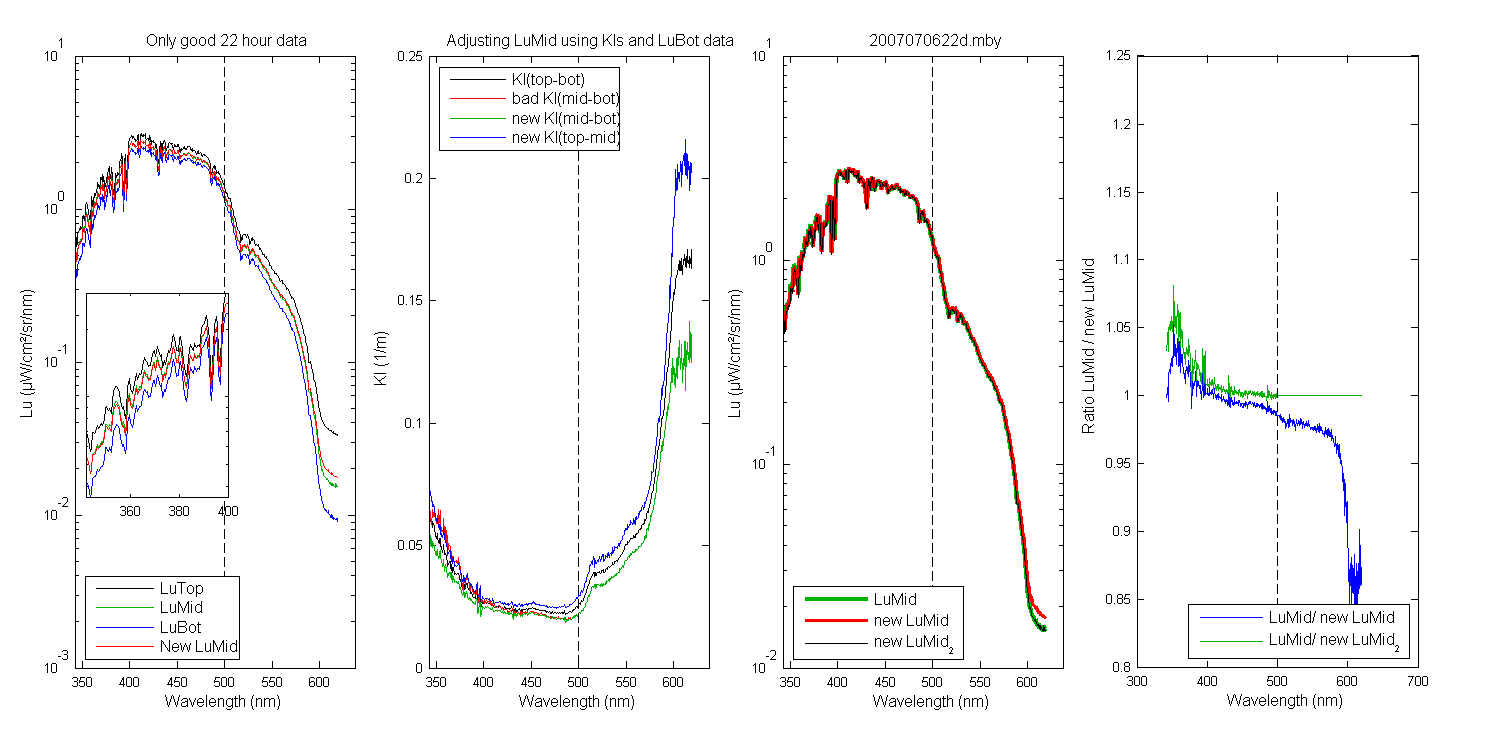
Figure 4
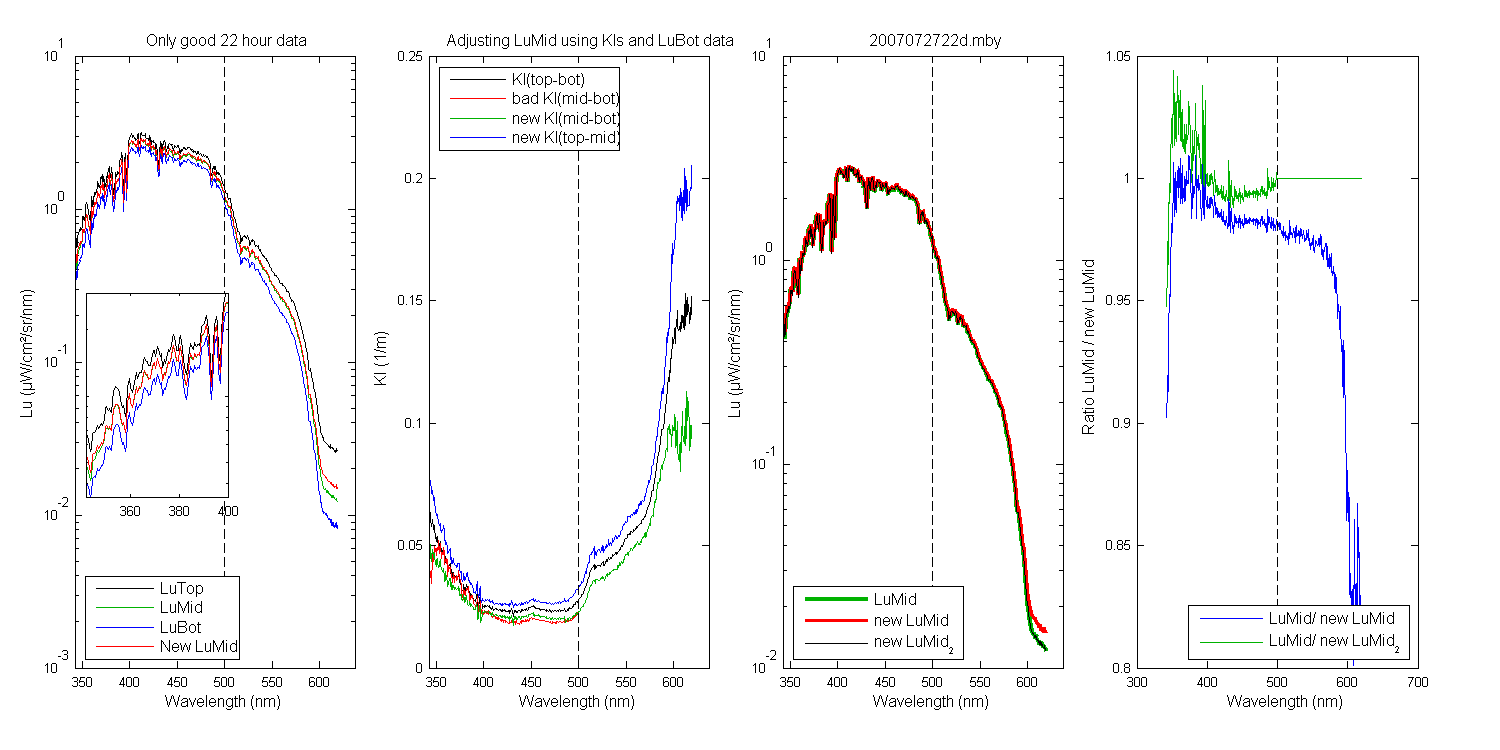
Figure 5
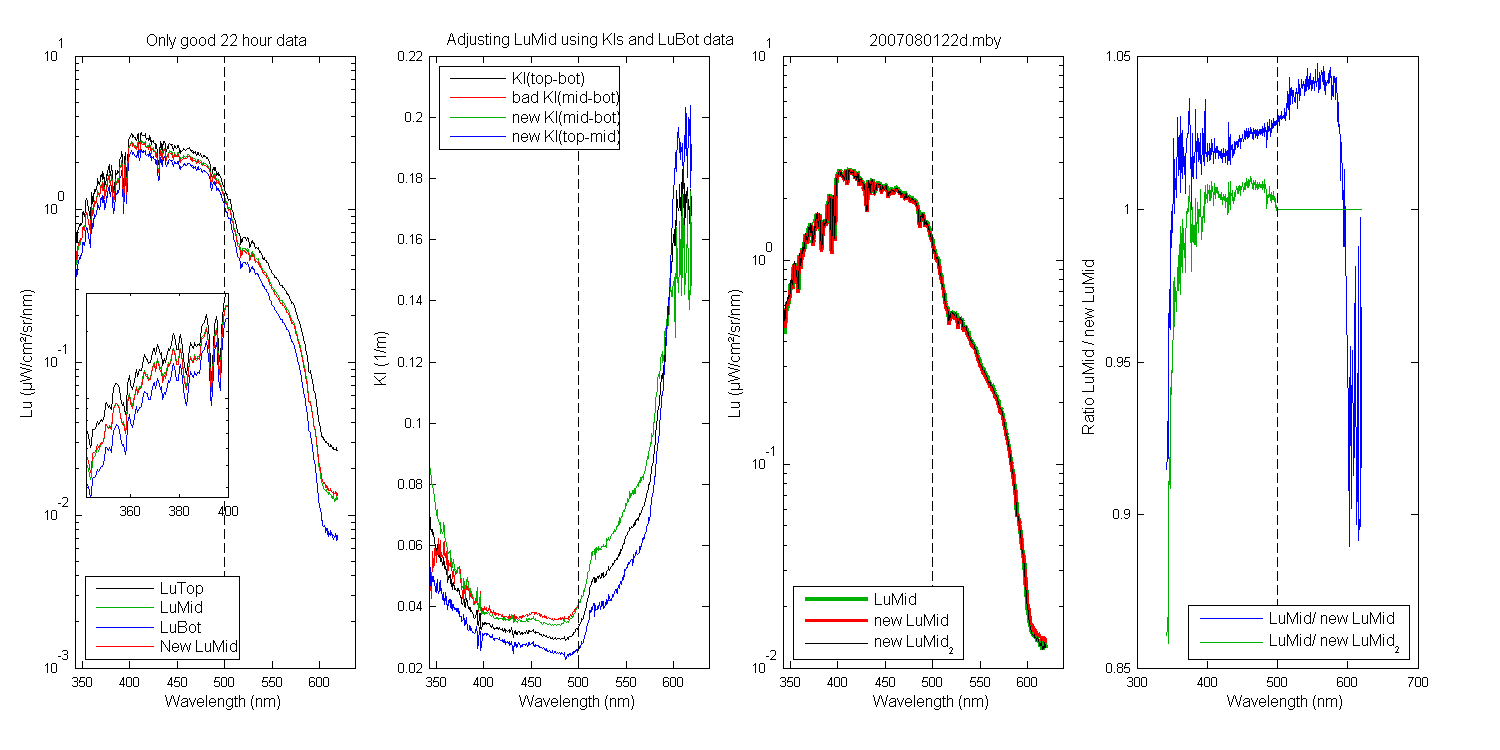
Figure 6
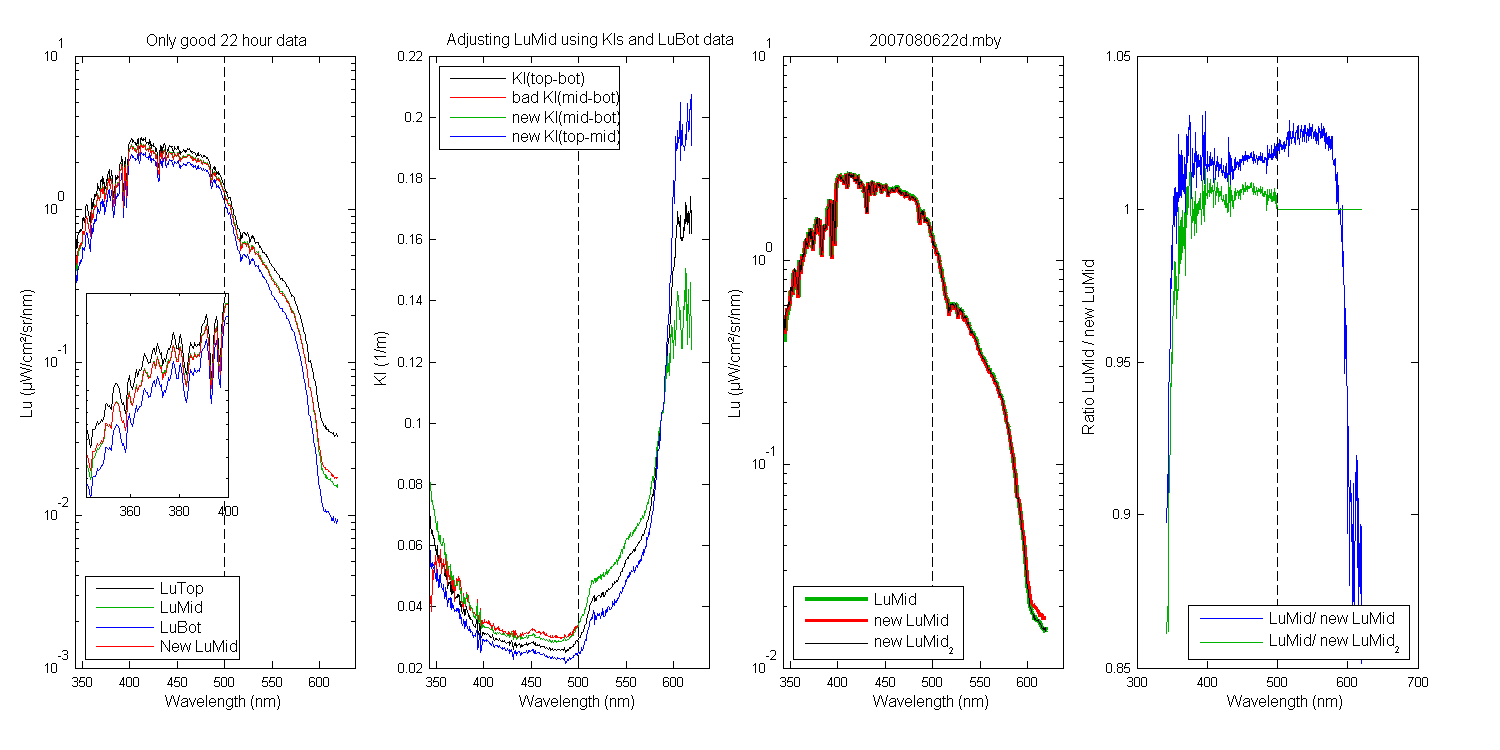
Figure 7
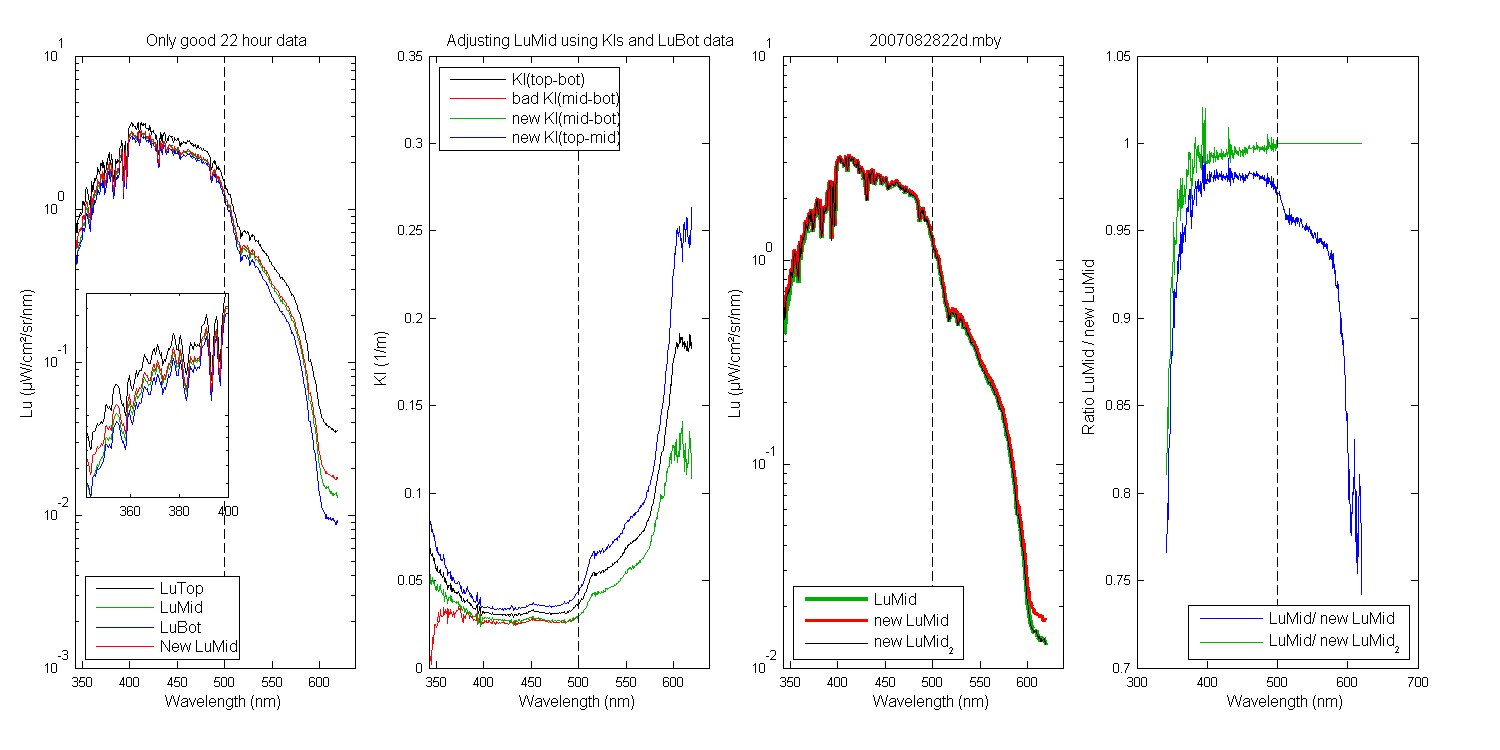
Figure 8
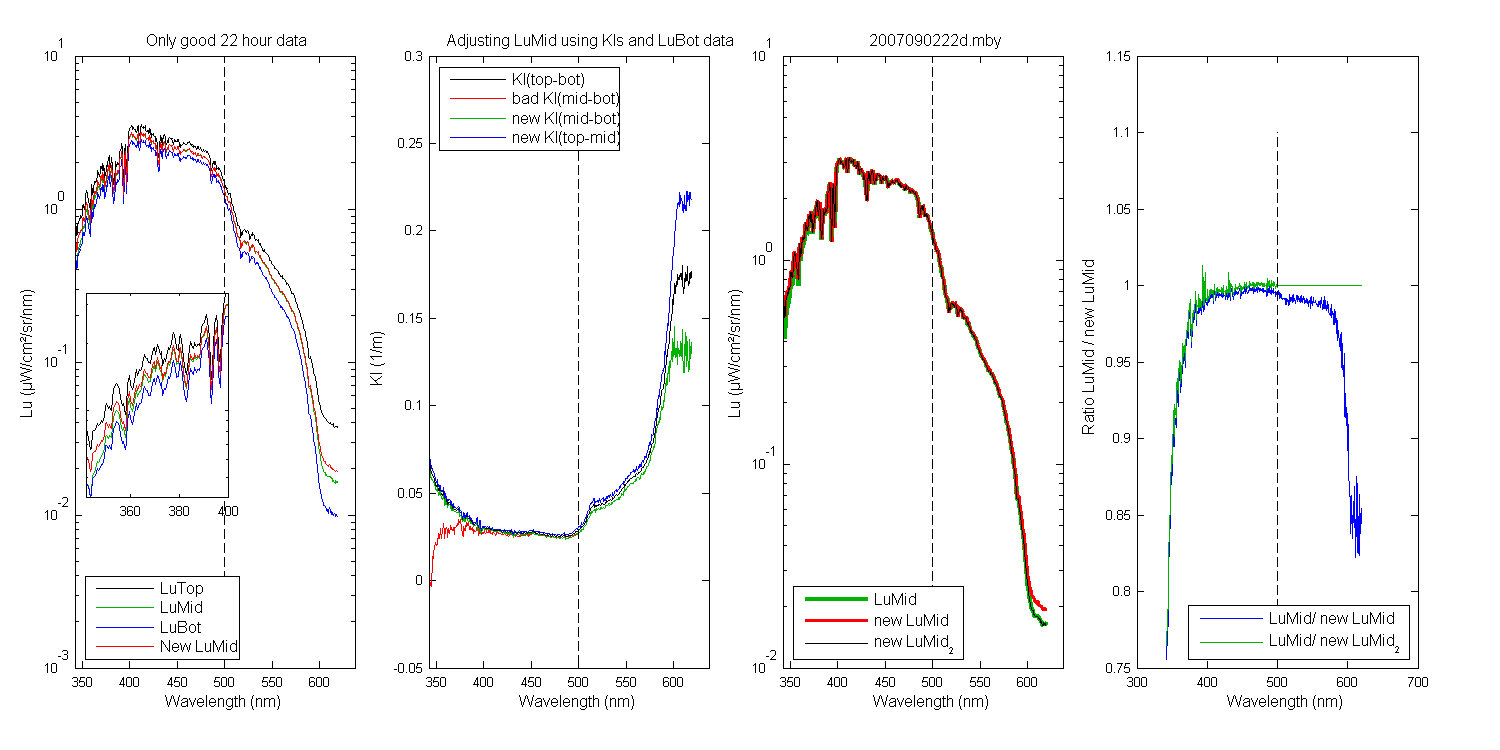
Figure 9
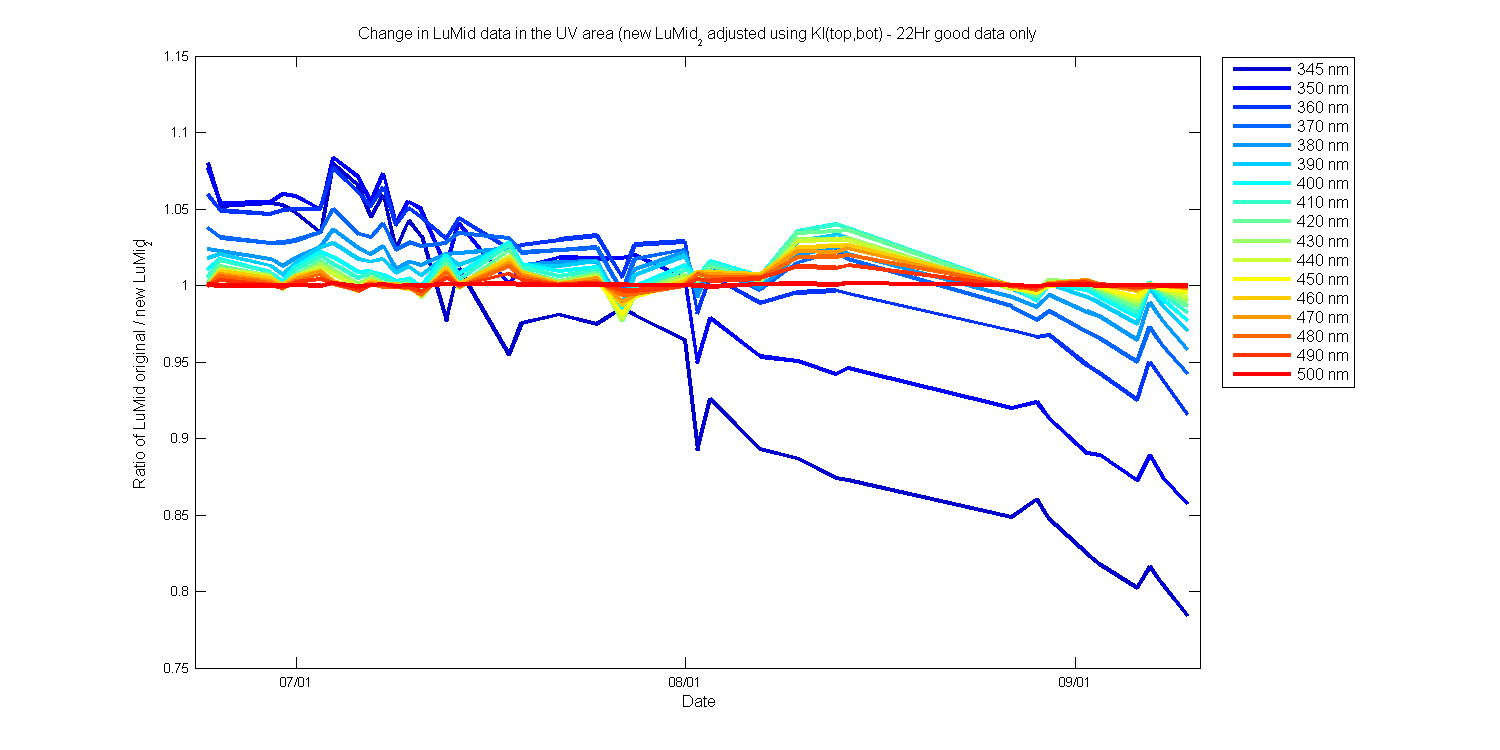
SECTION 4: This shows a plot of the ratio of the original LuMid data divided by the new LuMid_2 (adjusted at 500 nm and merged with the orig LuMid). These are much smoother than the graphs which normalized the data to the first day. Here you Very interesting to see M238 looks like it ended up a little over 20% down at 345 nm and started a little high. Wonder if this is normal?? I should run this on a deployment with no problem to see how well LuMid can be recreated.
Figure 10
pwd: C:\zflora\mldata\moby\data\moby238\precals
Date: 07-Jul-2011 09:26:03
Created from M238_pltlumiduvfix_(1)