REVISION DATE: 25-Jan-2013 12:06:36
This is a repeat of the first least squares fit webpage. Read it for more details. The purpose of this page is to do the same least squares fit but with the first A,IA, aperatures removed. Removing these areatures seem to make very little difference in the fitted values.
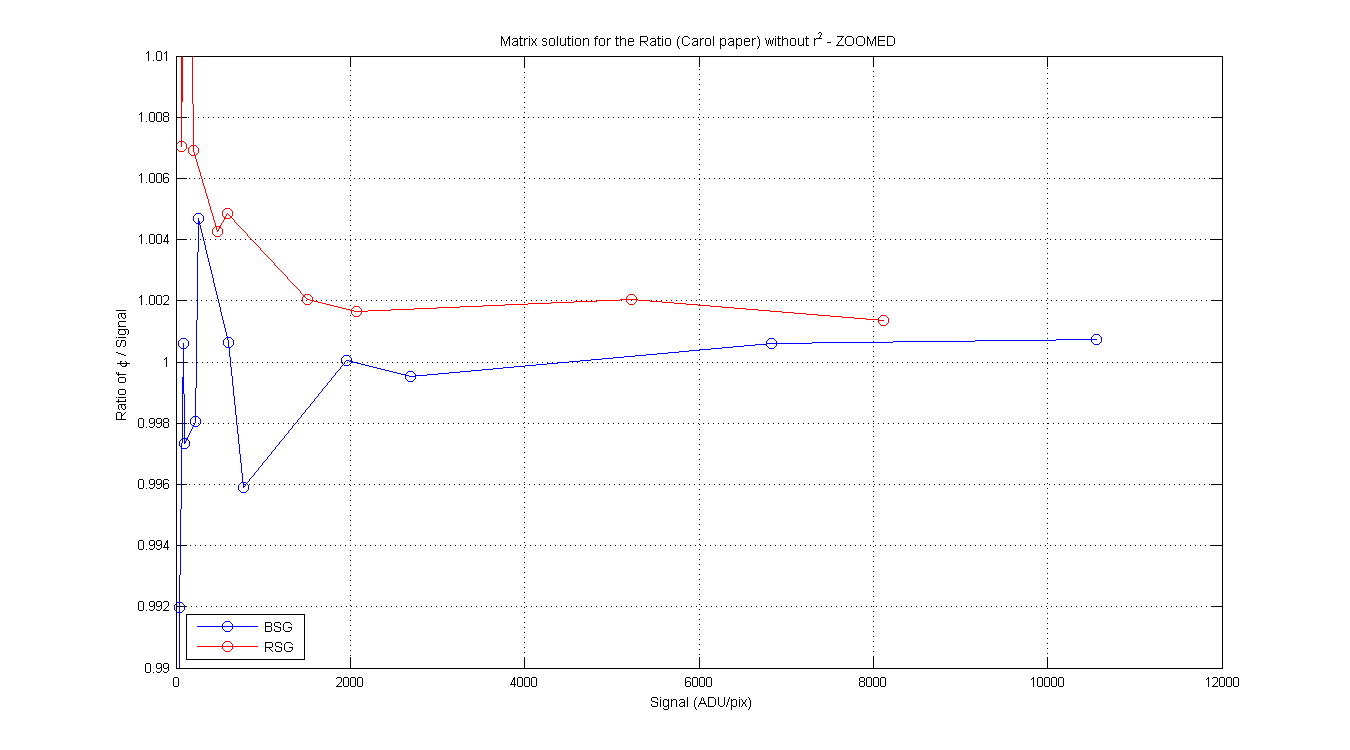
BSG/RSG Table from Carols write-up page 2-3. Column 2 is the RD or S (mean of pixeles around max), column 3 is the φ from the matrix math, column 4 is the residual from Carols paper and Colum 5 is the ratio of φ / signal. Same for the RSG. Each of the columns contains the φ, Residual and ratio with and without the r² in the equations.
r coefficents with r²
BSG r values = [ -2.827 1.5776e-007 ]
RSG r values = [ -0.11103 3.0031e-007 ]
r coefficents without r²
BSG r values = [ 0.2789 ]
RSG r values = [ 3.3882 ]
| BSG | RSG | ||||||||
|---|---|---|---|---|---|---|---|---|---|
| Aperature | RD or S | φ (w r² / wo r²) | Residual-Y (w r² / wo r²) | Ratio (w r² / wo r²) | Aperature | RD or S | φ (w r² / wo r²) | Residual-Y (w r² / wo r²) | Ratio (w r² / wo r²) |
| I | 10.401 | 6.085/ 8.332 | -1.489/ -2.348 | 0.585/ 0.801 | I | 7.380 | 7.955/ 10.487 | 0.686/ -0.281 | 1.078/ 1.421 |
| IB | 38.552 | 1.489/ 2.348 | IB | 35.982 | -0.687/ 0.281 | ||||
| B | 35.433 | 31.129/ 32.847 | -1.477/ -2.865 | 0.879/ 0.927 | B | 27.234 | 27.231/ 29.165 | 0.108/ -1.456 | 1.000/ 1.071 |
| JB | 68.227 | -0.015/ 0.517 | JB | 53.095 | 0.576/ 1.175 | ||||
| J | 36.468 | 34.257/ 36.176 | 0.615/ -0.571 | 0.939/ 0.992 | J | 27.831 | 26.330/ 28.492 | -1.390/ -2.727 | 0.946/ 1.024 |
| JC | 120.728 | -0.607/ 0.054 | JC | 92.200 | 0.807/ 1.552 | ||||
| C | 84.834 | 83.040/ 84.885 | 1.031/ -0.228 | 0.979/ 1.001 | C | 68.168 | 66.569/ 68.648 | -1.490/ -2.909 | 0.977/ 1.007 |
| KC | 183.640 | -0.442/ 0.174 | KC | 142.607 | 0.663/ 1.357 | ||||
| K | 99.472 | 97.337/ 99.208 | 0.690/ -0.543 | 0.979/ 0.997 | K | 77.432 | 76.597/ 78.705 | -0.727/ -2.116 | 0.989/ 1.016 |
| KD | 322.625 | -0.295/ 0.368 | KD | 252.982 | 0.009/ 0.759 | ||||
| D | 224.501 | 222.182/ 224.064 | 0.500/ -0.716 | 0.990/ 0.998 | D | 176.293 | 176.303/ 178.424 | 0.112/ -1.257 | 1.000/ 1.012 |
| LD | 479.711 | -0.326/ 0.348 | LD | 374.793 | -0.263/ 0.499 | ||||
| L | 255.078 | 254.411/ 256.273 | 2.150/ 0.916 | 0.997/ 1.005 | L | 198.883 | 198.158/ 200.256 | -0.626/ -2.015 | 0.996/ 1.007 |
| LE | 862.354 | -2.152/ -1.264 | LE | 668.435 | 0.512/ 1.516 | ||||
| E | 604.707 | 603.082/ 605.096 | 1.144/ 0.110 | 0.997/ 1.001 | E | 471.080 | 470.811/ 473.083 | -0.224/ -1.385 | 0.999/ 1.004 |
| ME | 1370.766 | 0.065/ 1.154 | ME | 1069.223 | -1.376/ -0.131 | ||||
| M | 770.256 | 765.218/ 767.102 | -2.304/ -3.432 | 0.993/ 0.996 | M | 596.499 | 597.267/ 599.397 | 0.772/ -0.490 | 1.001/ 1.005 |
| MF | 2723.117 | -0.880/ 2.279 | MF | 2105.029 | -2.957/ 0.622 | ||||
| F | 1958.507 | 1955.361/1958.572 | -0.924/ -0.214 | 0.998/ 1.000 | F | 1506.560 | 1506.025/1509.643 | -1.106/ -0.306 | 1.000/ 1.002 |
| NF | 4652.353 | -8.575/ -2.064 | NF | 3584.916 | -7.680/ -0.316 | ||||
| N | 2693.269 | 2689.005/2691.996 | -2.582/ -1.553 | 0.998/ 1.000 | N | 2074.942 | 2074.960/2078.346 | -1.164/ 0.015 | 1.000/ 1.002 |
| NG | 9521.476 | -26.567/ 3.617 | NG | 7314.332 | -33.594/ 0.300 | ||||
| G | 6829.184 | 6817.380/6833.376 | -16.334/ 3.914 | 0.998/ 1.001 | G | 5228.973 | 5221.733/5239.675 | -15.340/ 7.314 | 0.999/ 1.002 |
| OG | 17407.813 | -96.035/ -7.530 | OG | 13377.190 | -107.100/ -7.614 | ||||
| O | 10559.376 | 10539.378/10567.185 | -34.761/ 7.530 | 0.998/ 1.001 | O | 8122.288 | 8101.986/8133.290 | -40.002/ 7.614 | 0.998/ 1.001 |
Figure 1
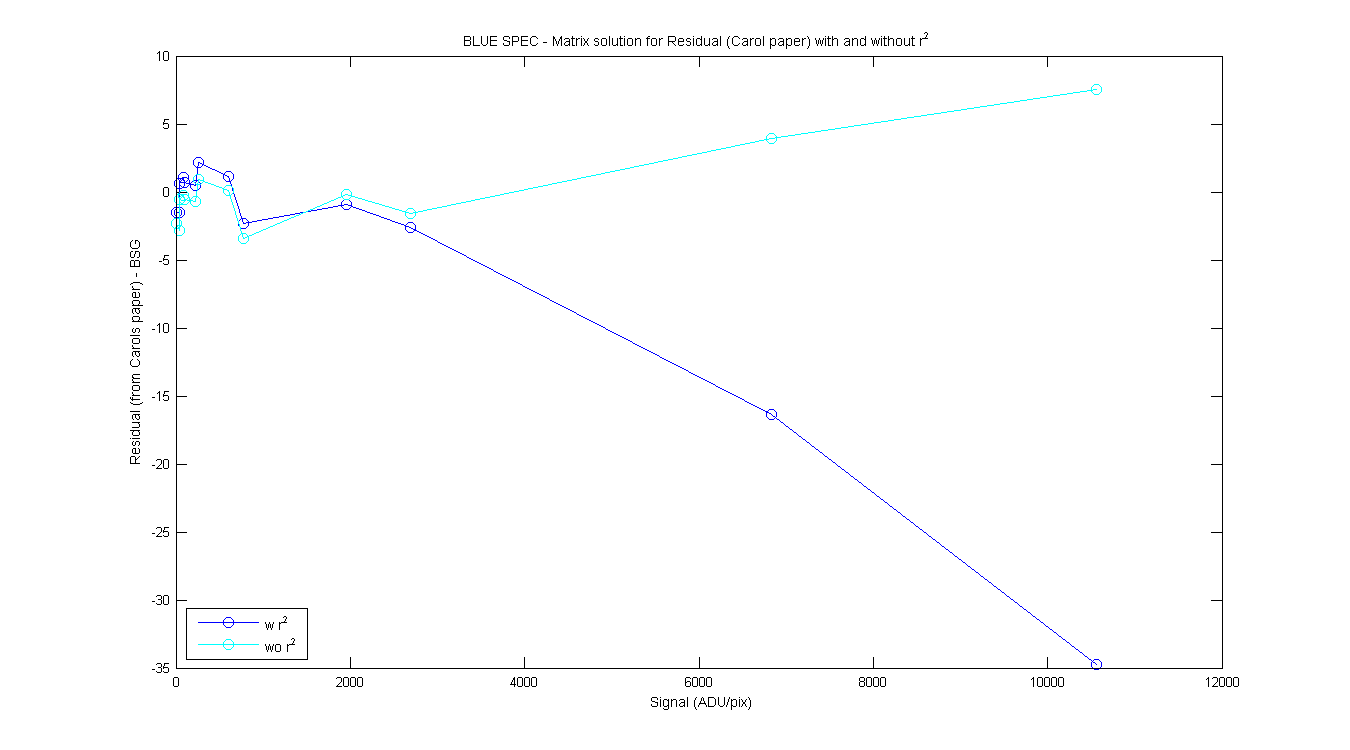
Figure 2
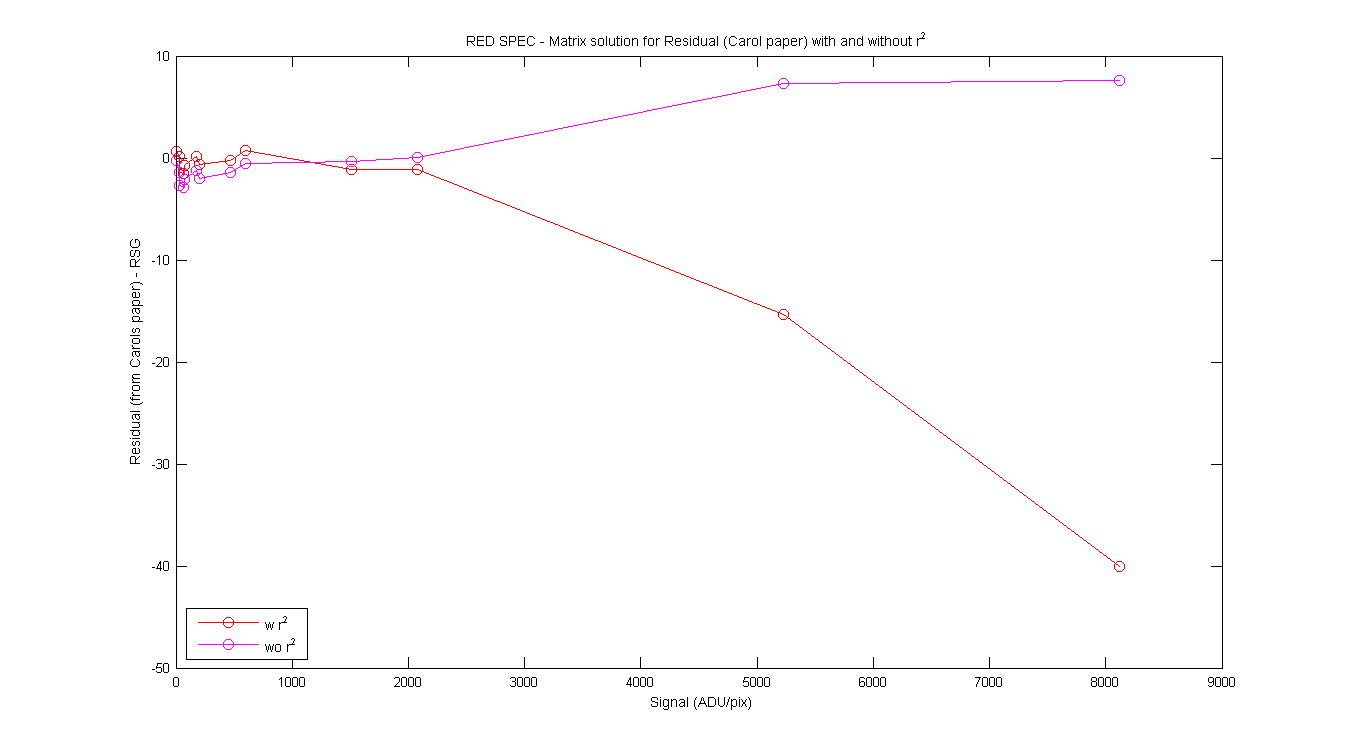
Figure 3
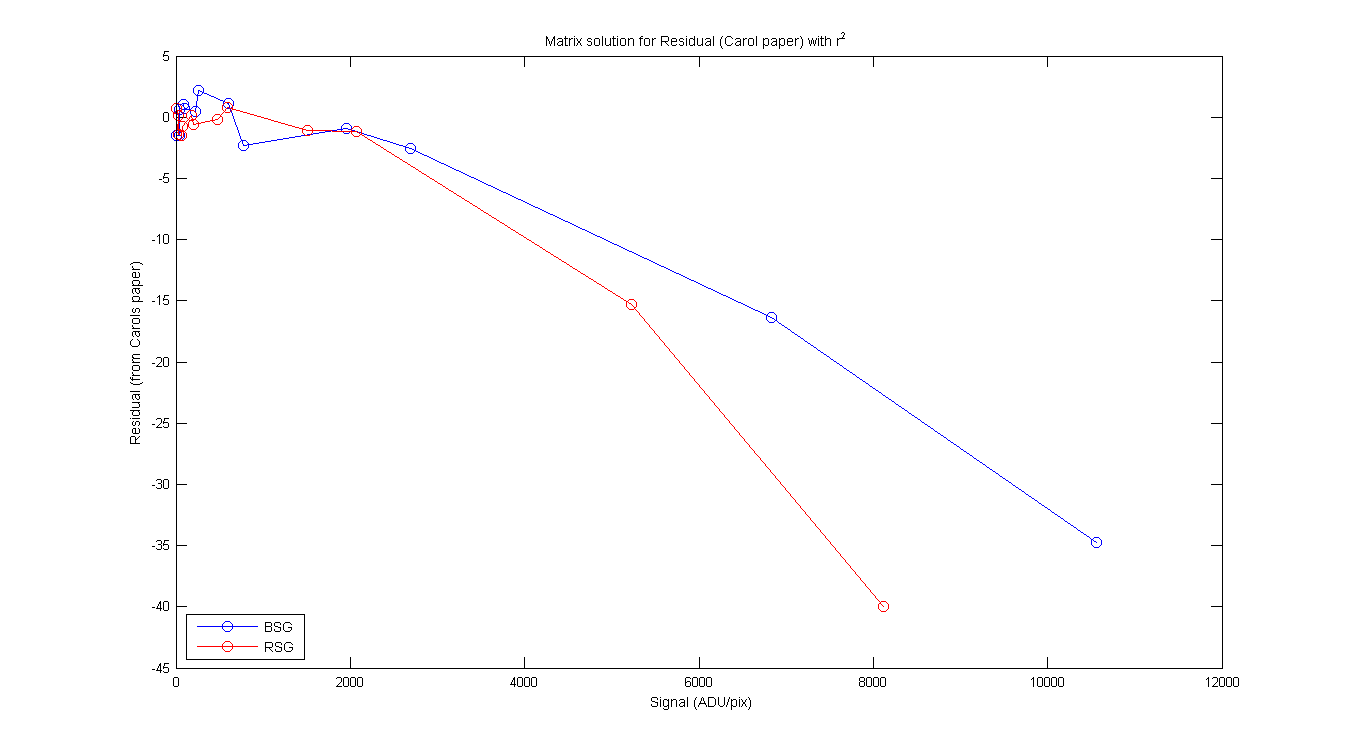
Figure 4
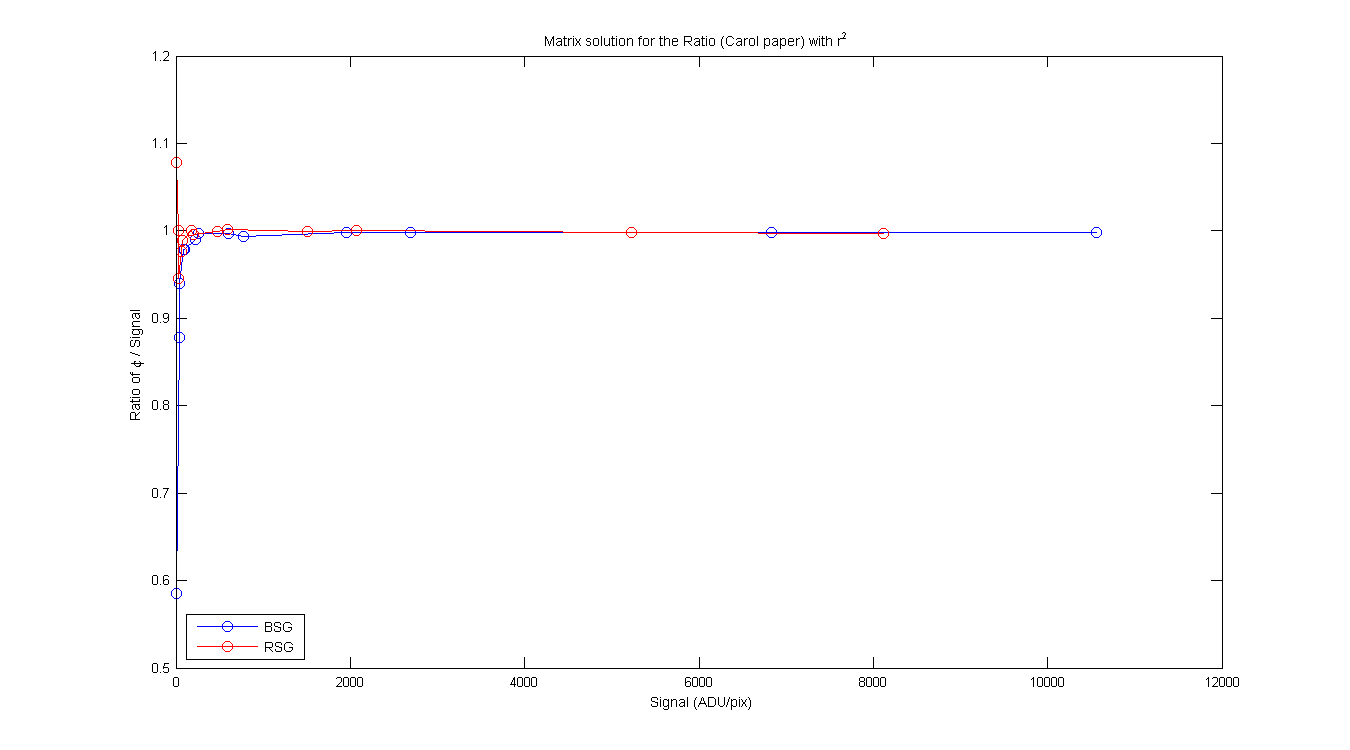
Figure 5
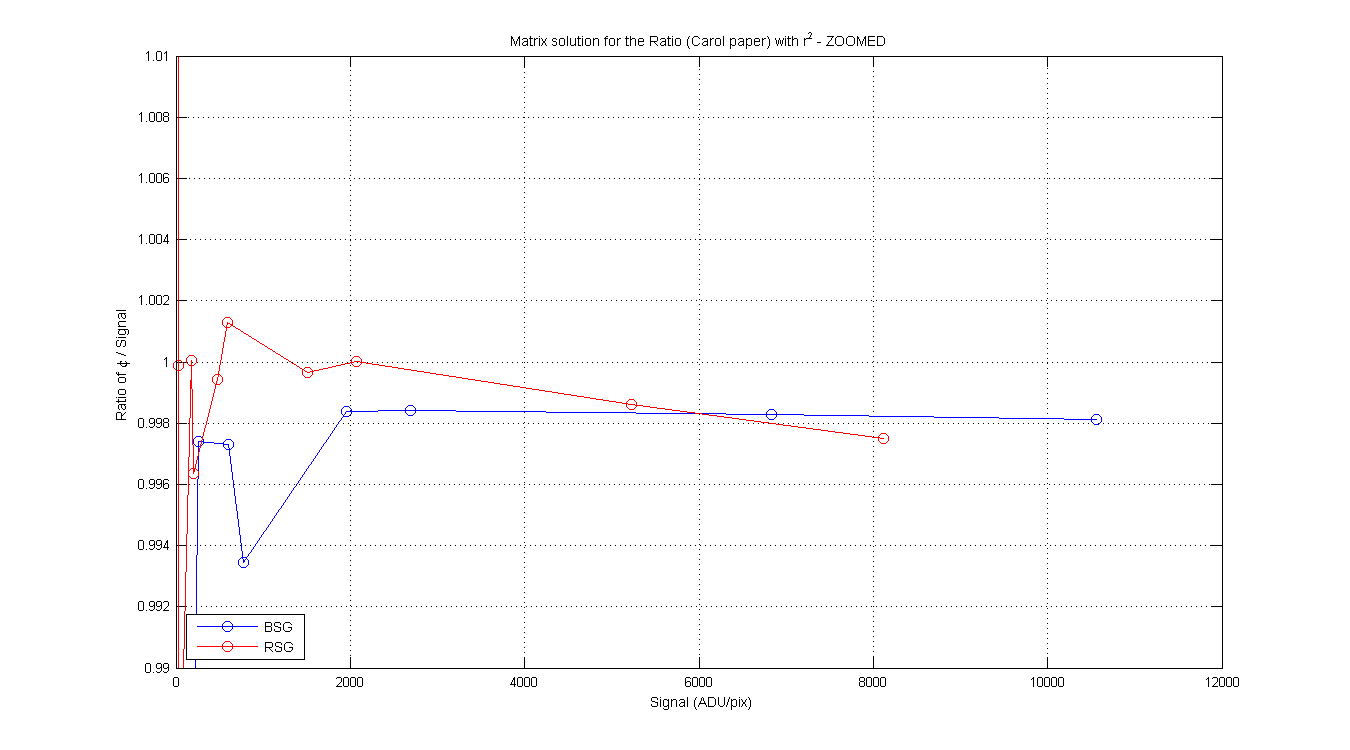
Figure 6
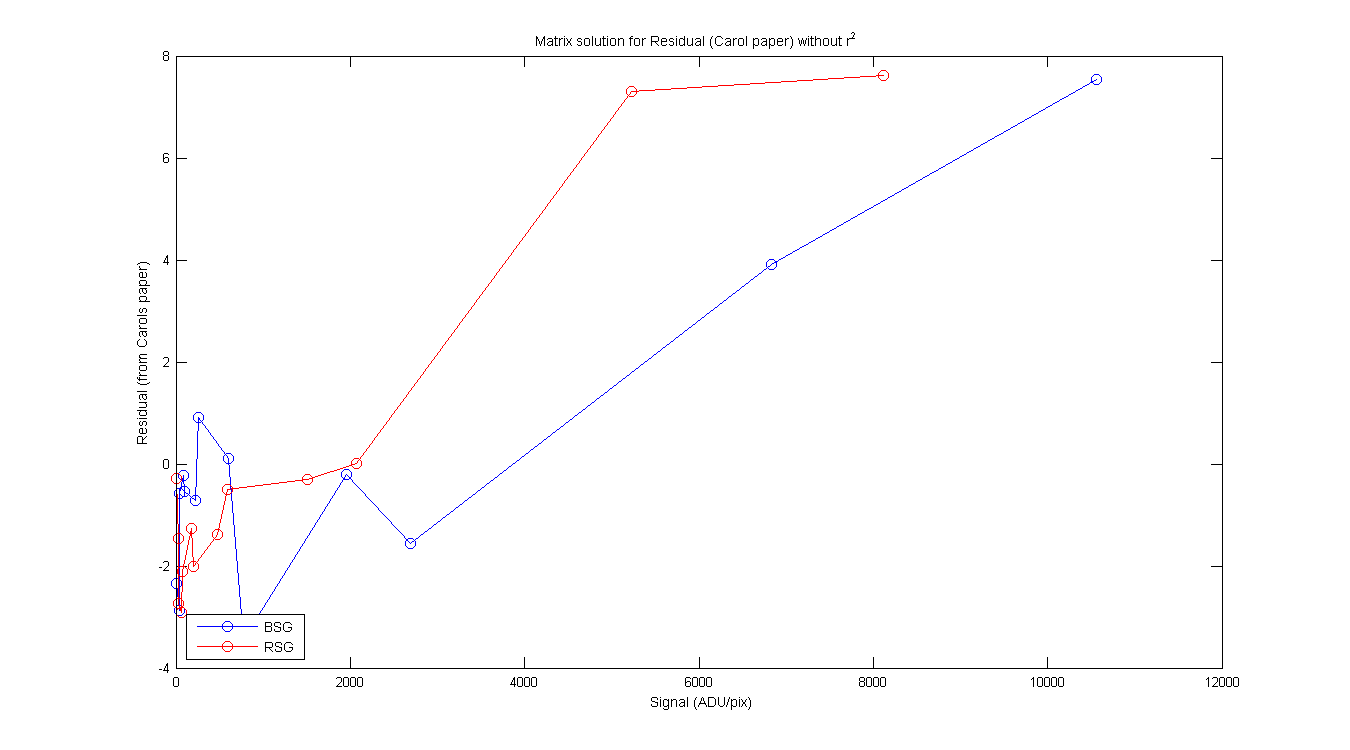
Figure 7
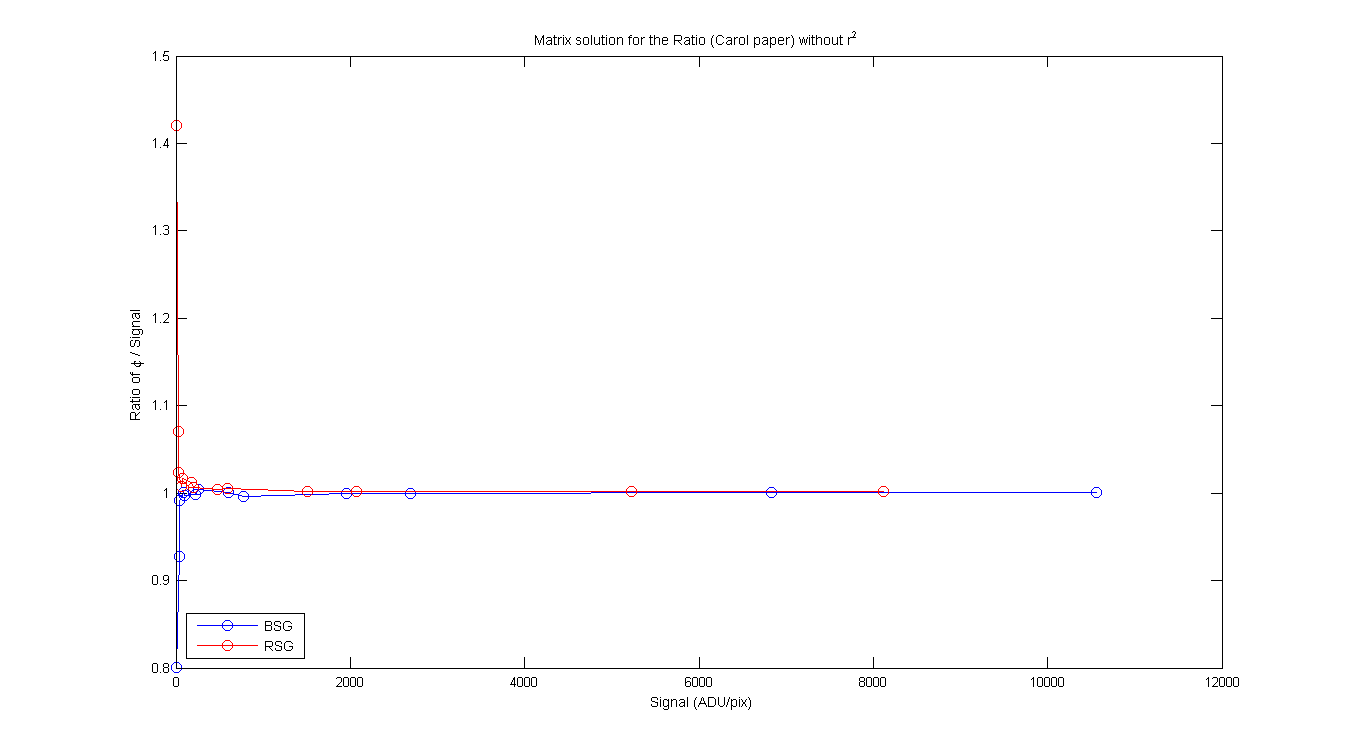
Figure 8
Mike plots of Lamp Voltages and temperatures during the FISH Es linearity experiment #1
