Mike's Email on 6/8/2010 4:39 PM
Hi Carol, Hi Steph,
Today I learned two things:
1.) For a Gaussian fit, FWHM = Width * 2*sqrt(2*ln(2))
where 2*sqrt(2*ln(2)) ~= 1.355
2.) There are two buttons on the PeakFit interface,
called "Fast Peak Fit with Numerical Update", and
"Full Peak Fit with Graphical Update",
and if you don't press one of those buttons
BEFORE you press "Review Peak Fit"
then any gotten via "Review Peak Fit" is preliminary -
good for navigating and setting parameters,
but not a complete fit.
OK, make that three things:
3.) Sometimes it's not a bad idea to RTFM.
With these in mind, I submit a second version of the file
Resonon_WaveCal_fits_2.xls
with what looks to me to be valid Center & FWHM data.
Sorry for the extra work, MF
Mikes Excel sheet 2
| Track | Min Wave | Max Wave | Wave Res |
|---|---|---|---|
| BSG 1 | 372.0221 | 733.3061 | 0.35316 |
| BSG 2 | 372.0358 | 733.298 | 0.35314 |
| BSG 3 | 372.0799 | 733.3218 | 0.35312 |
| BSG 4 | 372.1071 | 733.2819 | 0.35305 |
| BSG 5 | 372.1301 | 733.2773 | 0.35303 |
| BSG 6 | 372.1329 | 733.2658 | 0.35301 |
| BSG 7 | 372.1318 | 733.2585 | 0.35301 |
| BSG 8 | 372.1177 | 733.2495 | 0.35301 |
| BSG 9 | 372.0986 | 733.2575 | 0.35304 |
| BSG 10 | 372.127 | 733.2949 | 0.35305 |
| BSG 11 | 372.105 | 733.3279 | 0.3531 |
| BSG 12 | 372.0546 | 733.3104 | 0.35313 |
| BSG 13 | 372.0594 | 733.3778 | 0.3532 |
| BSG 14 | 372.0477 | 733.421 | 0.35325 |
| Track | Min Wave | Max Wave | Wave Res |
| RSG 1 | 503.1131 | 915.5576 | 0.40317 |
| RSG 2 | 503.1426 | 915.5029 | 0.40309 |
| RSG 3 | 503.1172 | 915.4348 | 0.40305 |
| RSG 4 | 503.0901 | 915.3702 | 0.40301 |
| RSG 5 | 503.0879 | 915.3235 | 0.40297 |
| RSG 6 | 503.0395 | 915.2662 | 0.40296 |
| RSG 7 | 503.0218 | 915.237 | 0.40295 |
| RSG 8 | 502.9998 | 915.2358 | 0.40297 |
| RSG 9 | 503.0235 | 915.2781 | 0.40299 |
| RSG 10 | 503.0017 | 915.3076 | 0.40304 |
| RSG 11 | 503.0378 | 915.4231 | 0.40311 |
| RSG 12 | 503.0074 | 915.4581 | 0.40318 |
| RSG 13 | 503.0003 | 915.4871 | 0.40321 |
| RSG 14 | 502.9966 | 915.5009 | 0.40323 |
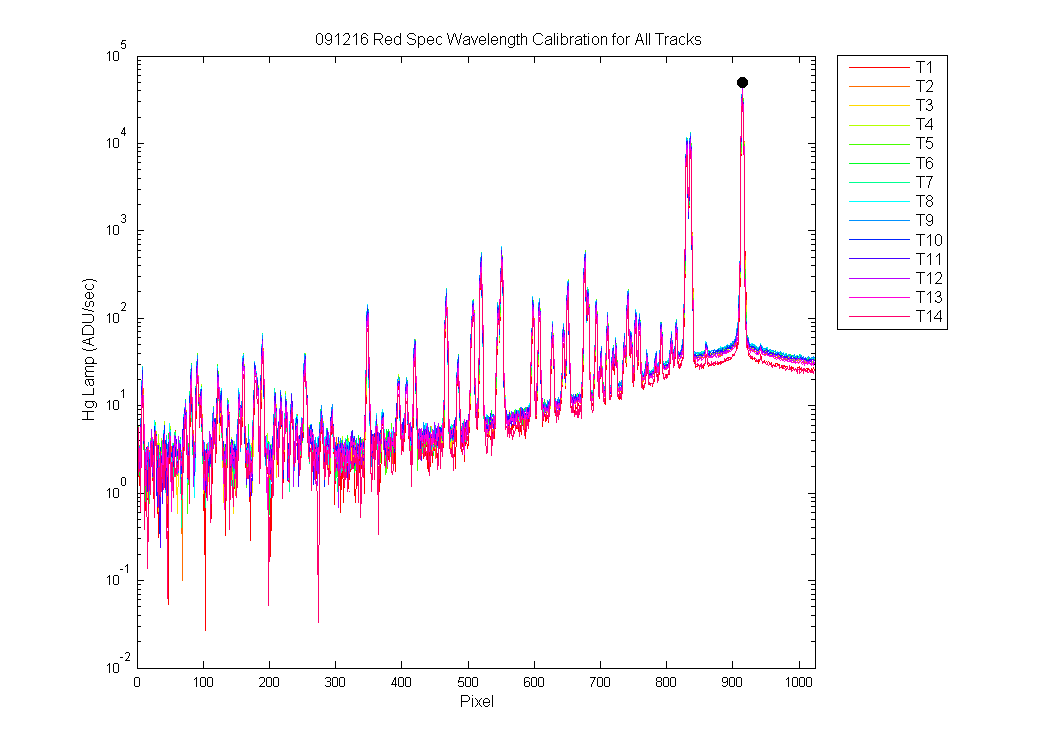
Black Dots show the peak Mike used from the RSG Hp Lamp data
Figure 1
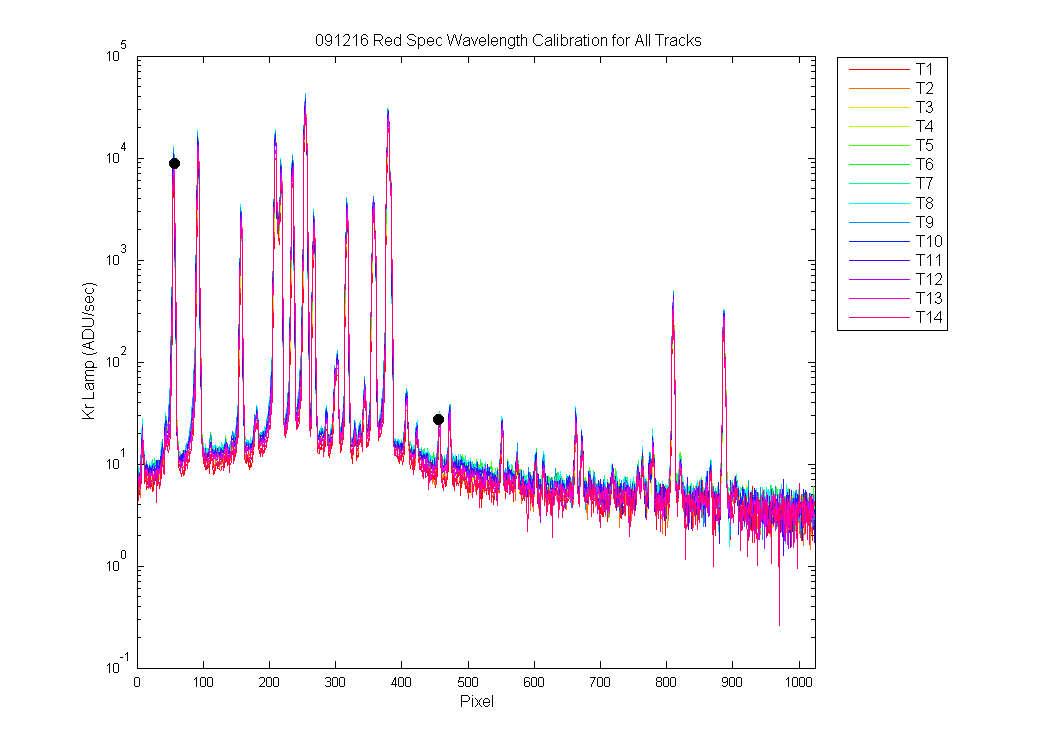
Black Dots show the two peaks Mike used from the RSG Kr Lamp data
Figure 2
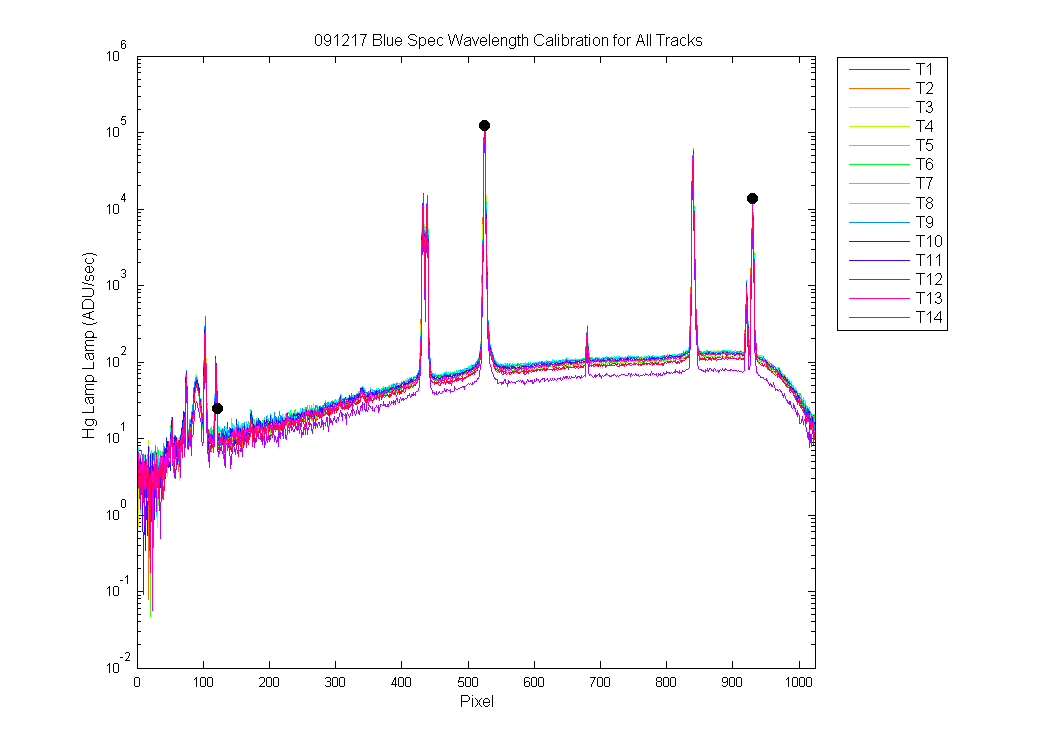
Black Dots show the three peaks Mike used from the BSG Hp Lamp data
Figure 3
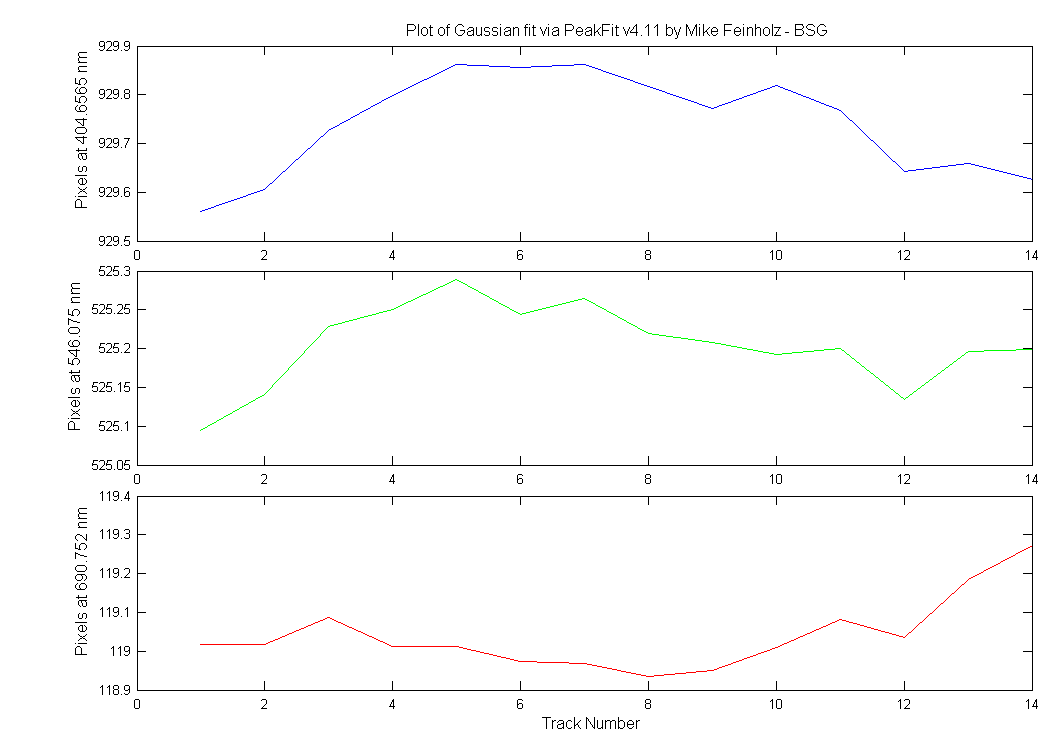
Plot showing the BSG center pixel for each wavelength (three panels) and track (x-axis)
Figure 4
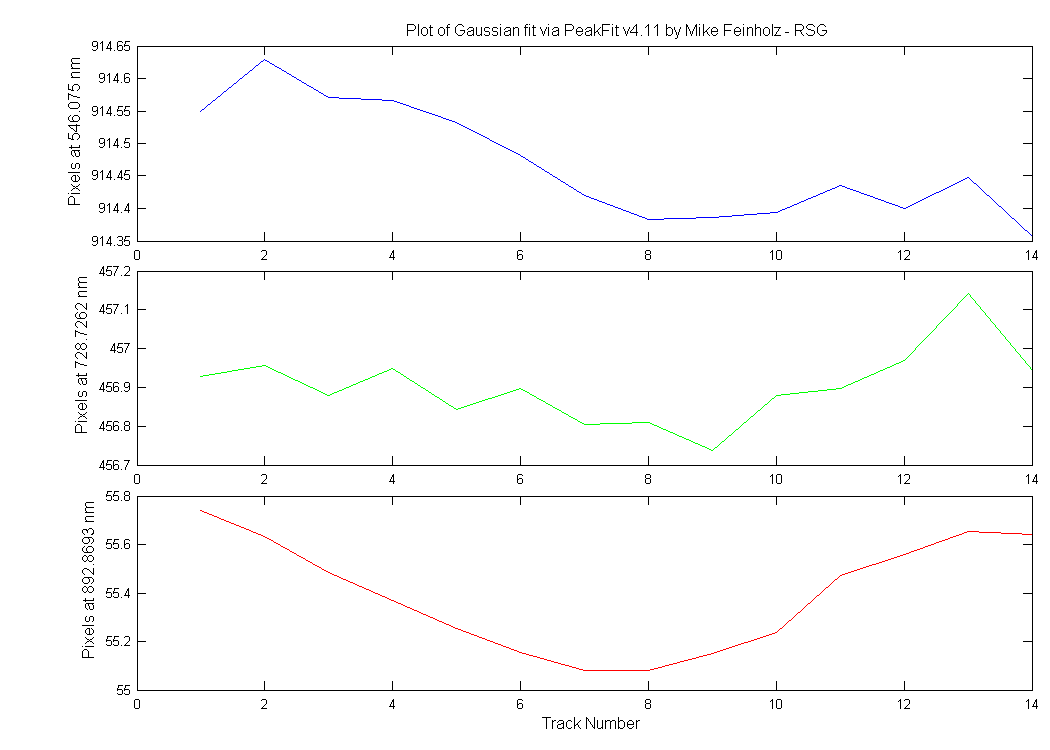
Plot showing the RSG center pixel for each wavelength (three panels) and track (x-axis)
Figure 5
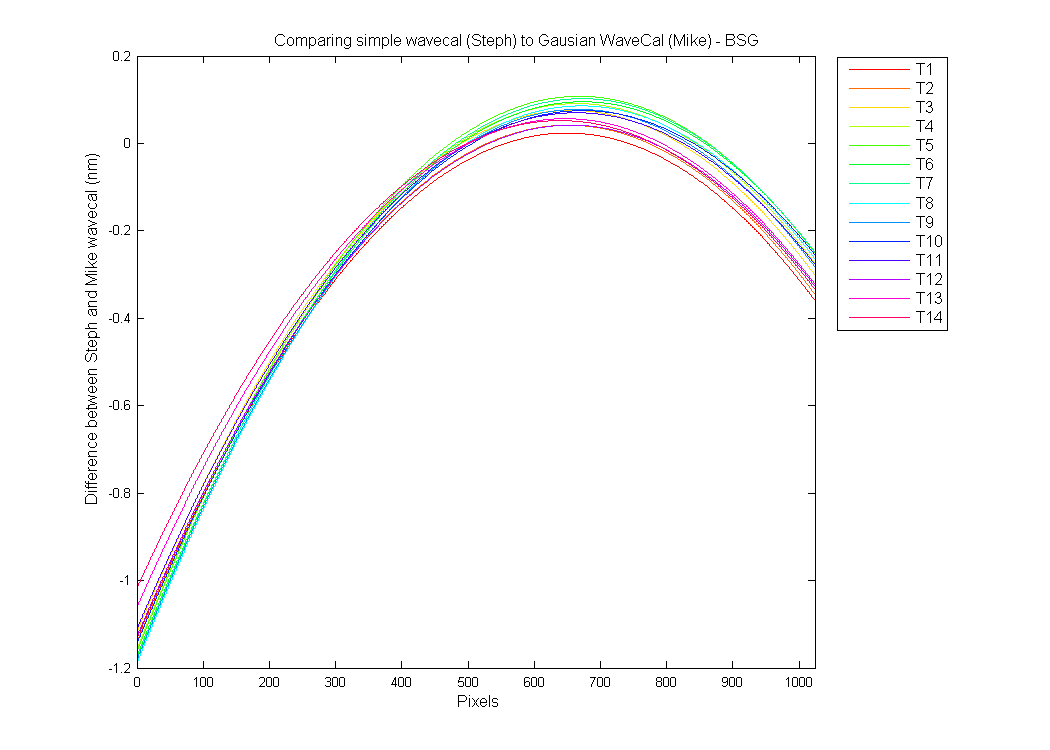
Difference between Stephanie's simple wavecal and Mike's Gausian wavecal for the BSG (Mike- Steph).
Figure 6
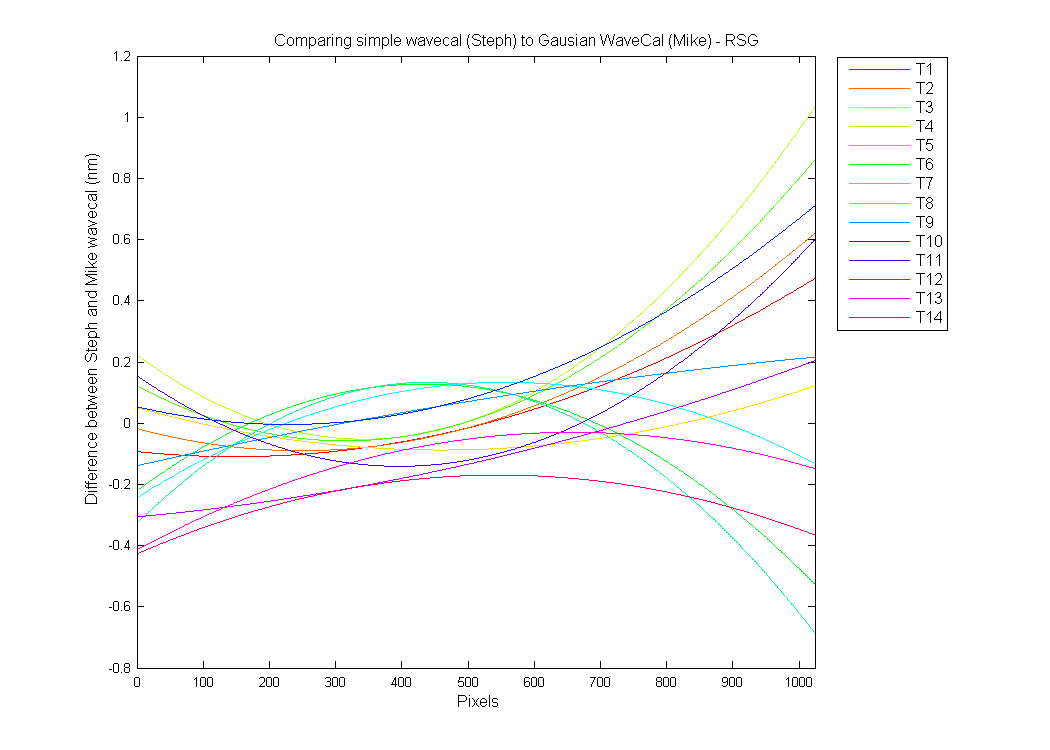
Difference between Stephanie's simple wavecal and Mike's Gausian wavecal for the RSG (Mike- Steph).
Figure 7
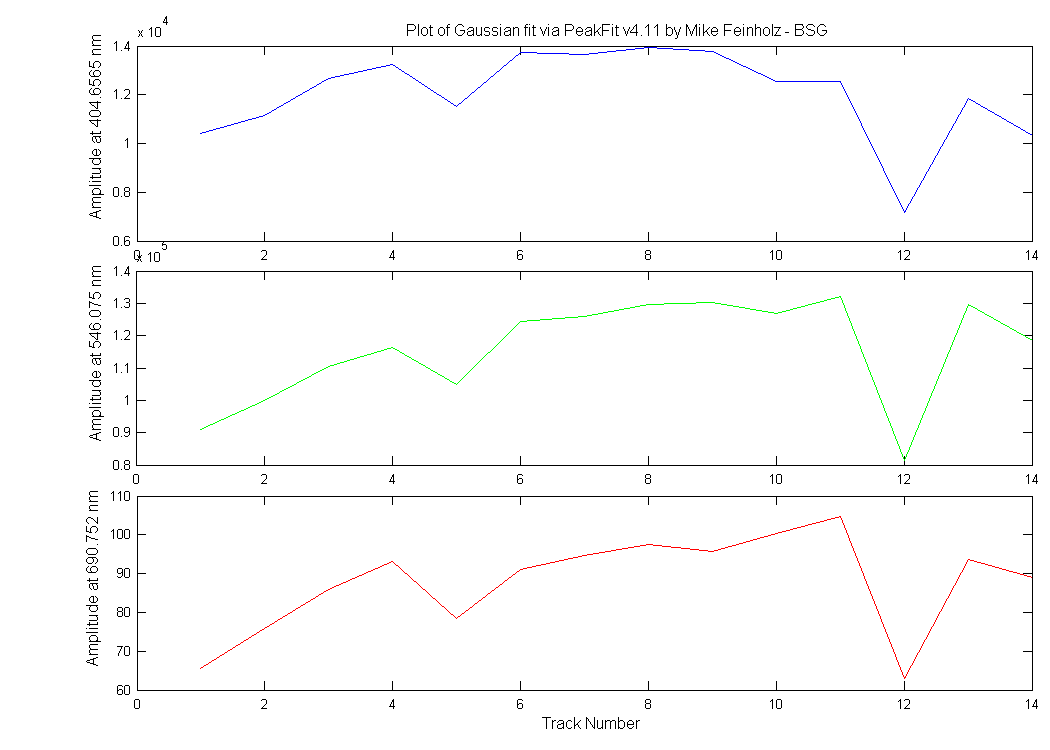
Plot showing the BSG Amplitude for each wavelength (three panels) and track (x-axis)
Figure 8
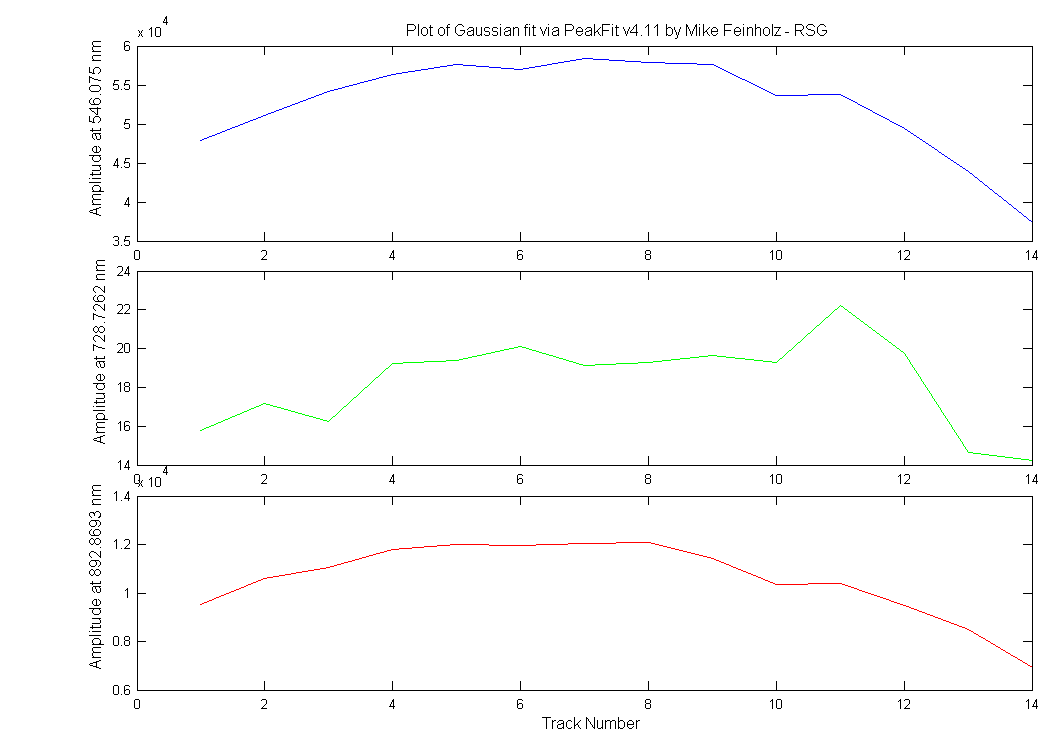
Plot showing the RSG Amplitude for each wavelength (three panels) and track (x-axis)
Figure 9
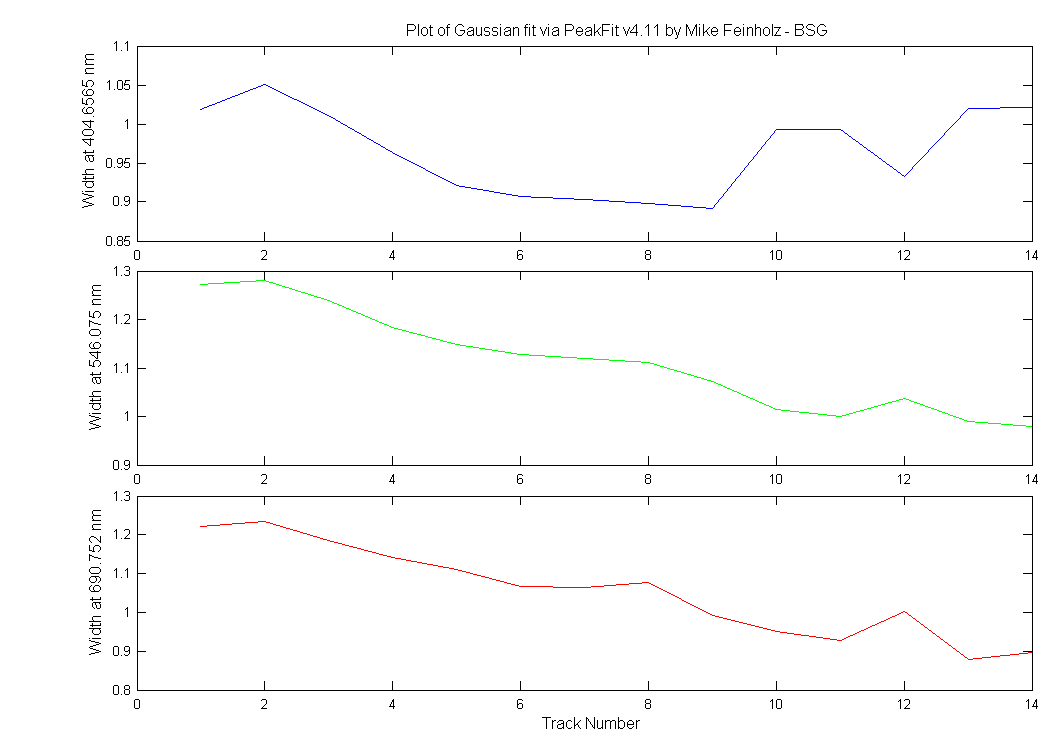
Plot showing the BSG width for each wavelength (three panels) and track (x-axis)
Figure 10
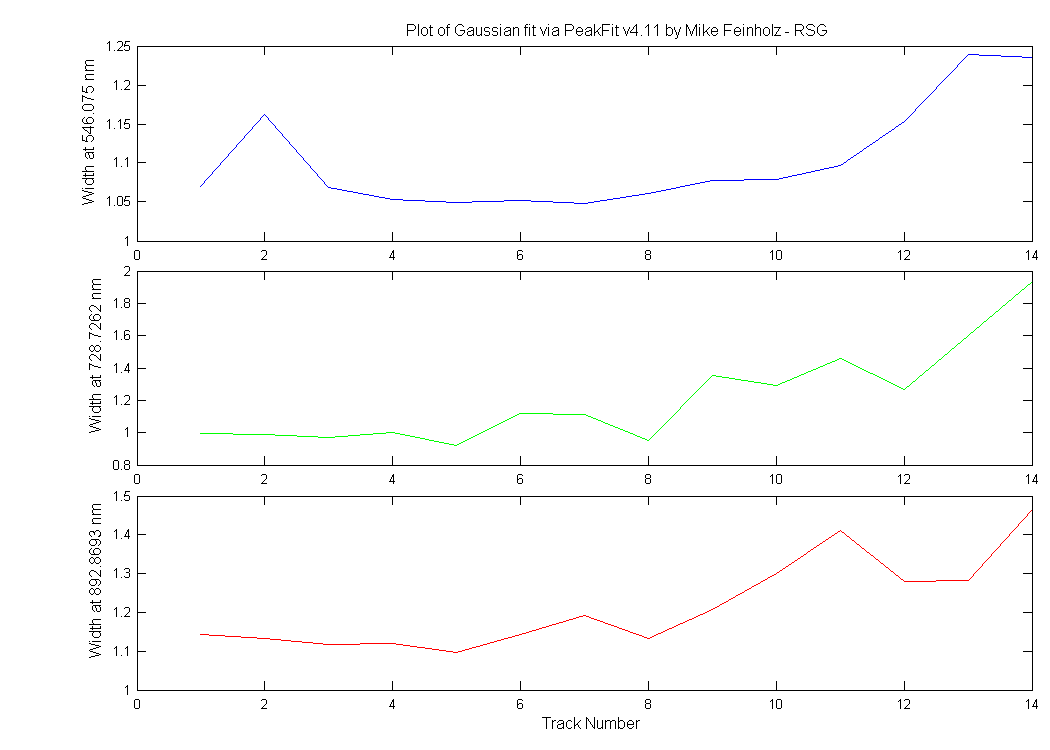
Plot showing the RSG width for each wavelength (three panels) and track (x-axis)
Figure 11
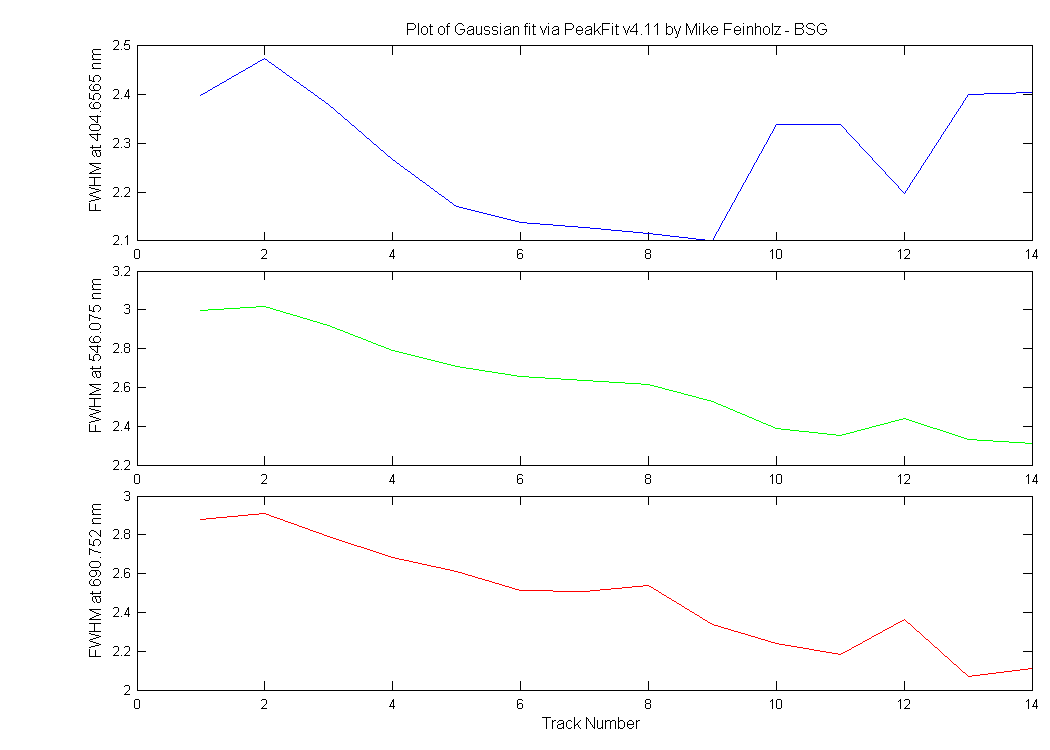
Plot showing the BSG FWHM for each wavelength (three panels) and track (x-axis)
Figure 12
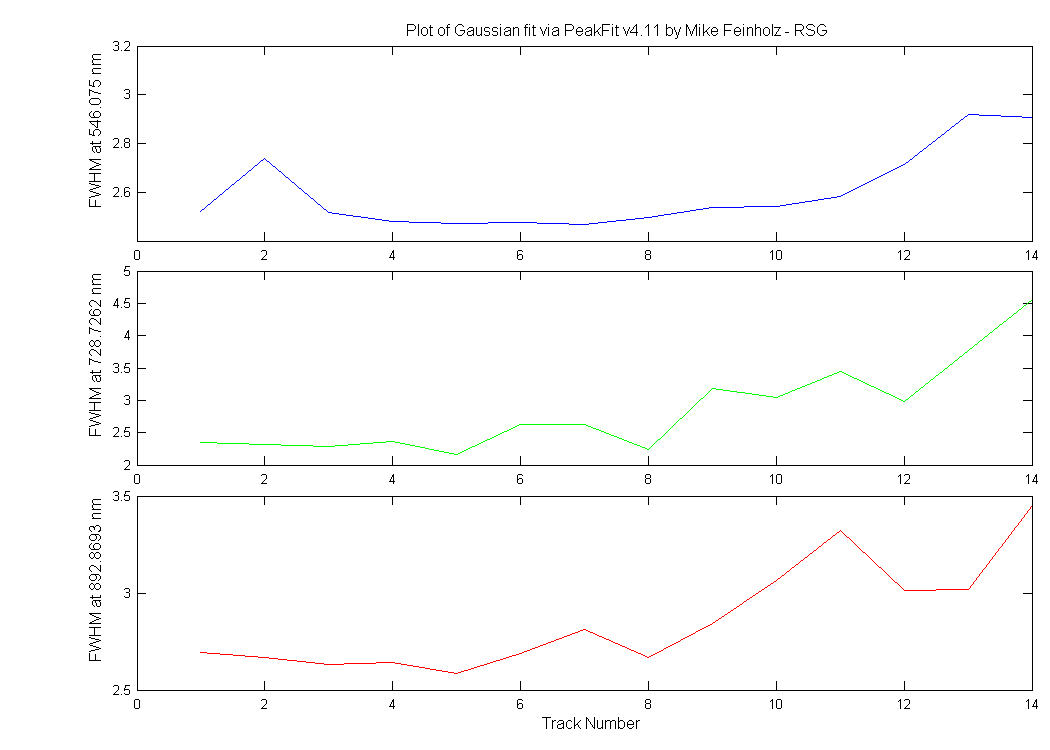
Plot showing the RSG FWHM for each wavelength (three panels) and track (x-axis)
Figure 13