| Description | Value or Code |
|---|---|
| Cruise_Name:, Vaux(12,:) | NIST |
| Cruise_Number | 2016-001 |
| Investigator:: Vaux(16,:) | Carol Johnson |
| Location_of_Measurement: Vaux(17,:) | NIST B019_221 |
| Purpose: Vaux(18,:) | Testing |
| MOBY_NET_Sequence_Position: Vaux(20,:) | Calibration Facility |
| Ambient_Air_Temp (deg C) | 23.1 |
| Relative_Humidity (%) | 25.1 |
| #_of_Levels | 4 |
| Time_Step (sec) | 5 |
| Initial lamp state: Vaux(40,:) | All Off |
| Time_adjustment_to_GMT | 0 |
| Time_of_Last_Servicing | 20151218 |
| SQM_120VAC_On | 20160209.171600 |
| SQM_Off_to_Standby | 20160209.174334 |
| SQM_Standby_to_Off | 20160209.200000 |
| SQM_120VAC_Off | NaN |
| Lamp 1 A burn hours | 0.46528 |
| Lamp 3 A burn hours | 0.48389 |
| DAQ_Program_Version | 0 |
| File Format Version | 2 |
| DAQ_Computer: Vaux(60,:) | EOS EQUIP 12 |
| DAQ_Program_Name: Vaux(61,:) | SQM Monitor_2.0.vi |
|
All Devices Under Test in the DUT column in DATA: DUT_White_Fiducial |
|
ASCII SQM file data: SQM_20160209_001.txt
ASCII SQM file data: PDF log file
| Lamp | On/Off # | N | Time on (hrs) | Mean (meas./set) | std | %std |
|---|---|---|---|---|---|---|
| Lamp 1A | 1 | 131 | 0.19917 | 0.94994 / 0.95 | 0.00011302 | 0.011898 |
| Lamp 1A | 2 | 112 | 0.16972 | 0.94996 / 0.95 | 0.00011312 | 0.011908 |
| Lamp 1A | 3 | 0 | NaN | NaN / NaN | NaN | NaN |
| Lamp 3A | 1 | 243 | 0.37028 | 2.9998 / 3 | 0.00098981 | 0.032996 |
| Level | PD internal monitor (V) | Level Change # | Mean | std | %std |
|---|---|---|---|---|---|
| Low (1A) | Red | 1 | 0.37886 | 0.00059413 | 0.15682 |
| Low (1A) | White | 1 | 0.36193 | 0.00037476 | 0.16415 |
| Low (1A) | Blue | 1 | 0.27717 | 0.0016863 | 0.21435 |
| Medium (3A) | Red | 3 | 2.4606 | 0.0062147 | 0.25257 |
| Medium (3A) | White | 3 | 0.12324 | 0.0091294 | 5.0427 |
| Medium (3A) | Blue | 3 | 2.227 | 0.0077717 | 0.27906 |
| High (1A & 3A) | Red | 4 | 0.45209 | 0.54423 | 120.3823 |
| High (1A & 3A) | White | 4 | 0.29856 | 0.047828 | 182.2875 |
| High (1A & 3A) | Blue | 4 | 2.4582 | 0.069596 | 22.1395 |
| Level | Temperature (C) | Level Change # | Mean | std | %std |
|---|---|---|---|---|---|
| Low (1A) | PD | 1 | 34.9964 | 0.13192 | 0.37697 |
| Medium (3A) | PD | 3 | 34.9988 | 0.12844 | 0.36698 |
| High (1A & 3A) | PD | 4 | 34.9939 | 0.12785 | 0.36536 |
Red PD (max value): 2.499: #of possible satureated values 117
White PD (max value): 2.4862: #of possible satureated values 152
Blue PD (max value): 2.4928: #of possible satureated values 31
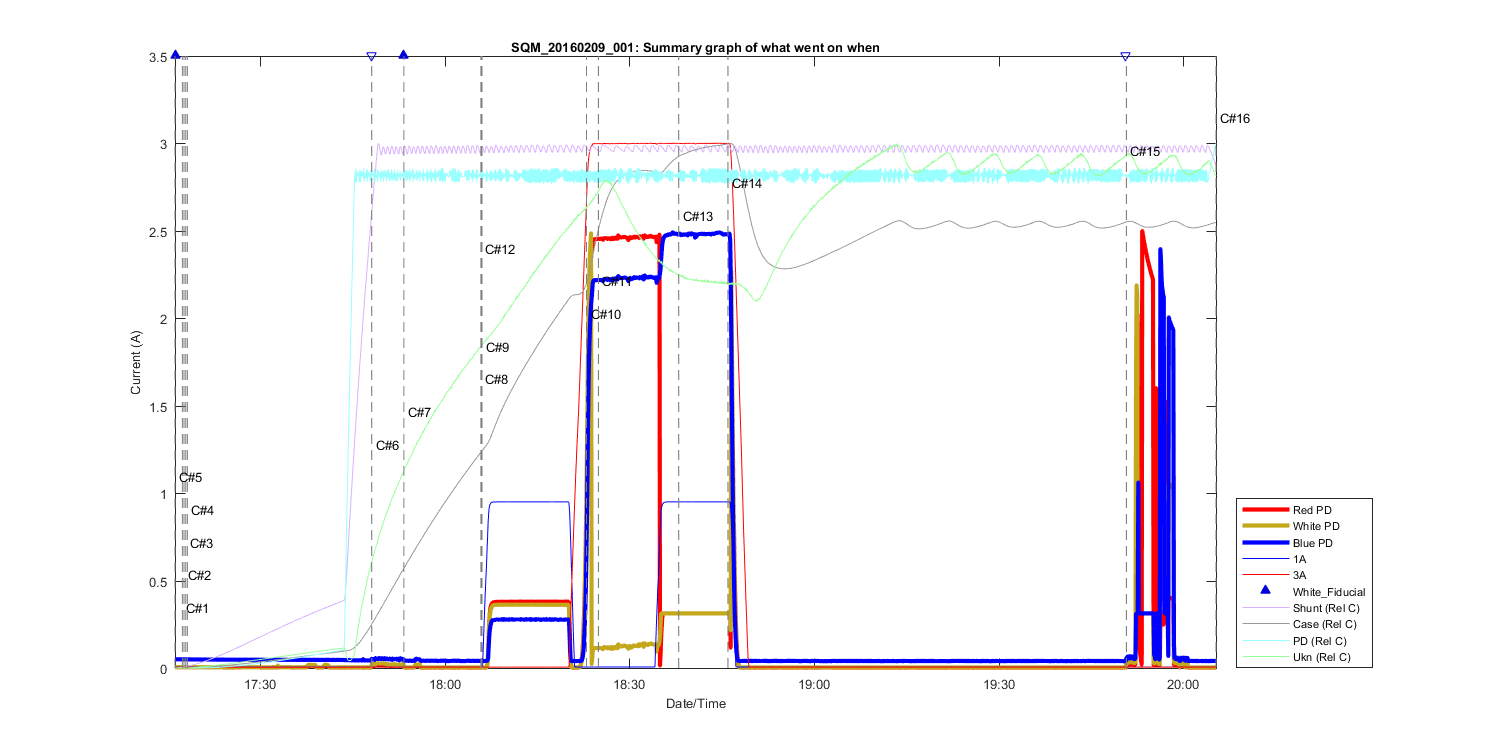
Figure 1
Summary Graph showing all measurements taken in this file, including auxilliary temperature measurements and comments. The text C# shows what time in the file the comments (shown above where made). The triangles at the top of the figure shows then a DUT (Device under test) was placed in front of the SQM and removed.
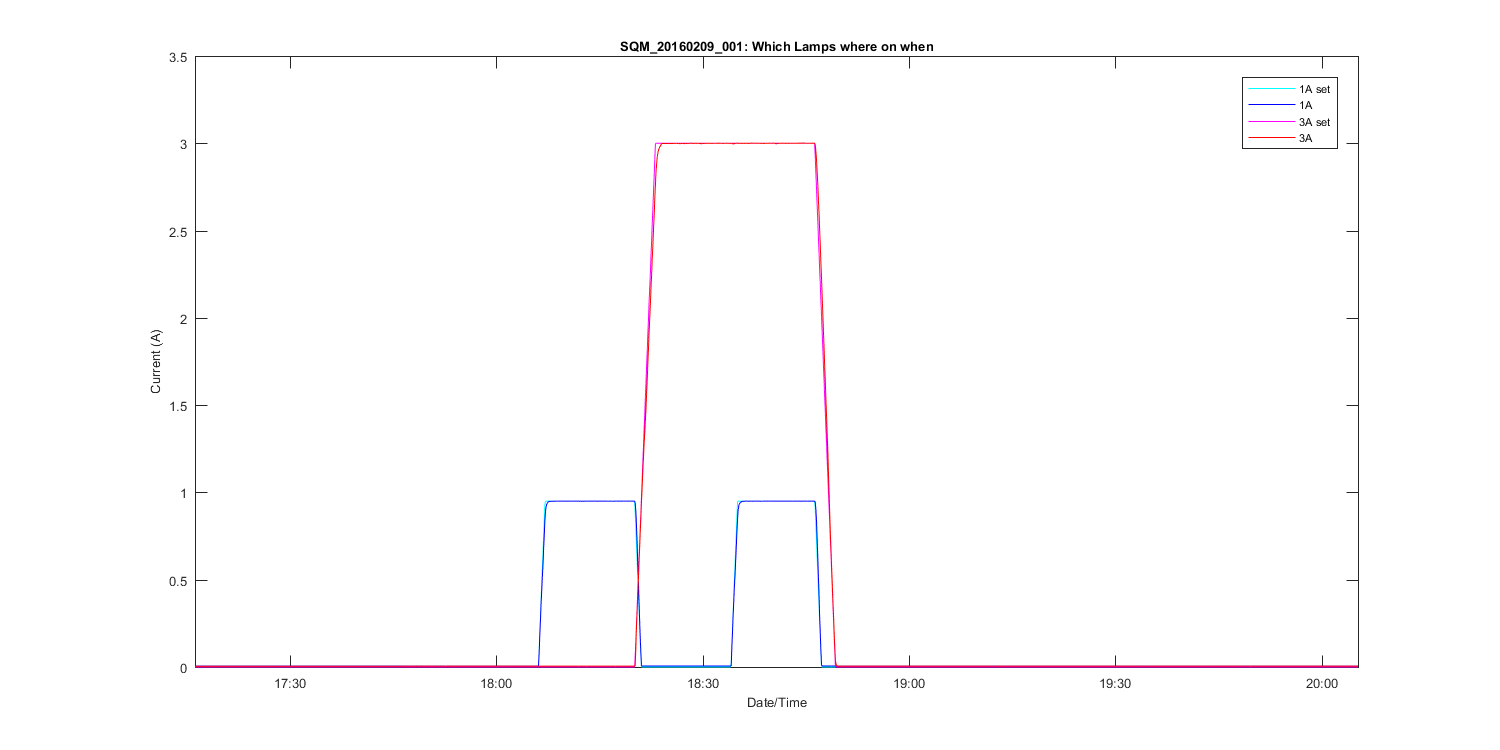
Figure 2
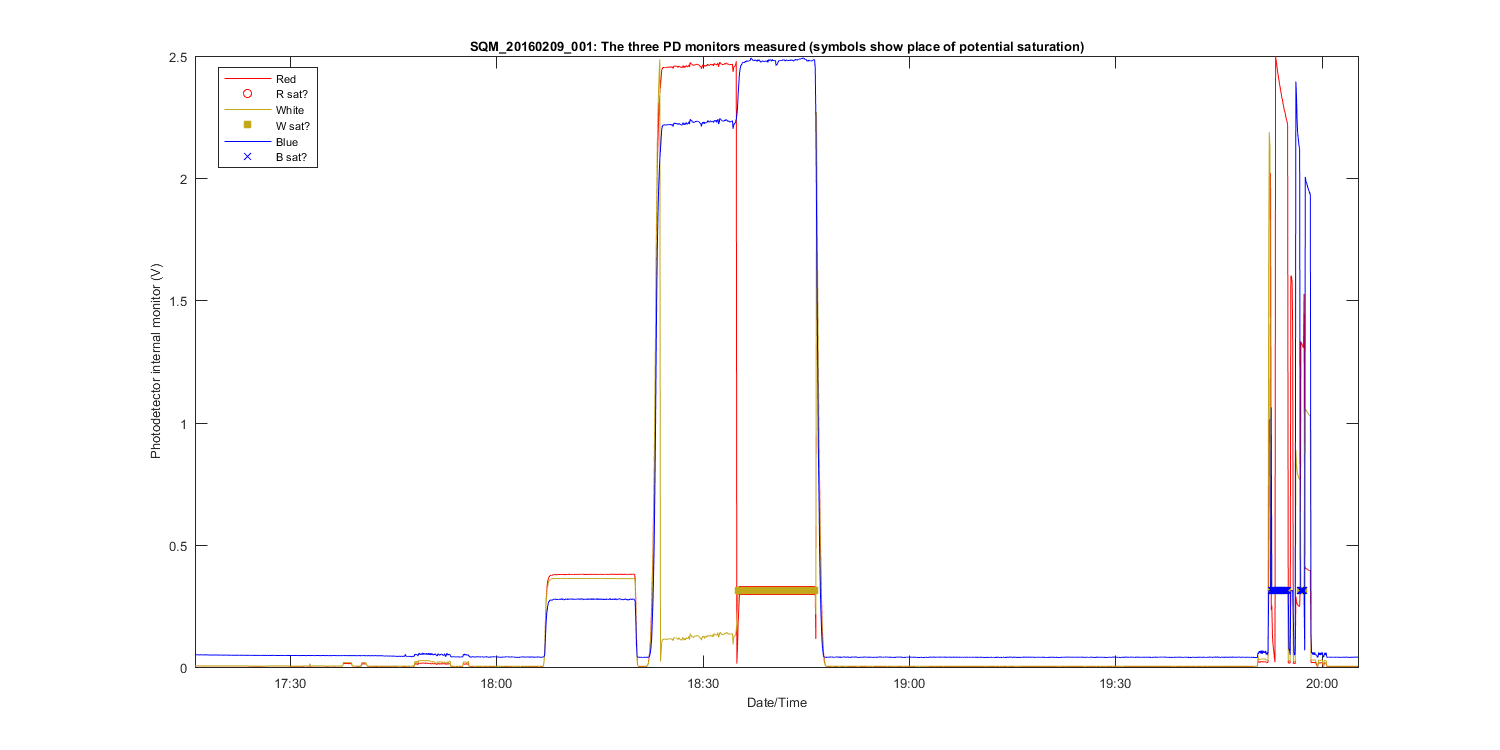
Figure 3
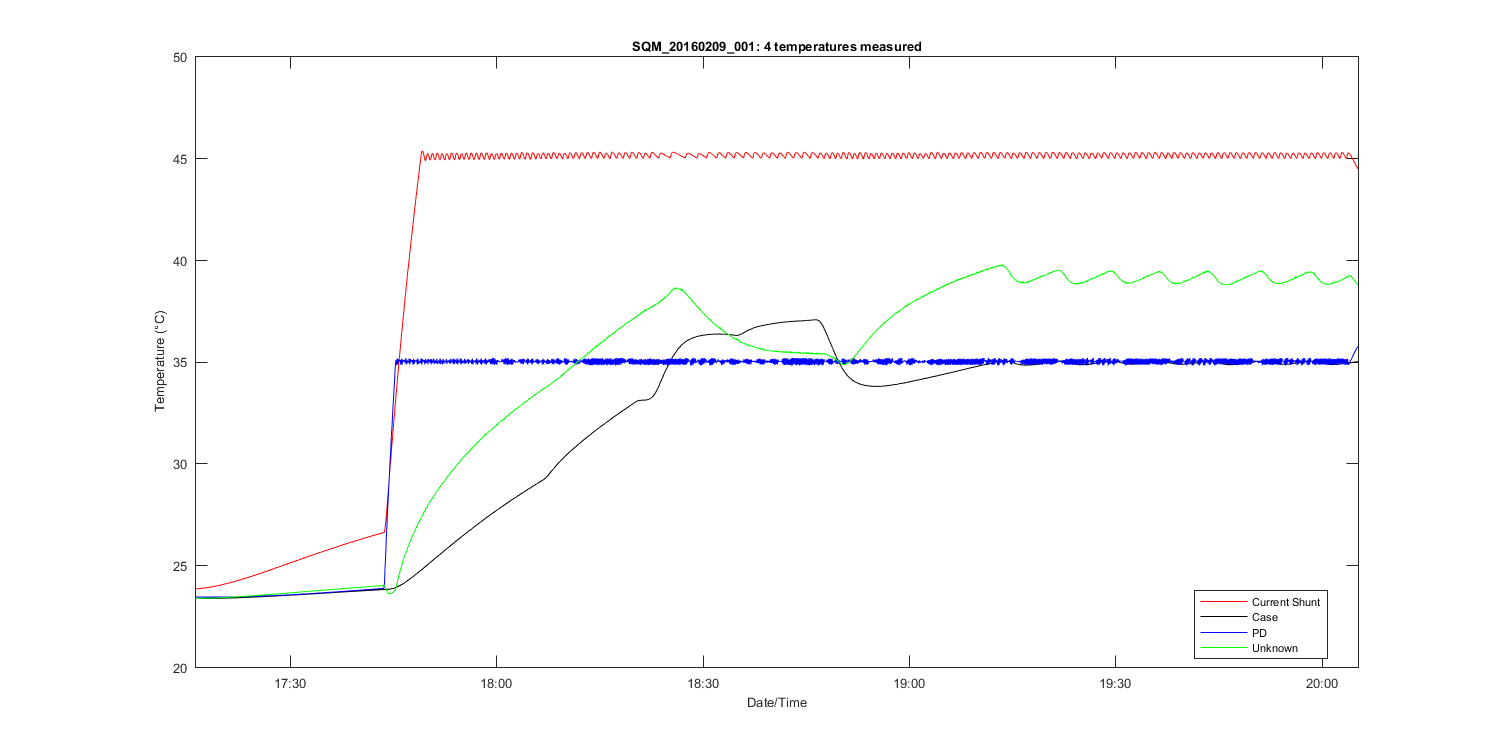
Figure 4
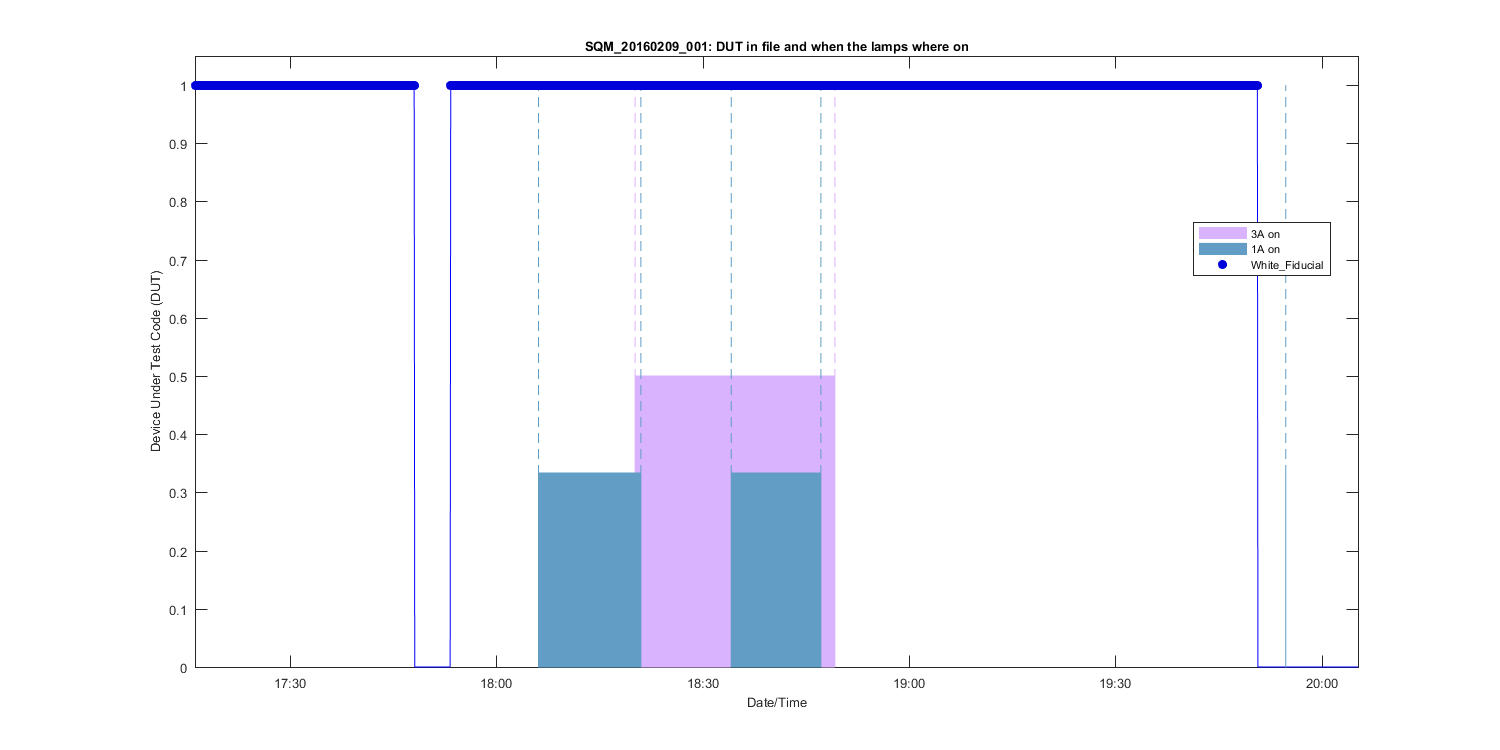
Figure 5
Figure 6
Figure 7
Figure 8
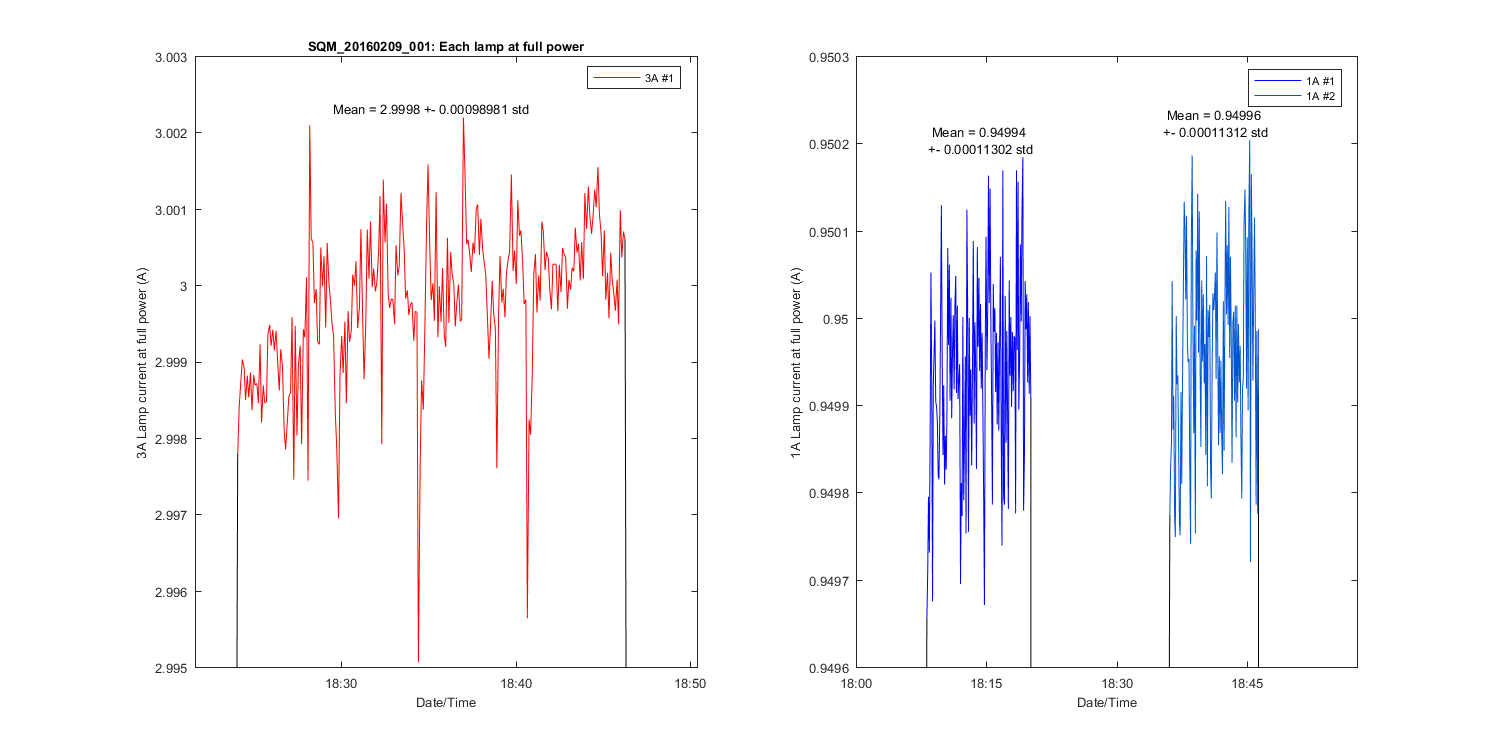
Figure 9
Figure 10