| Description | Value or Code |
|---|---|
| Cruise_Name:, Vaux(12,:) | NIST |
| Cruise_Number | 2016-001 |
| Investigator:: Vaux(16,:) | Carol Johnson |
| Location_of_Measurement: Vaux(17,:) | NIST B019_221 |
| Purpose: Vaux(18,:) | Testing |
| MOBY_NET_Sequence_Position: Vaux(20,:) | Calibration Facility |
| Ambient_Air_Temp (deg C) | 23.1 |
| Relative_Humidity (%) | 23.3 |
| #_of_Levels | 1 |
| Time_Step (sec) | 5 |
| Initial lamp state: Vaux(40,:) | All Off |
| Time_adjustment_to_GMT | 0 |
| Time_of_Last_Servicing | 20151218 |
| SQM_120VAC_On | 20160209.171600 |
| SQM_Off_to_Standby | 20160209.205522 |
| SQM_Standby_to_Off | 20160209.210748 |
| SQM_120VAC_Off | 20160209.211700 |
| Lamp 1 A burn hours | 0.19361 |
| Lamp 3 A burn hours | 0.24861 |
| DAQ_Program_Version | 0 |
| File Format Version | 2 |
| DAQ_Computer: Vaux(60,:) | EOS EQUIP 12 |
| DAQ_Program_Name: Vaux(61,:) | SQM Monitor_2.0.vi |
|
All Devices Under Test in the DUT column in DATA: DUT_White_Fiducial DUT_Other {black cloth taped over open hole in adaptor flange} |
|
ASCII SQM file data: SQM_20160209_003.txt
ASCII SQM file data: PDF log file
| Lamp | On/Off # | N | Time on (hrs) | Mean (meas./set) | std | %std |
|---|---|---|---|---|---|---|
| Lamp 1A | 1 | 95 | 0.14389 | 0.94992 / 0.95 | 0.00013239 | 0.013937 |
| Lamp 3A | 1 | 82 | 0.12389 | 2.9998 / 3 | 0.00037103 | 0.012369 |
| Level | PD internal monitor (V) | Level Change # | Mean | std | %std |
|---|---|---|---|---|---|
| High (1A & 3A) | Red | 2 | 1.2667 | 0.5002 | 39.4874 |
| High (1A & 3A) | White | 2 | 1.3804 | 0.55538 | 36.2368 |
| High (1A & 3A) | Blue | 2 | 1.7558 | 0.37197 | 28.4883 |
| Level | Temperature (C) | Level Change # | Mean | std | %std |
|---|---|---|---|---|---|
| High (1A & 3A) | PD | 2 | 34.9988 | 0.11114 | 0.31756 |
Red PD (max value): 1.5863: #of possible satureated values 18
White PD (max value): 1.7422: #of possible satureated values 19
Blue PD (max value): 2.4728: #of possible satureated values 0
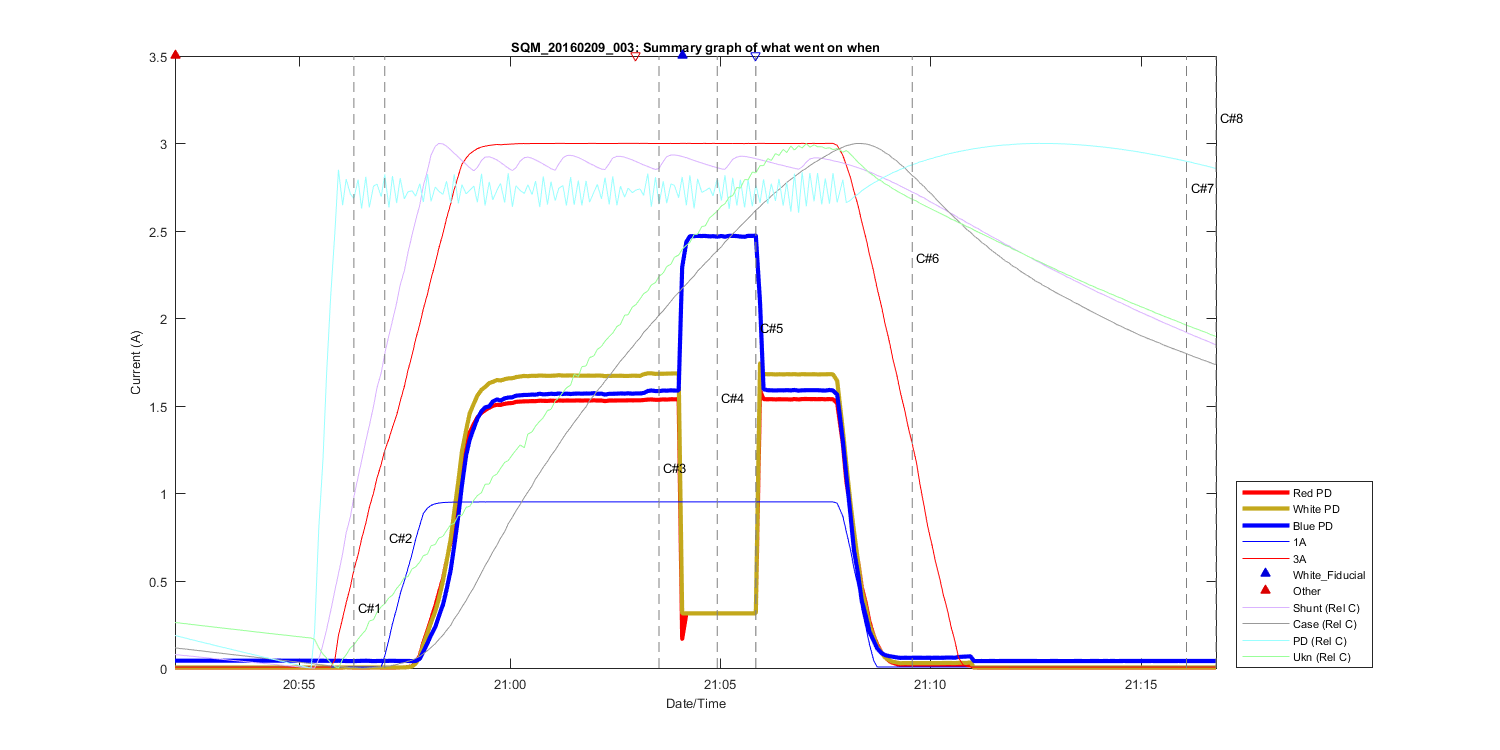
Figure 1
Summary Graph showing all measurements taken in this file, including auxilliary temperature measurements and comments. The text C# shows what time in the file the comments (shown above where made). The triangles at the top of the figure shows then a DUT (Device under test) was placed in front of the SQM and removed.
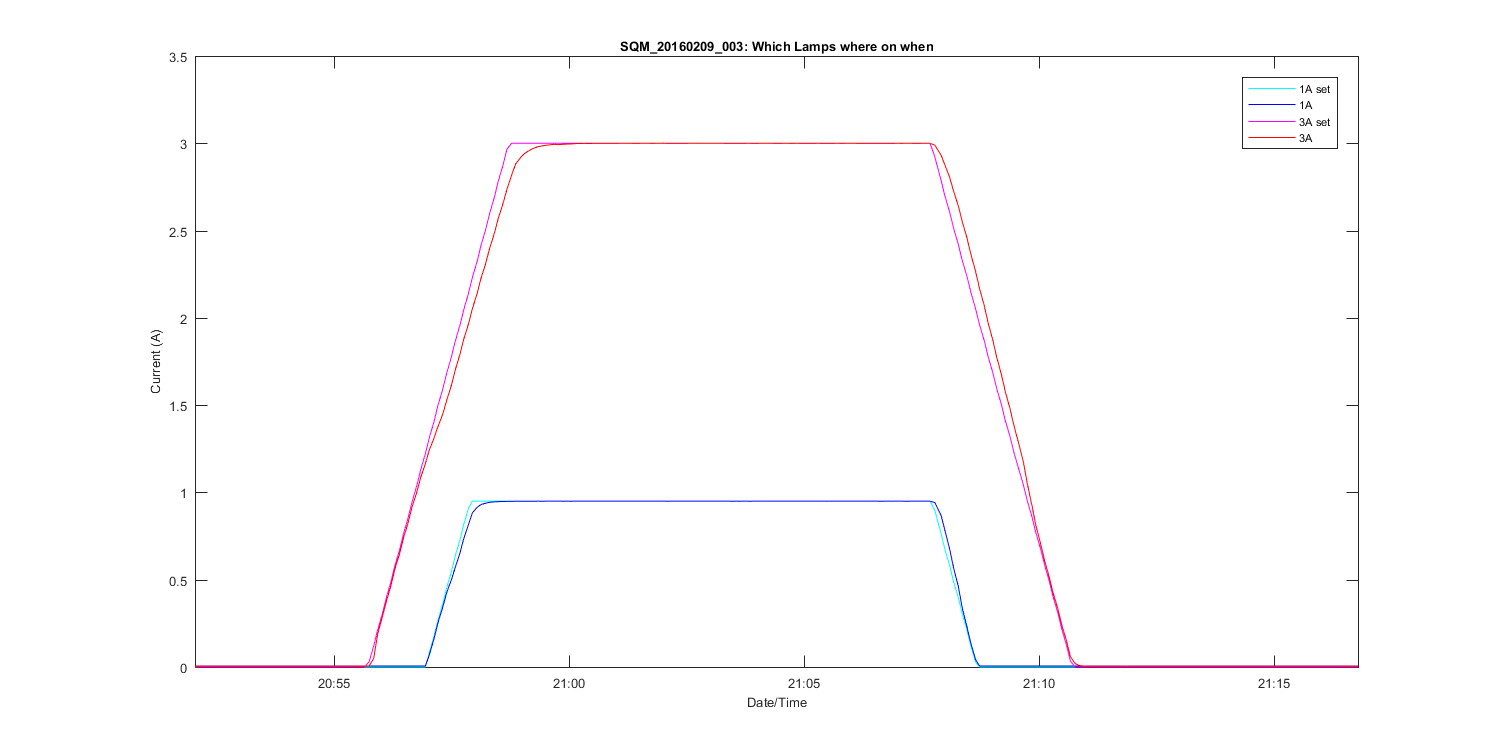
Figure 2
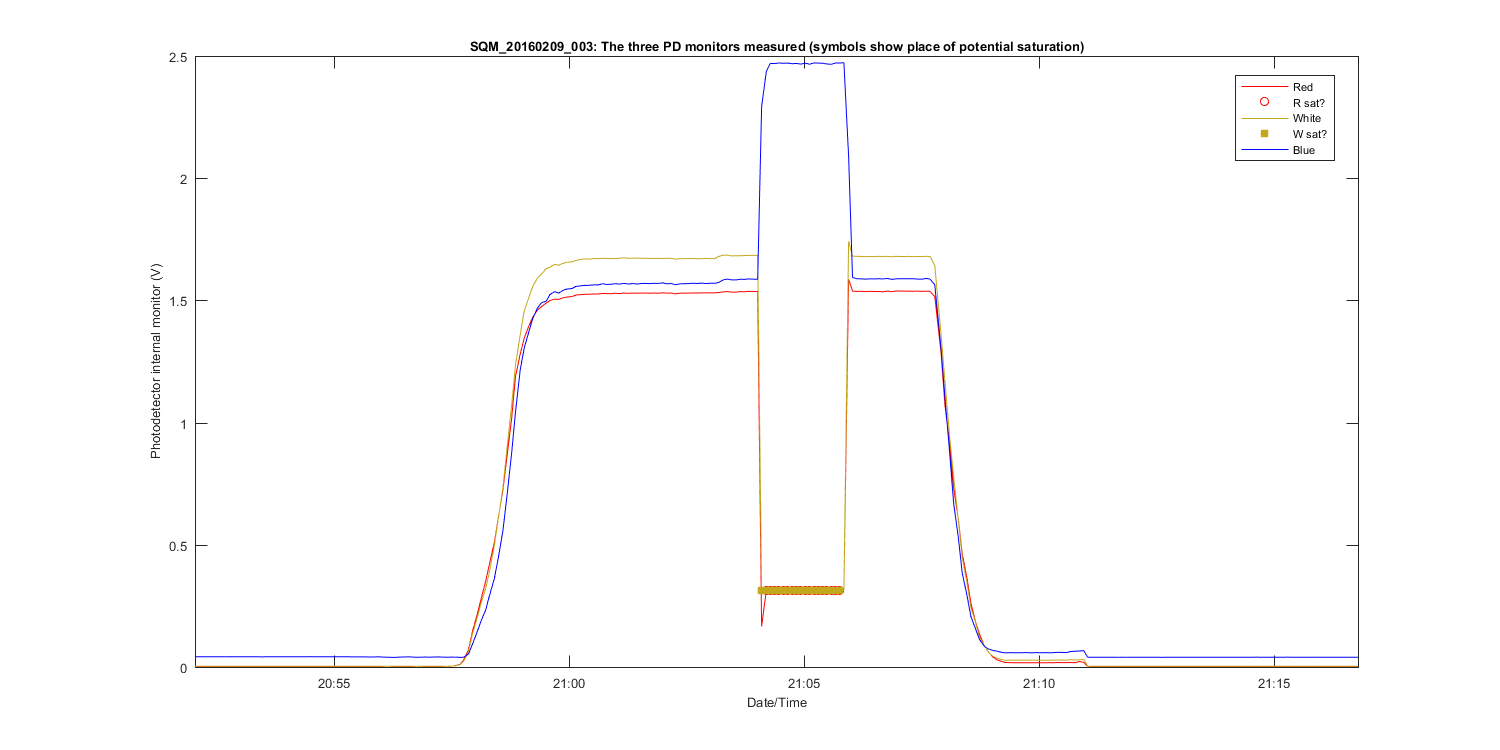
Figure 3
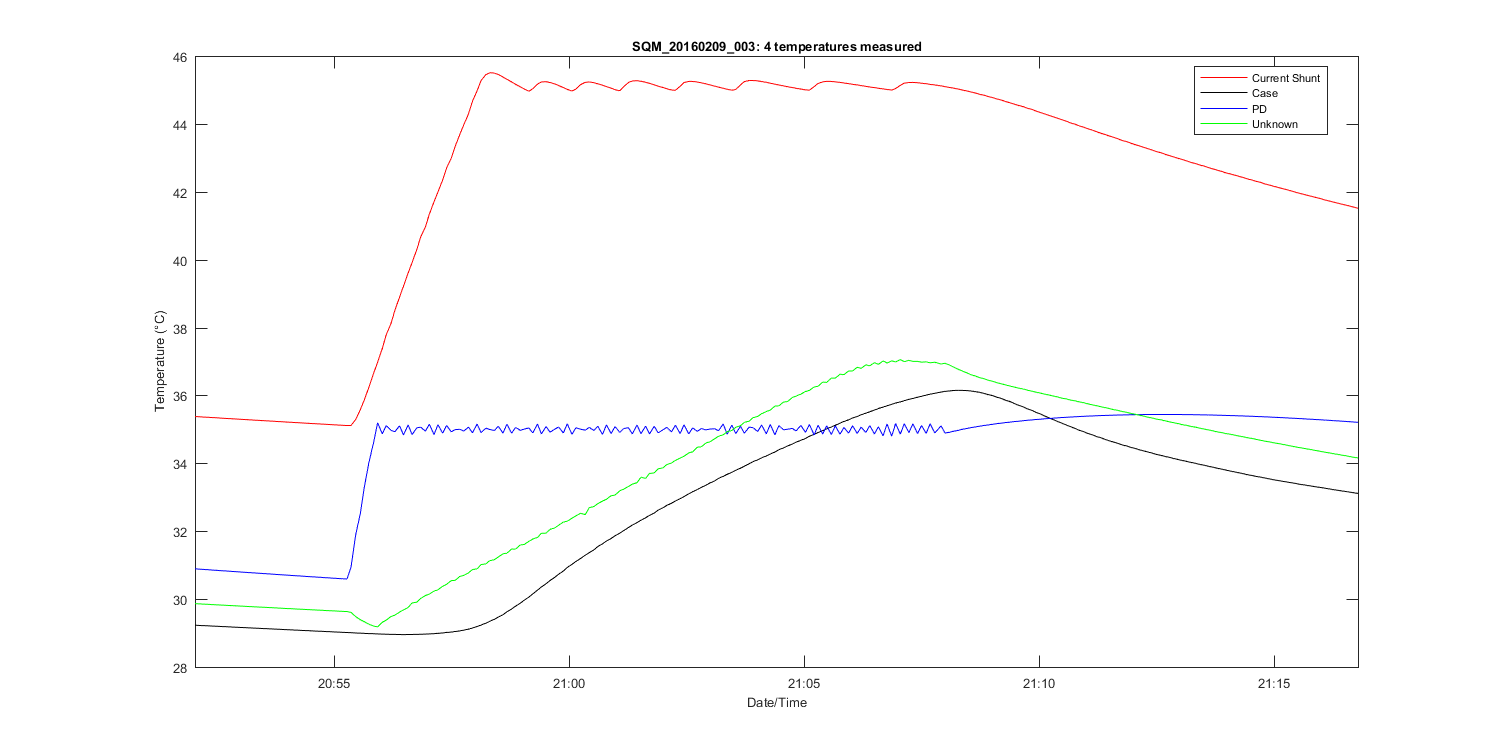
Figure 4
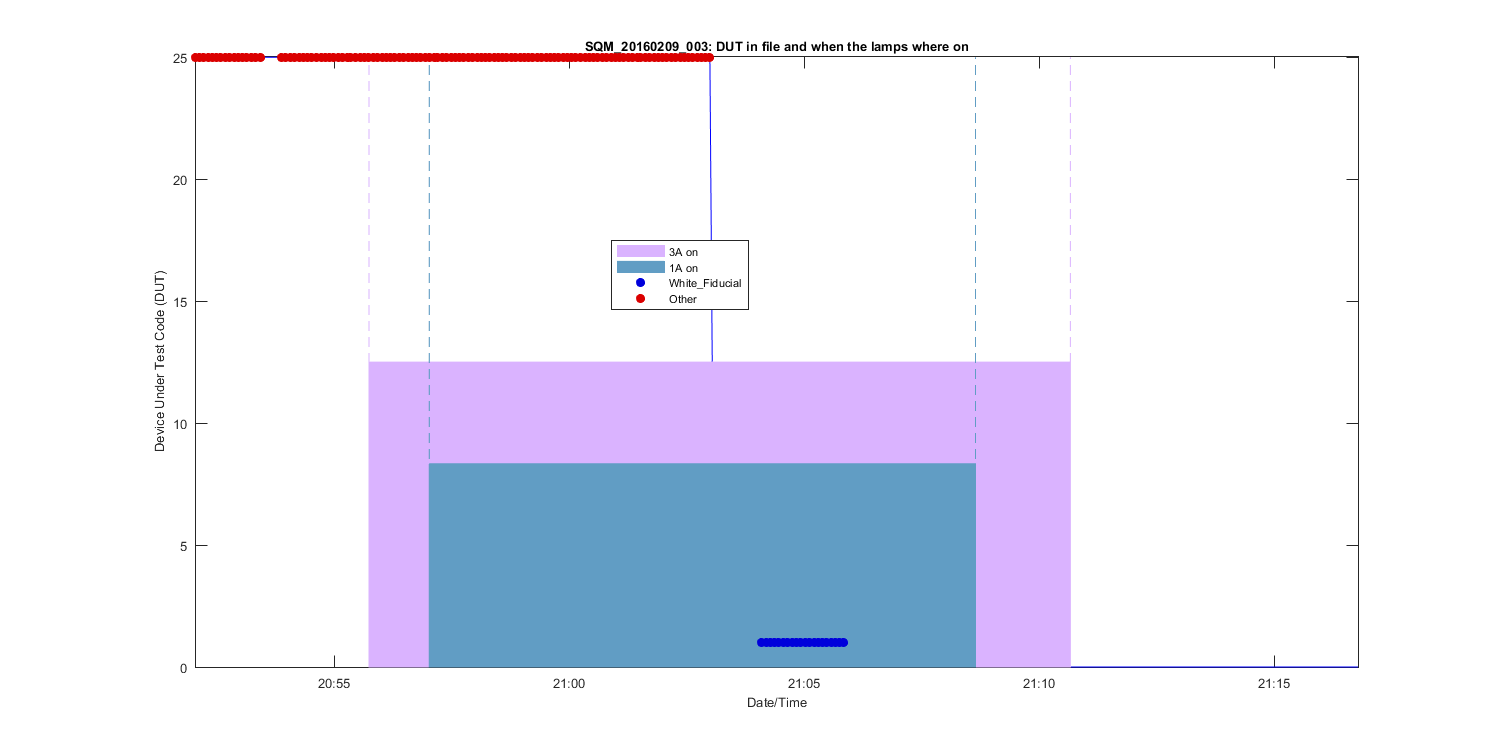
Figure 5
Figure 6
Figure 7
Figure 8
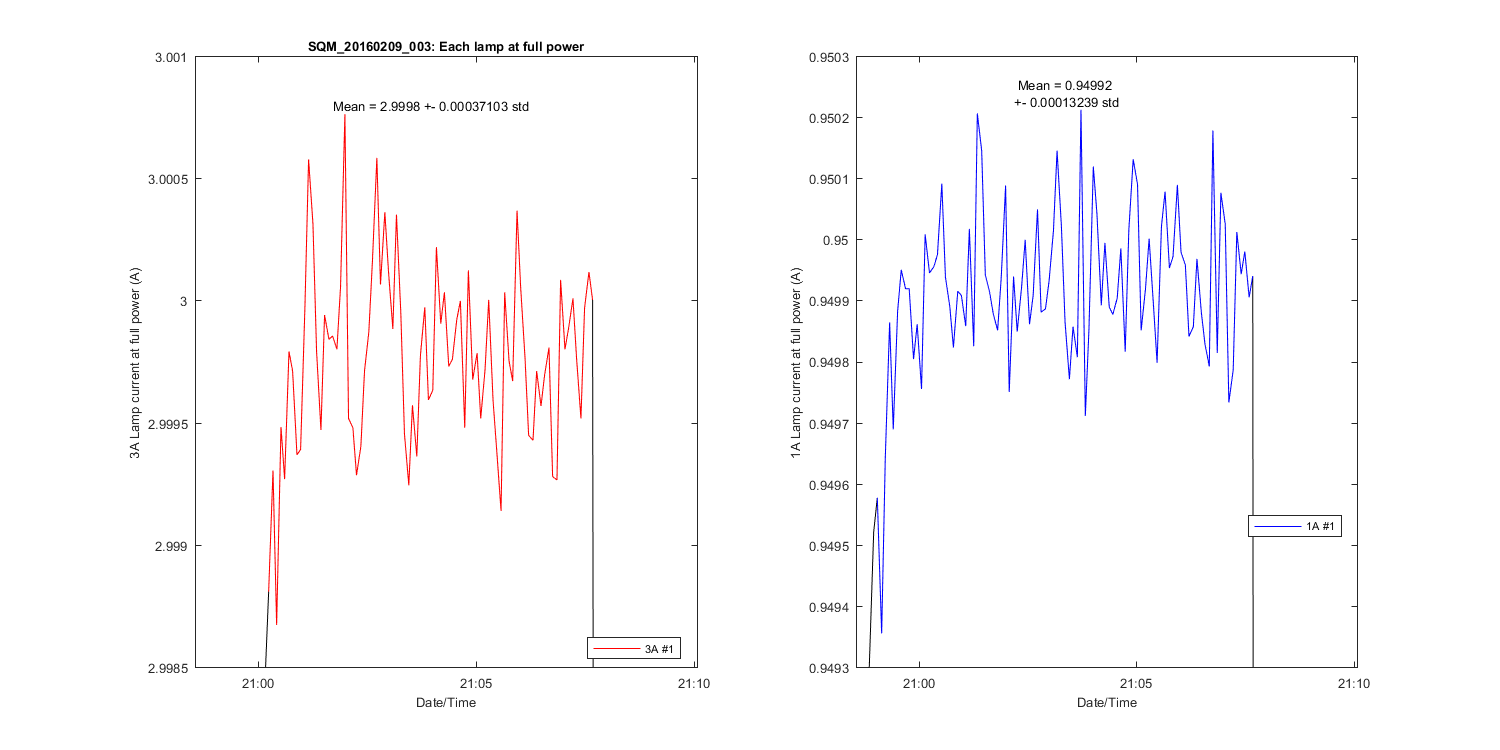
Figure 9
Figure 10