| Description | Value or Code |
|---|---|
| Cruise_Name:, Vaux(12,:) | NIST |
| Cruise_Number | 2016-001 |
| Investigator:: Vaux(16,:) | Carol Johnson |
| Location_of_Measurement: Vaux(17,:) | NIST B019_221 |
| Purpose: Vaux(18,:) | Testing |
| MOBY_NET_Sequence_Position: Vaux(20,:) | Calibration Facility |
| Ambient_Air_Temp (deg C) | 23.5 |
| Relative_Humidity (%) | 21.3 |
| #_of_Levels | 1 |
| Time_Step (sec) | 10 |
| Initial lamp state: Vaux(40,:) | All Off |
| Time_adjustment_to_GMT | 0 |
| Time_of_Last_Servicing | 20151218 |
| SQM_120VAC_On | 20160217.160030 |
| SQM_Off_to_Standby | 20160217.161025 |
| SQM_Standby_to_Off | 20160217.162905 |
| SQM_120VAC_Off | 20160217.175200 |
| Lamp 1 A burn hours | 0.17806 |
| Lamp 3 A burn hours | 0.21306 |
| DAQ_Program_Version | 0 |
| File Format Version | 2 |
| DAQ_Computer: Vaux(60,:) | EOS EQUIP 12 |
| DAQ_Program_Name: Vaux(61,:) | SQM Monitor_2.0.vi |
|
All Devices Under Test in the DUT column in DATA: DUT_Other {a mock up of the CAS foreoptic idea, window, lens, fiber} |
|
ASCII SQM file data: SQM_20160217_001.txt
ASCII SQM file data: PDF log file
| Lamp | On/Off # | N | Time on (hrs) | Mean (meas./set) | std | %std |
|---|---|---|---|---|---|---|
| Lamp 1A | 1 | 46 | 0.13139 | 0.94991 / 0.95 | 0.00016104 | 0.016953 |
| Lamp 3A | 1 | 34 | 0.096389 | 3.0001 / 3 | 0.0012124 | 0.040411 |
| Level | PD internal monitor (V) | Level Change # | Mean | std | %std |
|---|---|---|---|---|---|
| High (1A & 3A) | Red | 1 | 1.4591 | 0.42604 | 29.199 |
| High (1A & 3A) | White | 1 | 1.5761 | 0.47971 | 27.0313 |
| High (1A & 3A) | Blue | 1 | 1.4718 | 0.47655 | 28.9472 |
| Level | Temperature (C) | Level Change # | Mean | std | %std |
|---|---|---|---|---|---|
| High (1A & 3A) | PD | 1 | 34.9813 | 0.10218 | 0.29209 |
Red PD (max value): 1.6628: #of possible satureated values 0
White PD (max value): 1.8118: #of possible satureated values 0
Blue PD (max value): 1.7141: #of possible satureated values 0
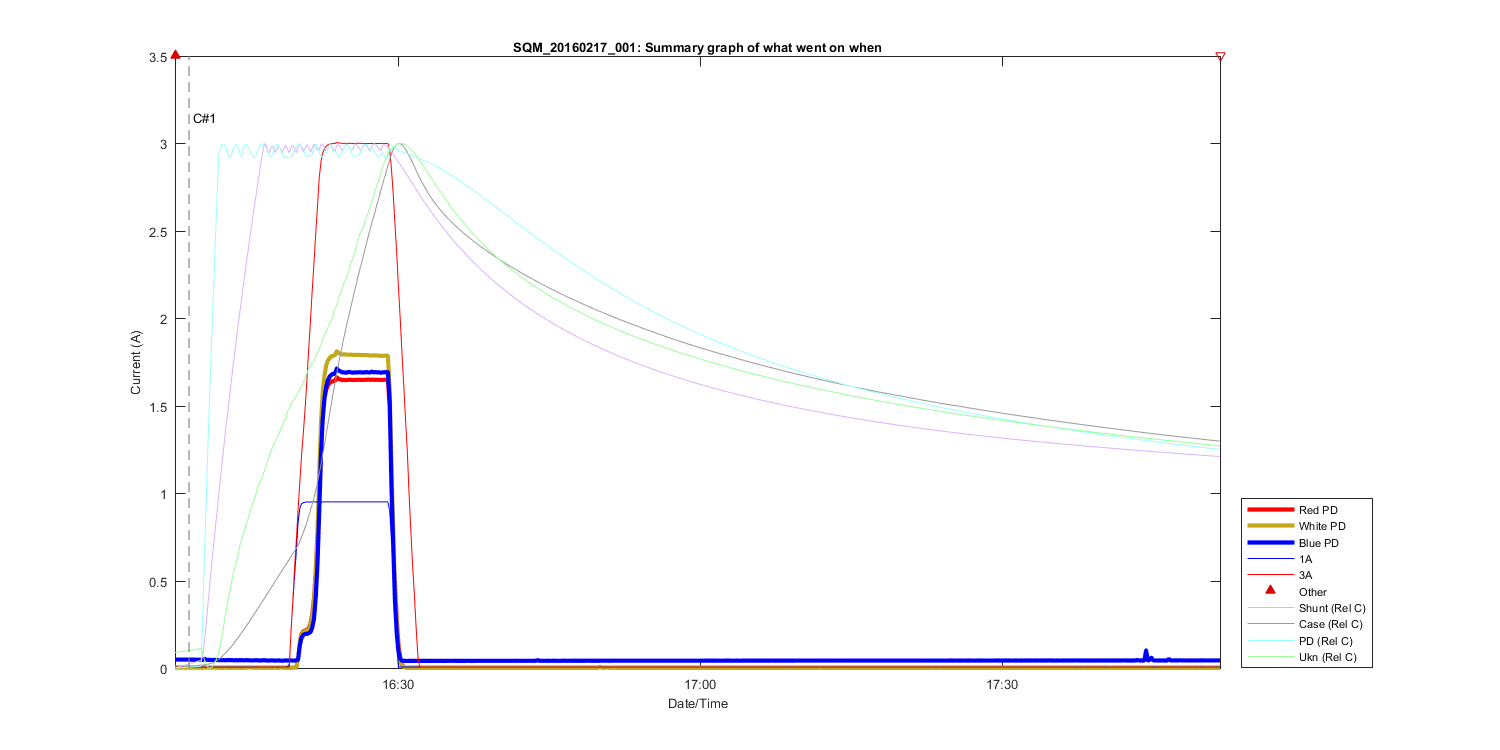
Figure 1
Summary Graph showing all measurements taken in this file, including auxilliary temperature measurements and comments. The text C# shows what time in the file the comments (shown above where made). The triangles at the top of the figure shows then a DUT (Device under test) was placed in front of the SQM and removed.
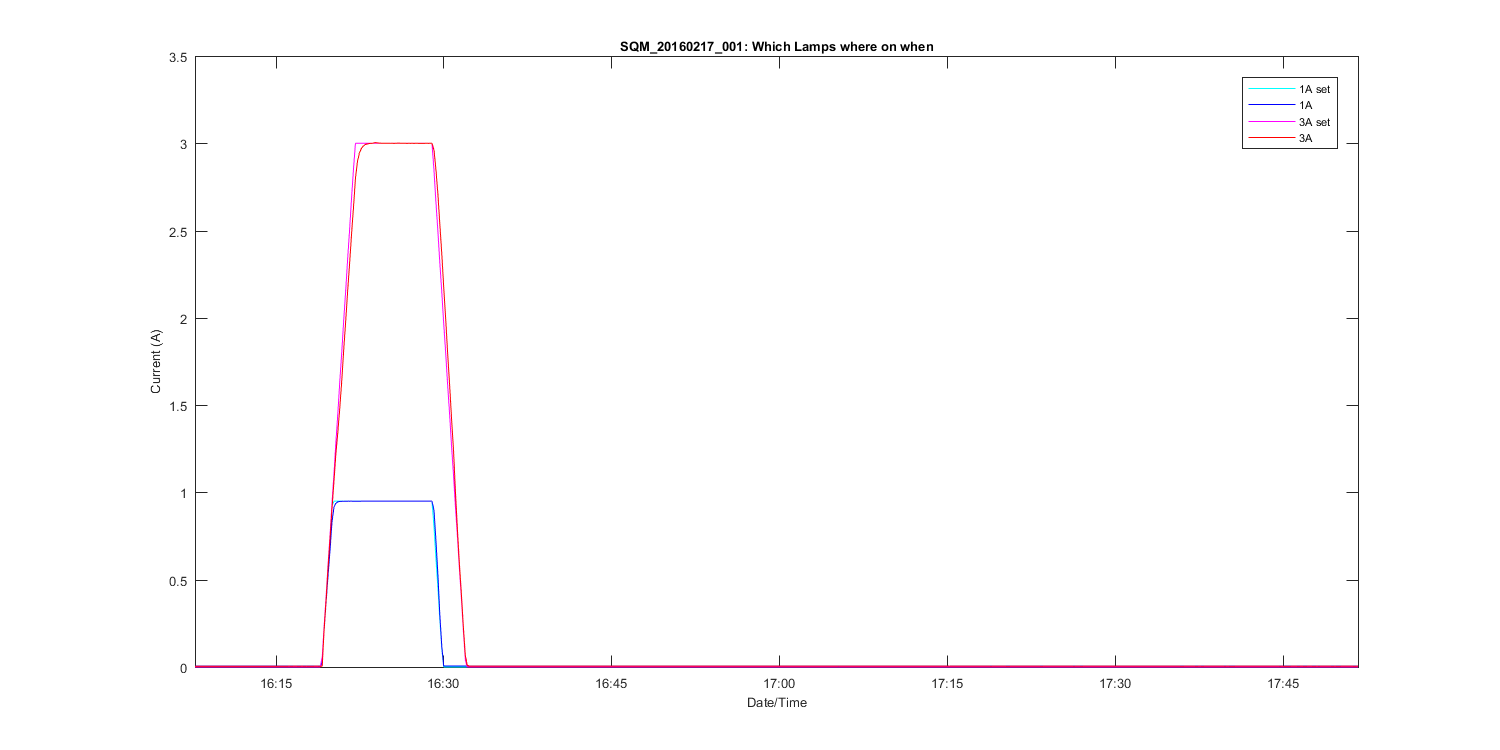
Figure 2
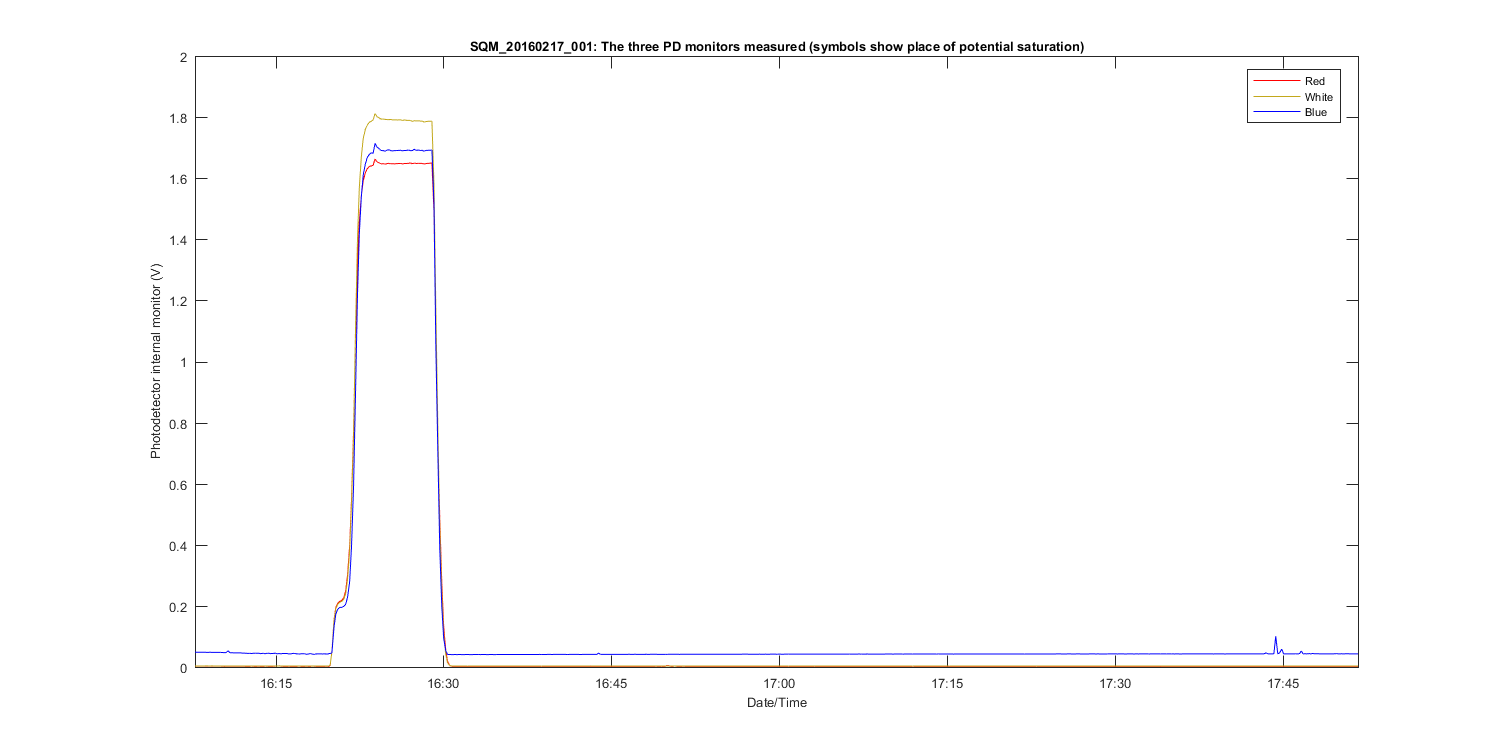
Figure 3
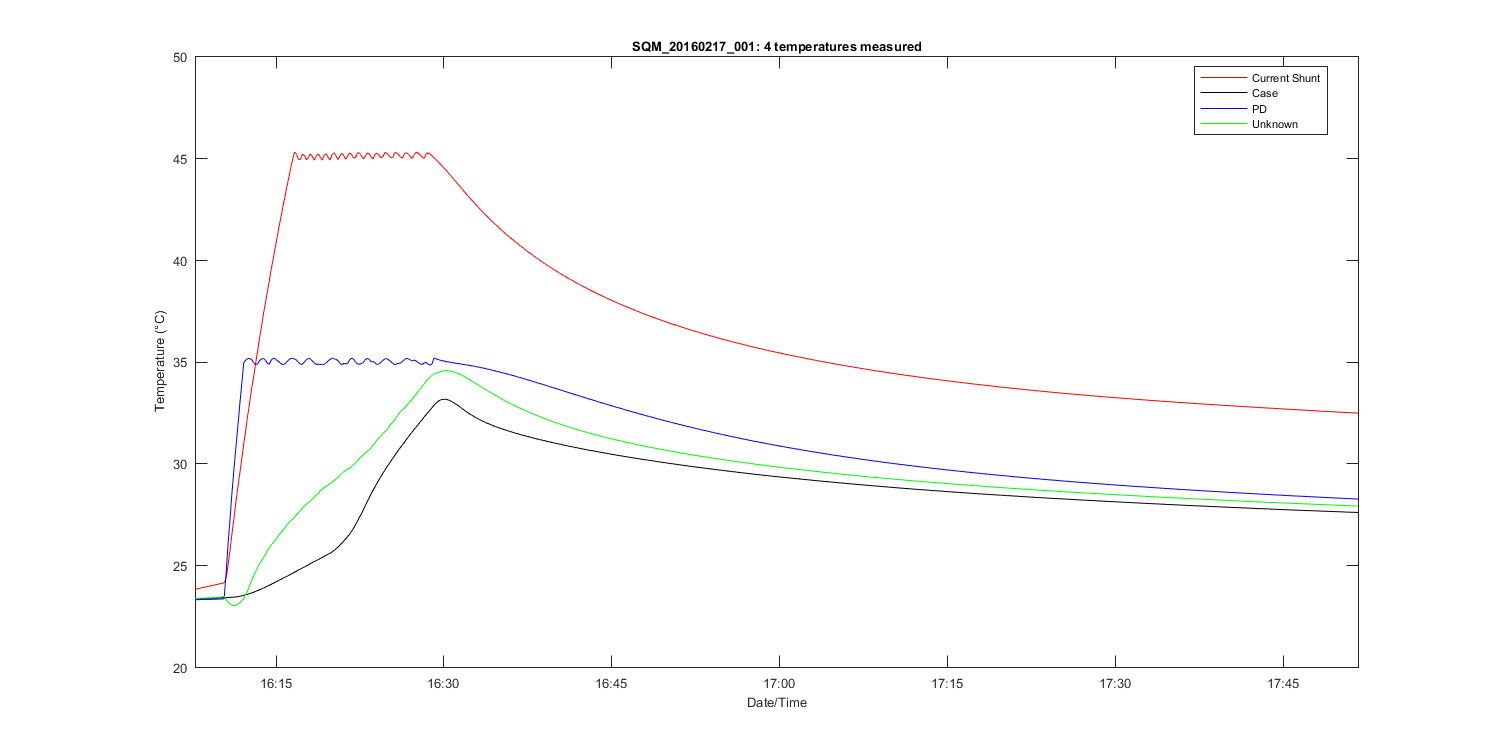
Figure 4
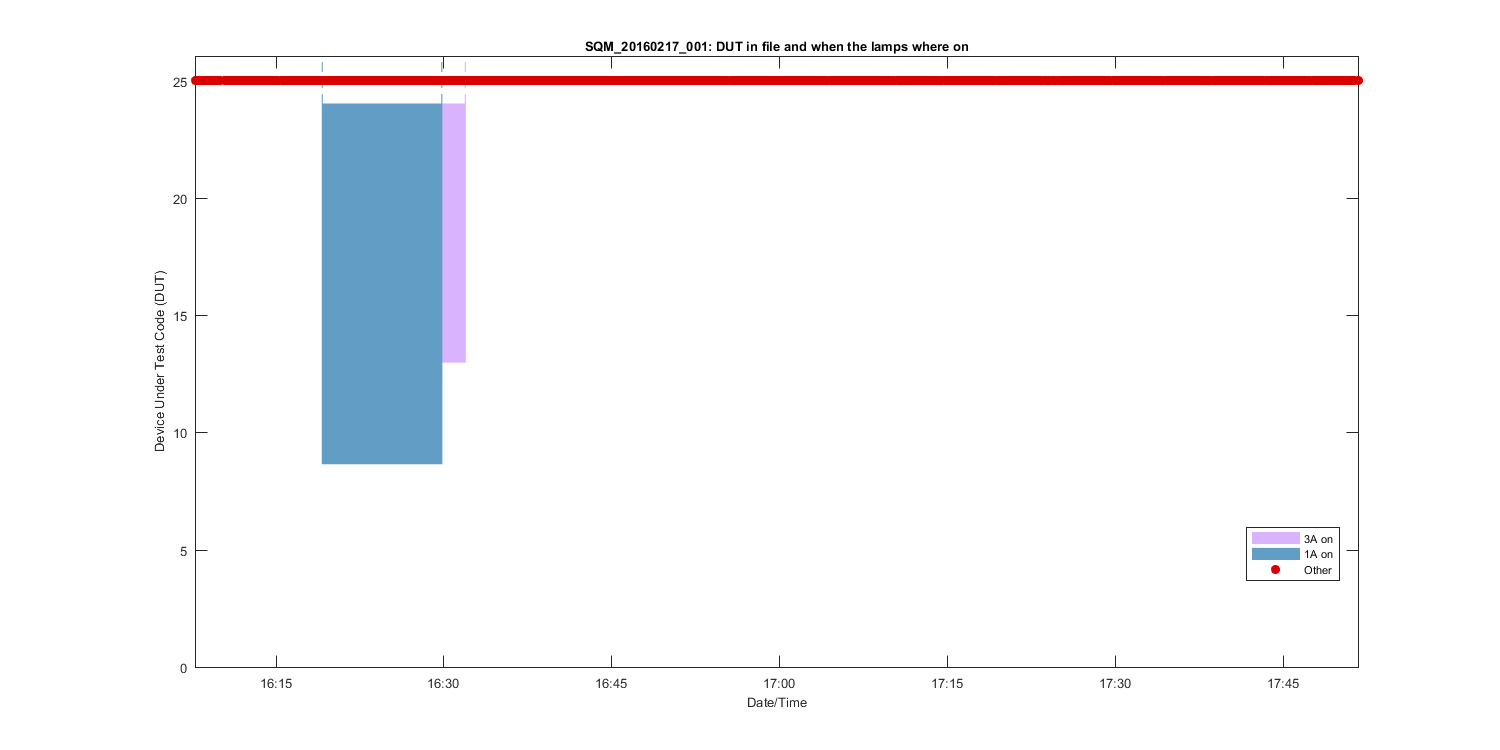
Figure 5
Figure 6
Figure 7
Figure 8
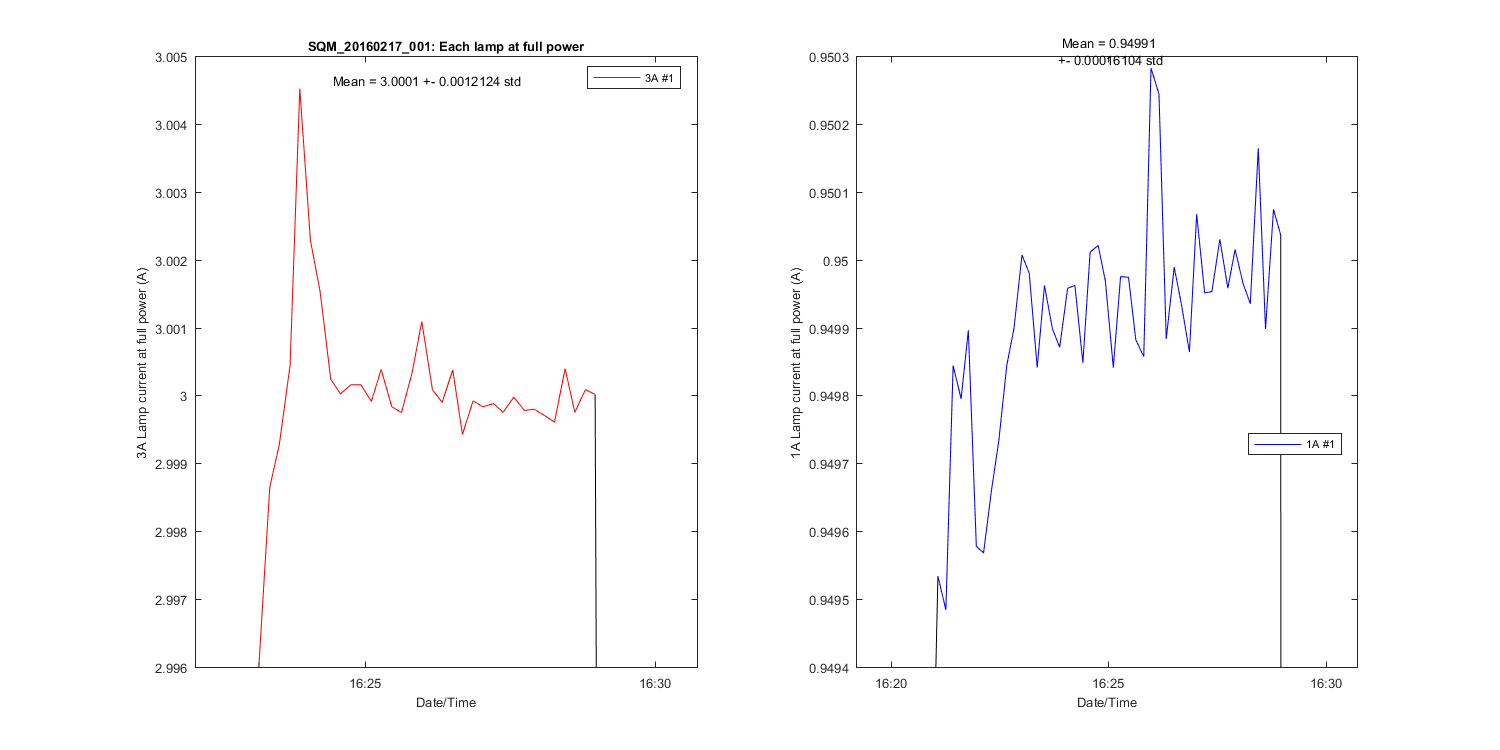
Figure 9
Figure 10