| Description | Value or Code |
|---|---|
| Cruise_Name:, Vaux(12,:) | NIST |
| Cruise_Number | 2016-001 |
| Investigator:: Vaux(16,:) | Carol Johnson |
| Location_of_Measurement: Vaux(17,:) | NIST B019_221 |
| Purpose: Vaux(18,:) | Testing |
| MOBY_NET_Sequence_Position: Vaux(20,:) | Calibration Facility |
| Ambient_Air_Temp (deg C) | 24.5 |
| Relative_Humidity (%) | 21.7 |
| #_of_Levels | 1 |
| Time_Step (sec) | 10 |
| Initial lamp state: Vaux(40,:) | All Off |
| Time_adjustment_to_GMT | 0 |
| Time_of_Last_Servicing | 20151218 |
| SQM_120VAC_On | 20161202.212100 |
| SQM_Off_to_Standby | 20161202.212900 |
| SQM_Standby_to_Off | 20161202.220700 |
| SQM_120VAC_Off | 20161202.220847 |
| Lamp 1 A burn hours | 0.54528 |
| Lamp 3 A burn hours | 0.57444 |
| DAQ_Program_Version | 0 |
| File Format Version | 2 |
| DAQ_Computer: Vaux(60,:) | EOS EQUIP 13 |
| DAQ_Program_Name: Vaux(61,:) | SQM Monitor_2.0.vi |
|
All Devices Under Test in the DUT column in DATA: DUT_White_Fiducial |
|
ASCII SQM file data: SQM_20161202_002.txt
ASCII SQM file data: PDF log file
| Lamp | On/Off # | N | Time on (hrs) | Mean (meas./set) | std | %std |
|---|---|---|---|---|---|---|
| Lamp 1A | 1 | 170 | 0.49556 | 0.94996 / 0.95 | 0.00013337 | 0.014039 |
| Lamp 3A | 1 | 157 | 0.4575 | 2.9998 / 3 | 0.0010809 | 0.036031 |
| Level | PD internal monitor (V) | Level Change # | Mean | std | %std |
|---|---|---|---|---|---|
| High (1A & 3A) | Red | 2 | 0.84839 | 0.61715 | 72.7439 |
| High (1A & 3A) | White | 2 | 0.88712 | 0.66625 | 69.5682 |
| High (1A & 3A) | Blue | 2 | 1.9371 | 0.65375 | 31.8594 |
| Level | Temperature (C) | Level Change # | Mean | std | %std |
|---|---|---|---|---|---|
| High (1A & 3A) | PD | 2 | 34.99 | 0.11323 | 0.32362 |
Red PD (max value): 2.4838: #of possible satureated values 88
White PD (max value): 2.2681: #of possible satureated values 91
Blue PD (max value): 2.4992: #of possible satureated values 0
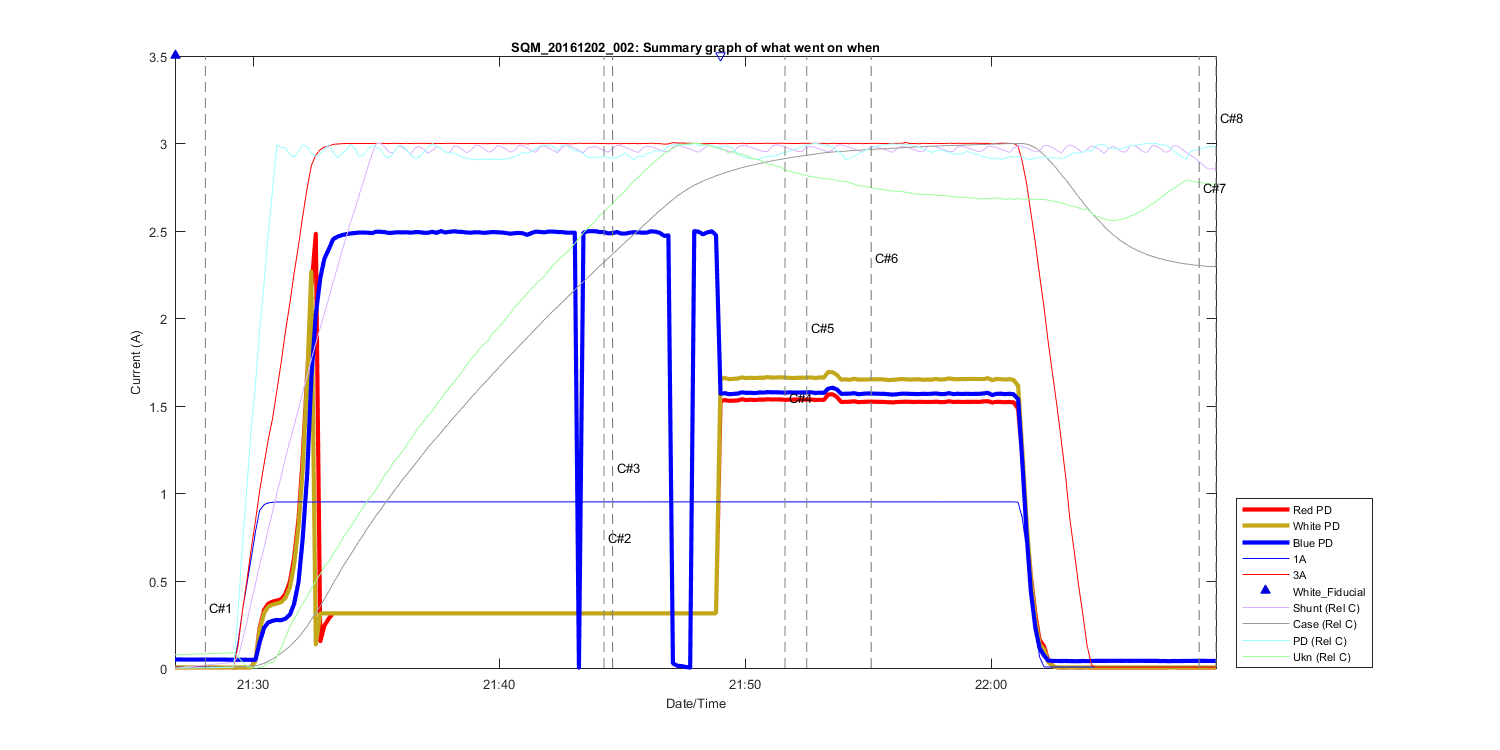
Figure 1
Summary Graph showing all measurements taken in this file, including auxilliary temperature measurements and comments. The text C# shows what time in the file the comments (shown above where made). The triangles at the top of the figure shows then a DUT (Device under test) was placed in front of the SQM and removed.
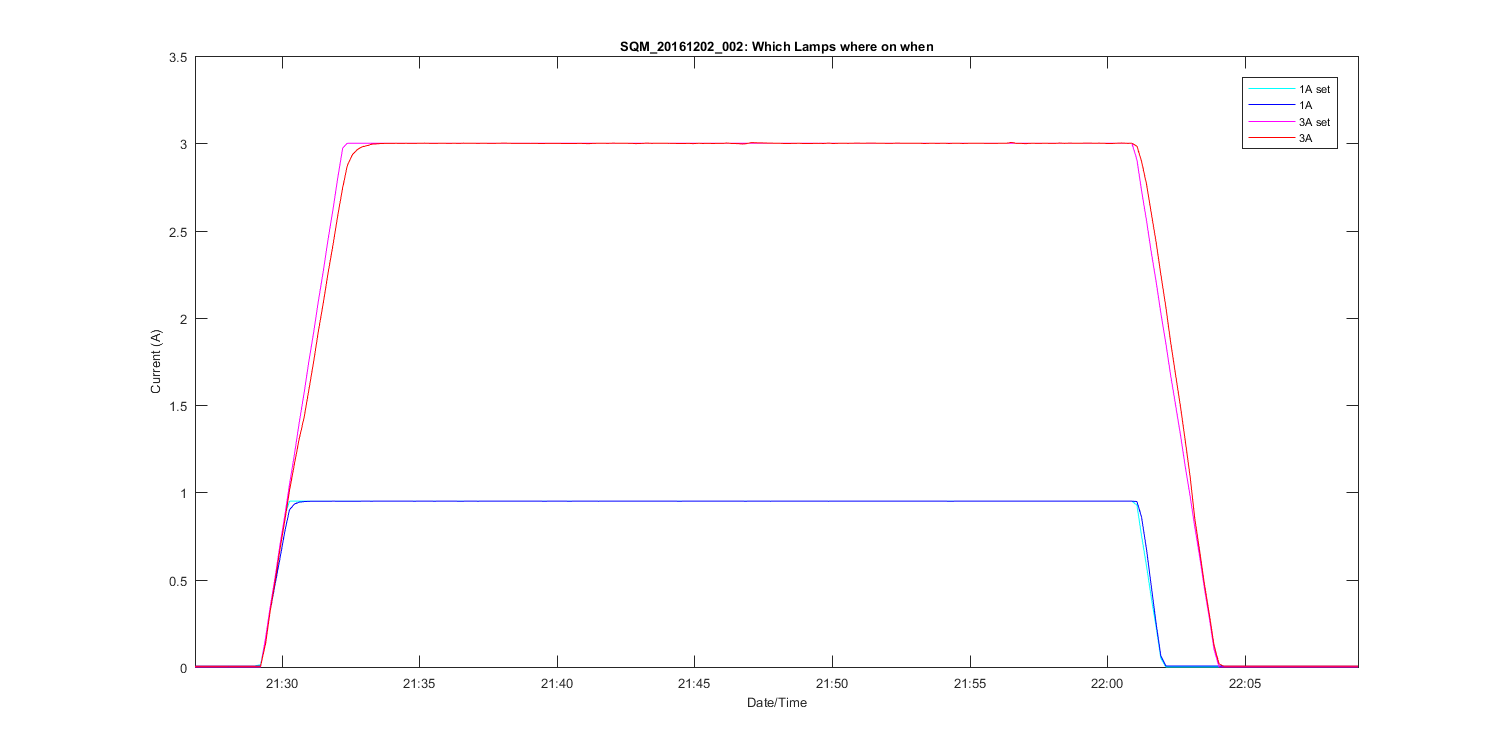
Figure 2
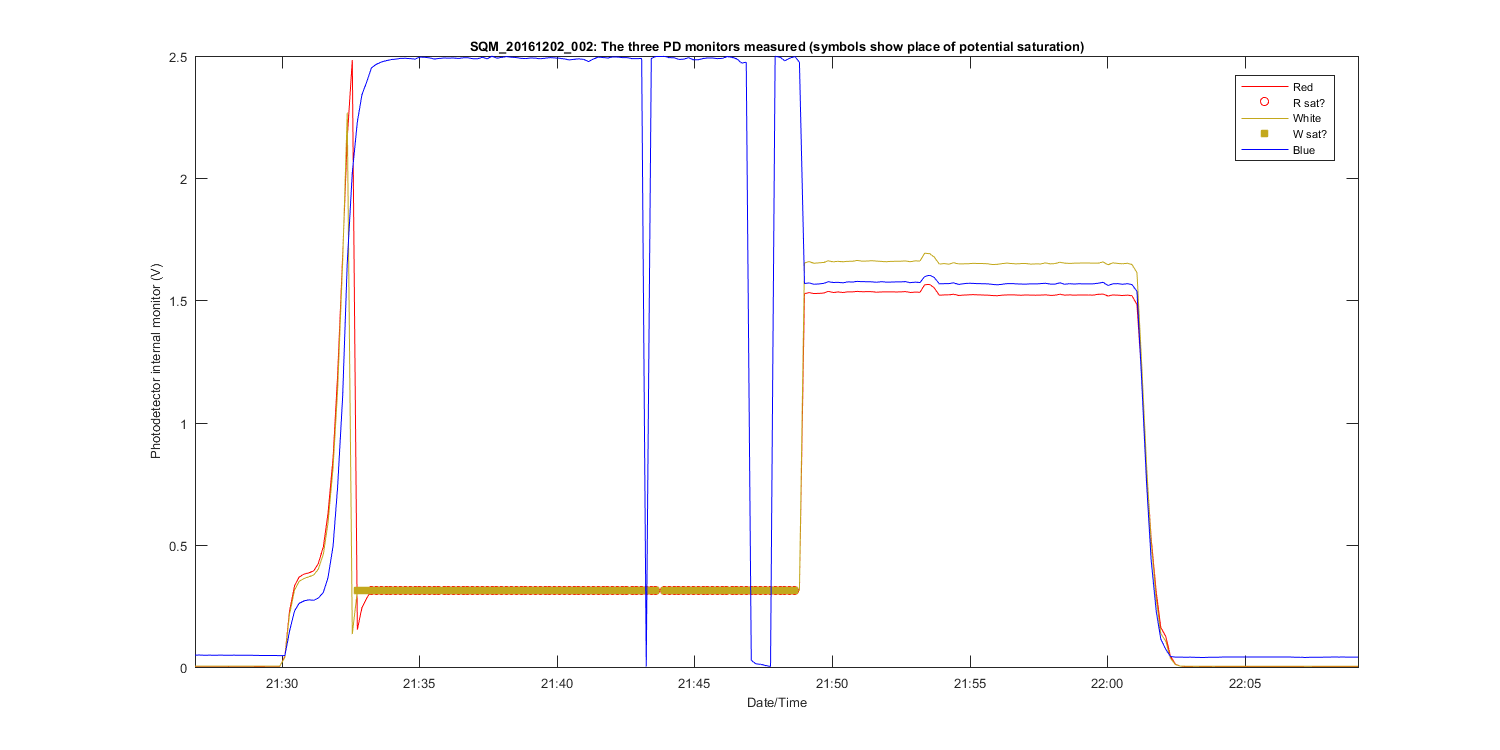
Figure 3
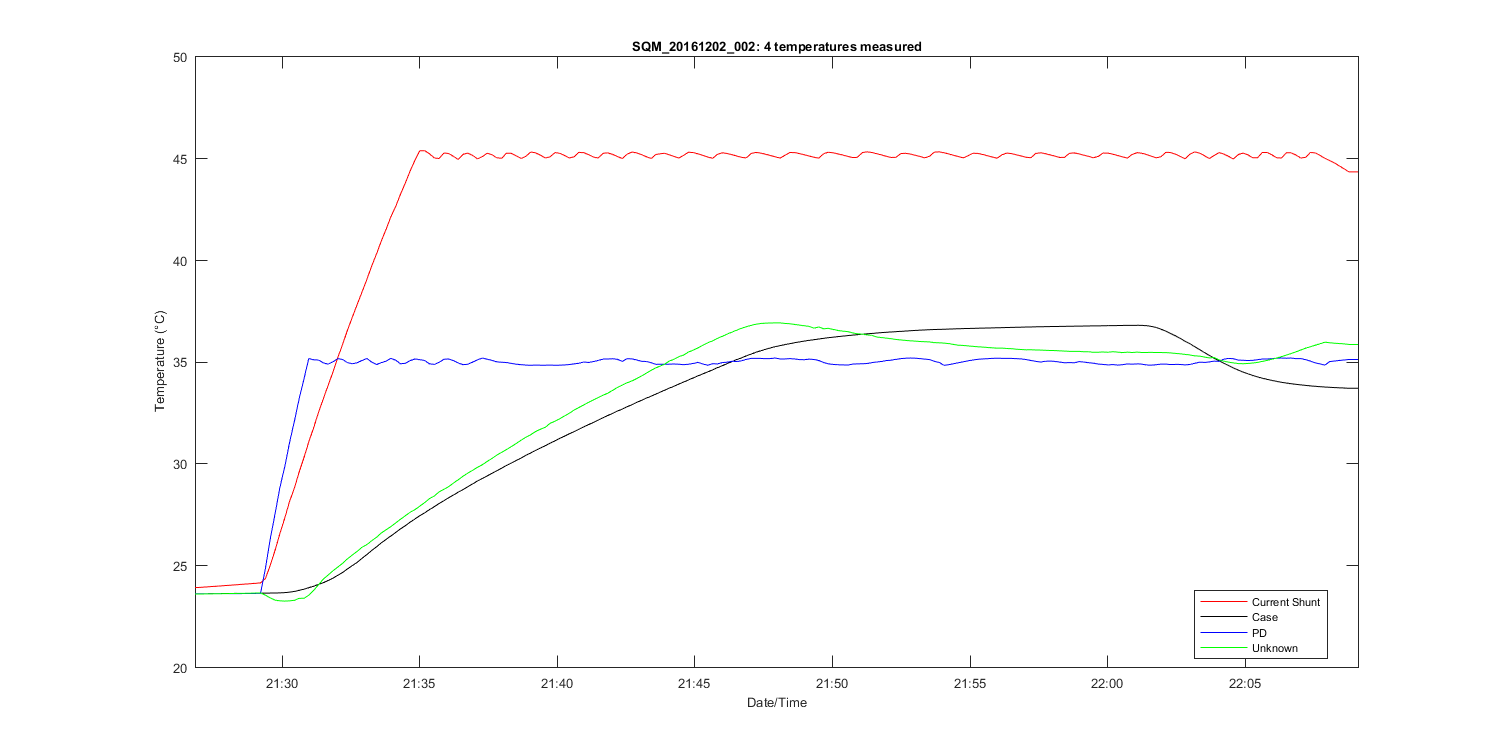
Figure 4
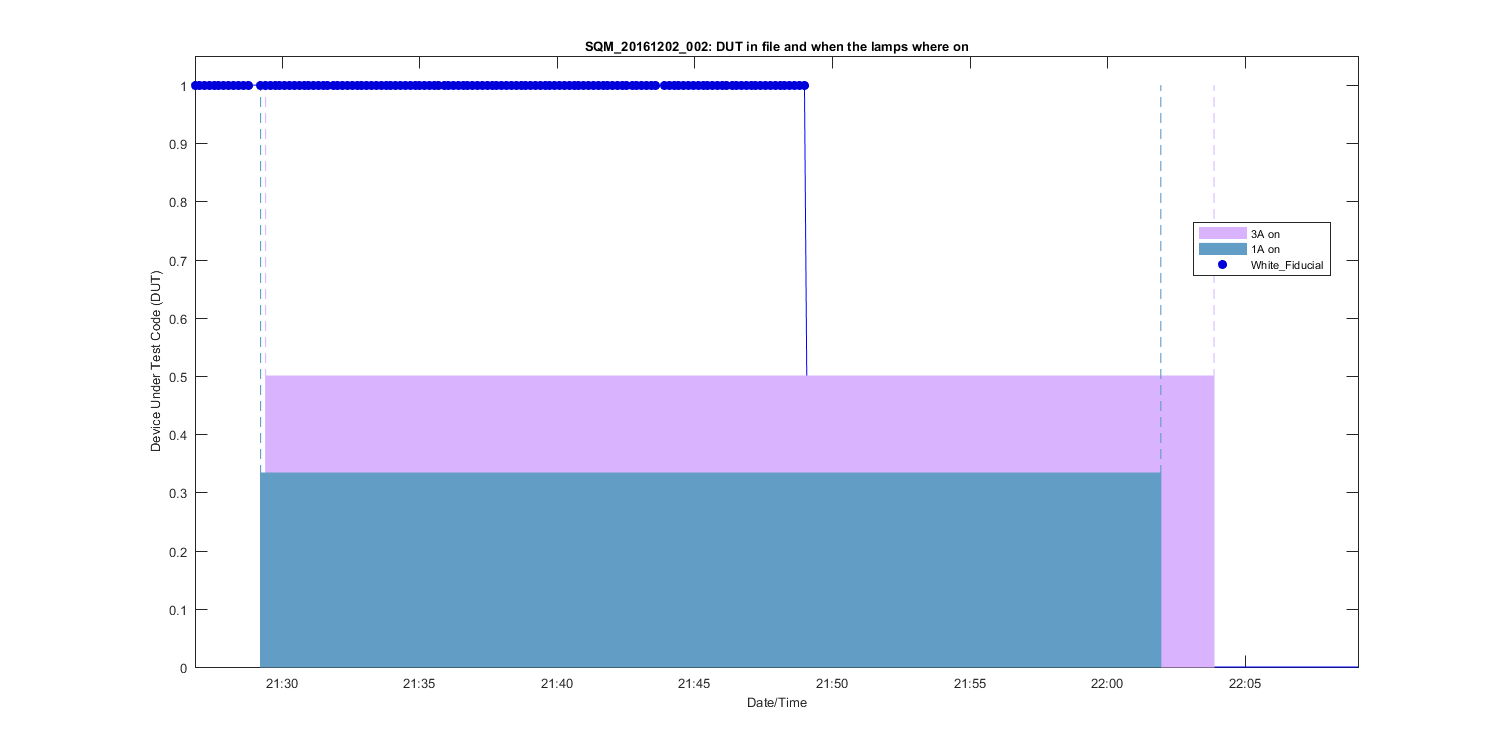
Figure 5
Figure 6
Figure 7
Figure 8
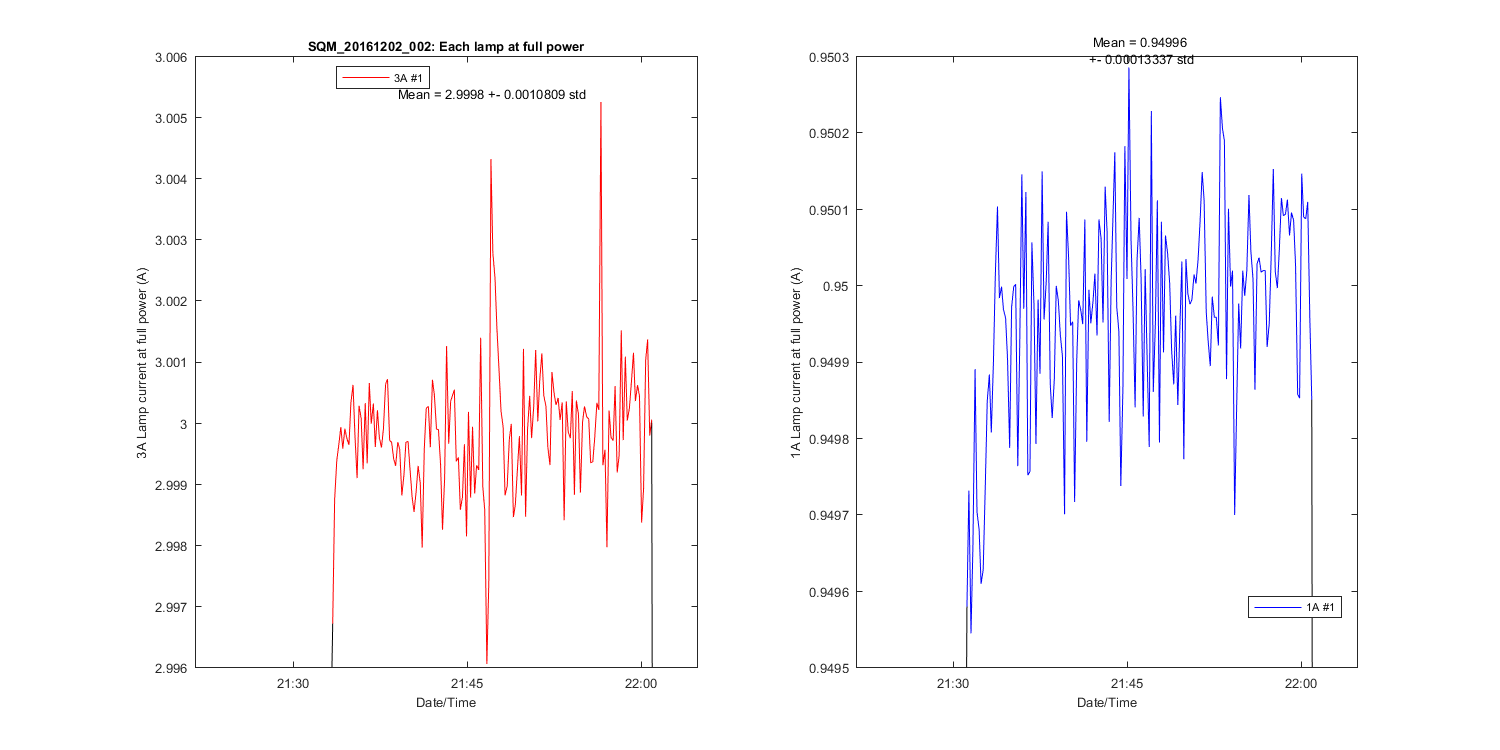
Figure 9
Figure 10