| Description | Value or Code |
|---|---|
| Cruise_Name:, Vaux(12,:) | NIST |
| Cruise_Number | 2016-001 |
| Investigator:: Vaux(16,:) | Carol Johnson |
| Location_of_Measurement: Vaux(17,:) | NIST B019_221 |
| Purpose: Vaux(18,:) | Testing |
| MOBY_NET_Sequence_Position: Vaux(20,:) | Calibration Facility |
| Ambient_Air_Temp (deg C) | 24.3 |
| Relative_Humidity (%) | 18 |
| #_of_Levels | 2 |
| Time_Step (sec) | 10 |
| Initial lamp state: Vaux(40,:) | All Off |
| Time_adjustment_to_GMT | 0 |
| Time_of_Last_Servicing | 20151218 |
| SQM_120VAC_On | 20161208.184800 |
| SQM_Off_to_Standby | 20161208.185211 |
| SQM_Standby_to_Off | 20161208.222719 |
| SQM_120VAC_Off | 20161208.222800 |
| Lamp 1 A burn hours | 2.0203 |
| Lamp 3 A burn hours | 3.2033 |
| DAQ_Program_Version | 0 |
| File Format Version | 2 |
| DAQ_Computer: Vaux(60,:) | EOS EQUIP 13 |
| DAQ_Program_Name: Vaux(61,:) | SQM Monitor_2.0.vi |
|
All Devices Under Test in the DUT column in DATA: DUT_Net_CAS_Lu |
|
ASCII SQM file data: SQM_20161208_001.txt
ASCII SQM file data: PDF log file
| Lamp | On/Off # | N | Time on (hrs) | Mean (meas./set) | std | %std |
|---|---|---|---|---|---|---|
| Lamp 1A | 1 | 674 | 1.9653 | 0.95 / 0.95 | 0.00011581 | 0.01219 |
| Lamp 1A | 2 | 0 | NaN | NaN / NaN | NaN | NaN |
| Lamp 3A | 1 | 1055 | 3.0778 | 3 / 3 | 0.00065563 | 0.021854 |
| Level | PD internal monitor (V) | Level Change # | Mean | std | %std |
|---|---|---|---|---|---|
| High (1A & 3A) | Red | 2 | 1.525 | 0.19177 | 12.575 |
| High (1A & 3A) | White | 2 | 1.6553 | 0.21217 | 11.5851 |
| High (1A & 3A) | Blue | 2 | 1.5636 | 0.2051 | 12.2647 |
| Medium (3A) | Red | 3 | 1.35 | 0.0045011 | 0.33342 |
| Medium (3A) | White | 3 | 1.4889 | 0.0038543 | 0.30231 |
| Medium (3A) | Blue | 3 | 1.4412 | 0.0042708 | 0.31231 |
| Level | Temperature (C) | Level Change # | Mean | std | %std |
|---|---|---|---|---|---|
| High (1A & 3A) | PD | 2 | 34.9653 | 0.1164 | 0.33291 |
| Medium (3A) | PD | 3 | 34.9913 | 0.11331 | 0.32382 |
Red PD (max value): 1.5618: #of possible satureated values 0
White PD (max value): 1.7034: #of possible satureated values 0
Blue PD (max value): 1.6073: #of possible satureated values 0
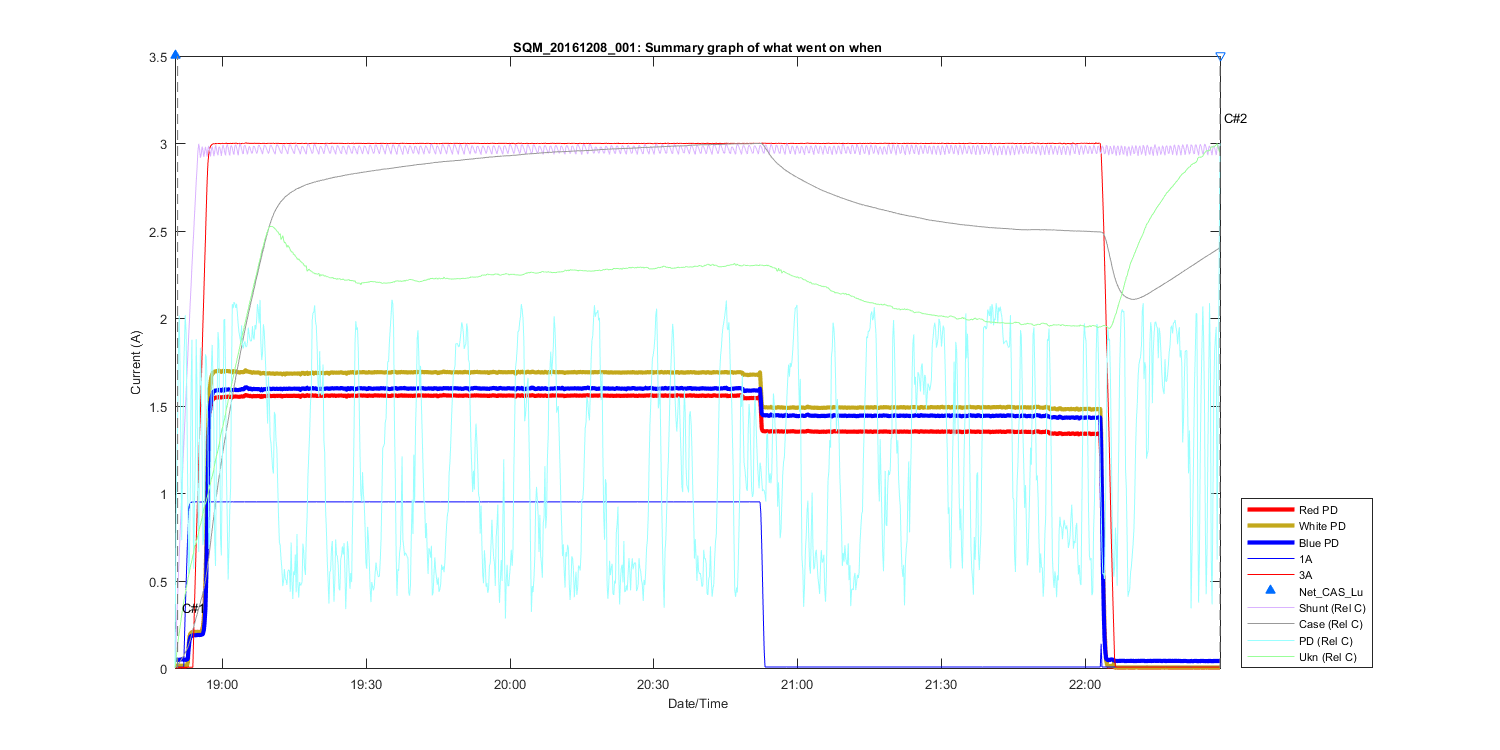
Figure 1
Summary Graph showing all measurements taken in this file, including auxilliary temperature measurements and comments. The text C# shows what time in the file the comments (shown above where made). The triangles at the top of the figure shows then a DUT (Device under test) was placed in front of the SQM and removed.
Figure 2
Figure 3
Figure 4
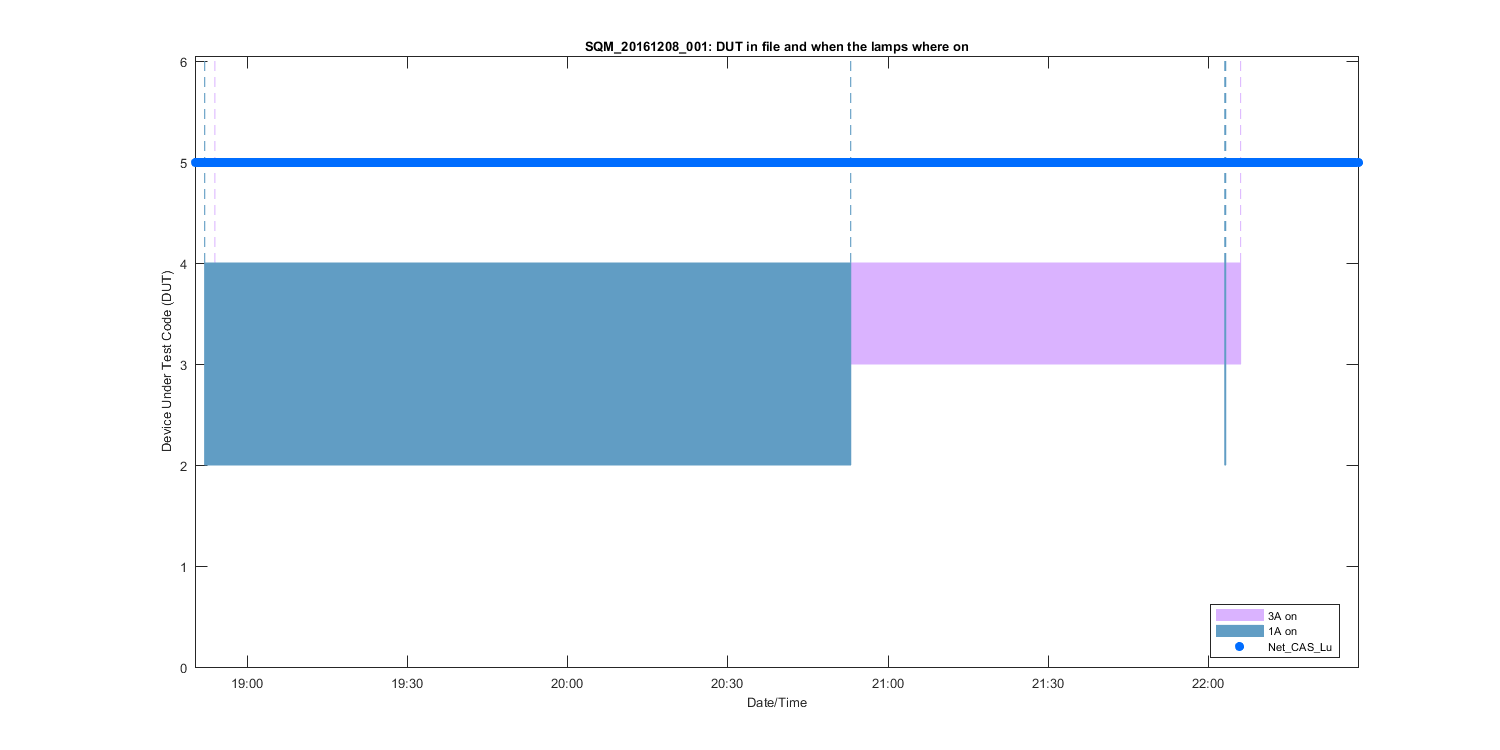
Figure 5
Figure 6
Figure 7
Figure 8
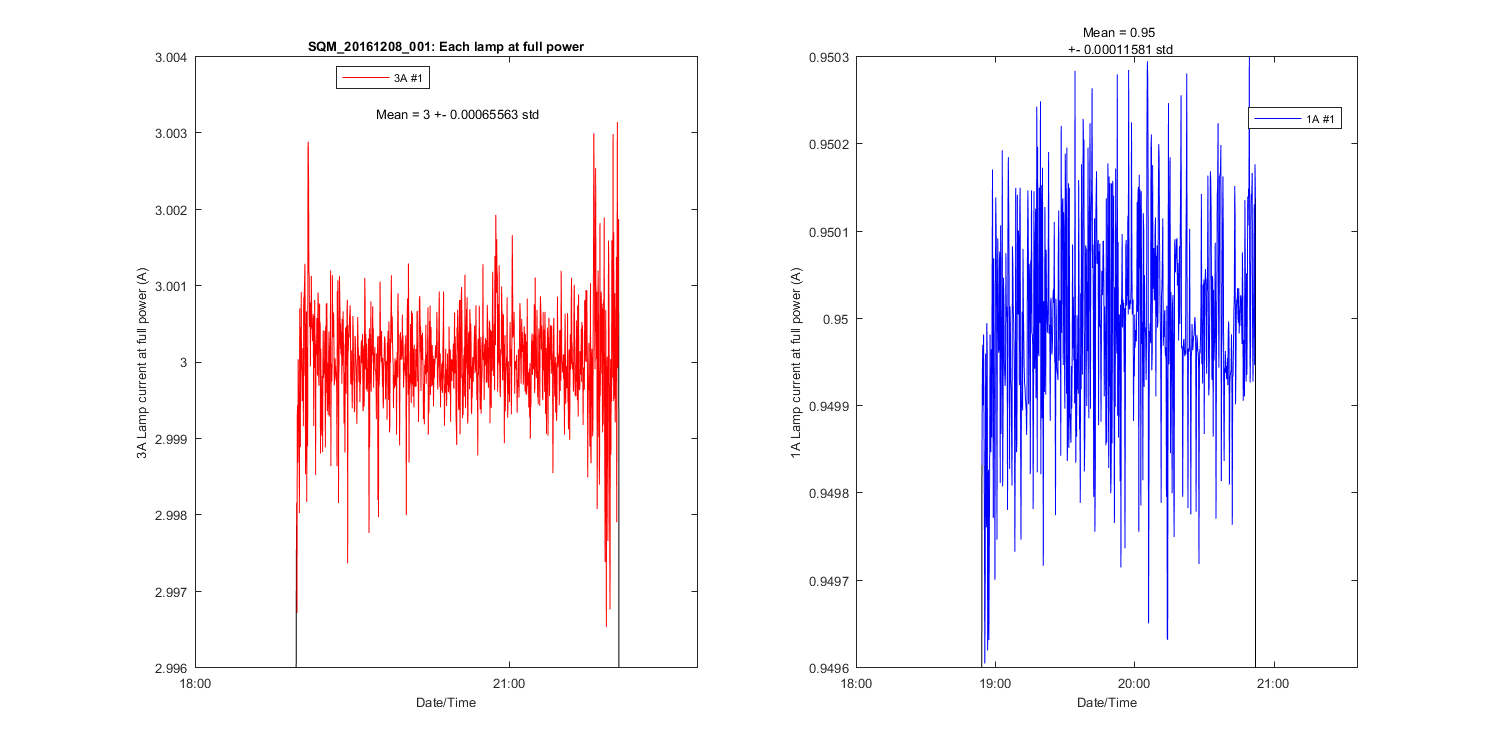
Figure 9
Figure 10