| Description | Value or Code |
|---|---|
| Cruise_Name:, Vaux(12,:) | NIST |
| Cruise_Number | 2016-001 |
| Investigator:: Vaux(16,:) | Carol Johnson |
| Location_of_Measurement: Vaux(17,:) | NIST B019_221 |
| Purpose: Vaux(18,:) | Testing |
| MOBY_NET_Sequence_Position: Vaux(20,:) | Calibration Facility |
| Ambient_Air_Temp (deg C) | 24.1 |
| Relative_Humidity (%) | 21.5 |
| #_of_Levels | 4 |
| Time_Step (sec) | 10 |
| Initial lamp state: Vaux(40,:) | All Off |
| Time_adjustment_to_GMT | 0 |
| Time_of_Last_Servicing | 20151218 |
| SQM_120VAC_On | 20161213.142000 |
| SQM_Off_to_Standby | 20161213.142730 |
| SQM_Standby_to_Off | 20161213.200936 |
| SQM_120VAC_Off | 20161213.201400 |
| Lamp 1 A burn hours | 2.6019 |
| Lamp 3 A burn hours | 4.2586 |
| DAQ_Program_Version | 0 |
| File Format Version | 2 |
| DAQ_Computer: Vaux(60,:) | EOS EQUIP 13 |
| DAQ_Program_Name: Vaux(61,:) | SQM Monitor_2.0.vi |
|
All Devices Under Test in the DUT column in DATA: DUT_Net_CAS_Lu |
|
ASCII SQM file data: SQM_20161213_001.txt
ASCII SQM file data: PDF log file
| Lamp | On/Off # | N | Time on (hrs) | Mean (meas./set) | std | %std |
|---|---|---|---|---|---|---|
| Lamp 1A | 1 | 485 | 1.4133 | 0.95 / 0.95 | 0.0001162 | 0.012231 |
| Lamp 1A | 2 | 376 | 1.095 | 0.94999 / 0.95 | 0.000119 | 0.012526 |
| Lamp 3A | 1 | 1416 | 4.1319 | 3 / 3 | 0.00052832 | 0.017611 |
| Level | PD internal monitor (V) | Level Change # | Mean | std | %std |
|---|---|---|---|---|---|
| Low (1A) | Red | 1 | 0.20793 | 0.0017544 | 0.84375 |
| Low (1A) | White | 1 | 0.20284 | 0.0030197 | 0.86494 |
| Low (1A) | Blue | 1 | 0.18885 | 0.0031601 | 0.929 |
| Medium (3A) | Red | 3 | 1.3521 | 0.0019003 | 0.14054 |
| Medium (3A) | White | 3 | 1.4903 | 0.0039451 | 0.12752 |
| Medium (3A) | Blue | 3 | 1.4434 | 0.0022727 | 0.13166 |
| High (1A & 3A) | Red | 4 | 1.5535 | 0.024518 | 1.5782 |
| High (1A & 3A) | White | 4 | 1.6875 | 0.02399 | 1.453 |
| High (1A & 3A) | Blue | 4 | 1.5961 | 0.01936 | 1.5361 |
| Level | Temperature (C) | Level Change # | Mean | std | %std |
|---|---|---|---|---|---|
| Low (1A) | PD | 1 | 35.0089 | 0.10916 | 0.31182 |
| Medium (3A) | PD | 3 | 34.9778 | 0.11133 | 0.31829 |
| High (1A & 3A) | PD | 4 | 34.9564 | 0.11652 | 0.33333 |
Red PD (max value): 1.5613: #of possible satureated values 0
White PD (max value): 1.697: #of possible satureated values 0
Blue PD (max value): 1.6044: #of possible satureated values 0
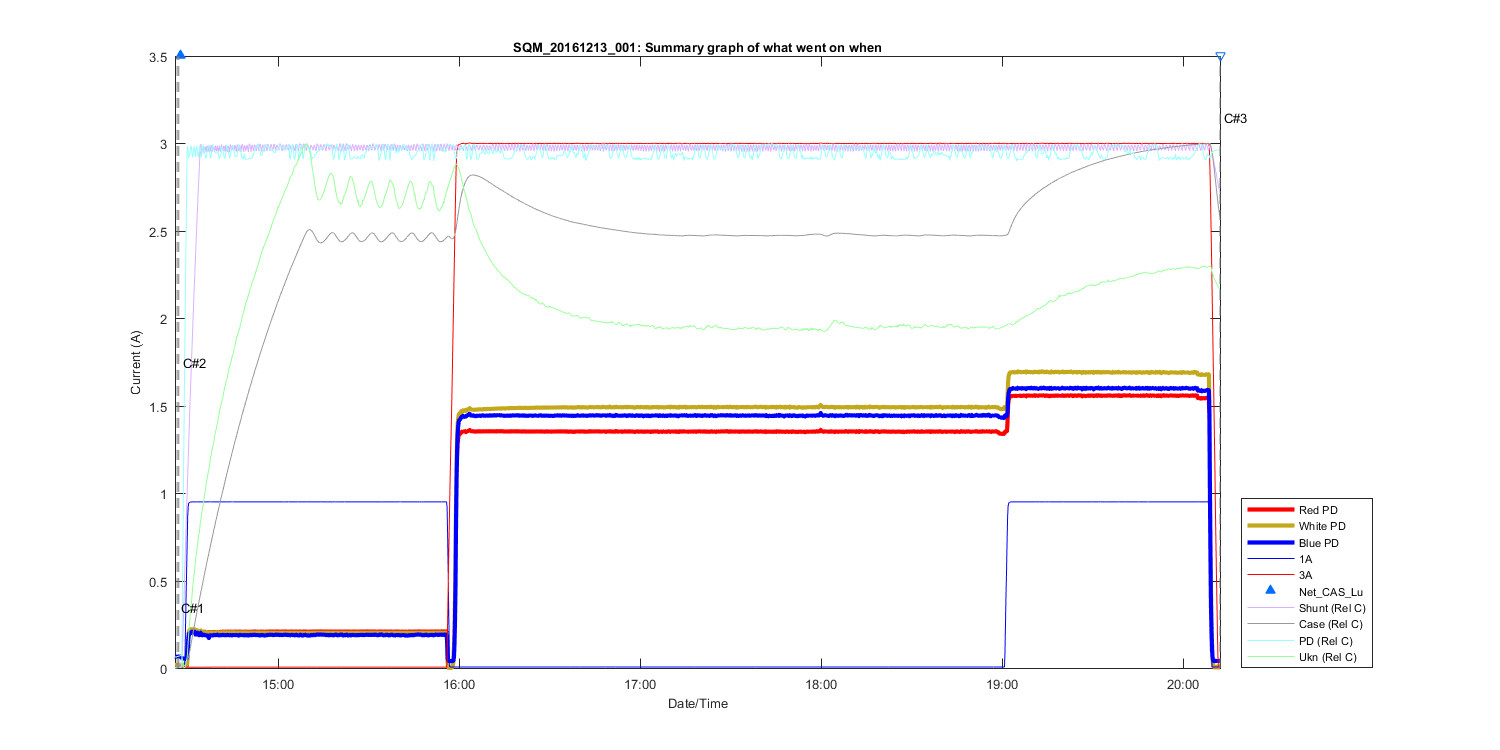
Figure 1
Summary Graph showing all measurements taken in this file, including auxilliary temperature measurements and comments. The text C# shows what time in the file the comments (shown above where made). The triangles at the top of the figure shows then a DUT (Device under test) was placed in front of the SQM and removed.
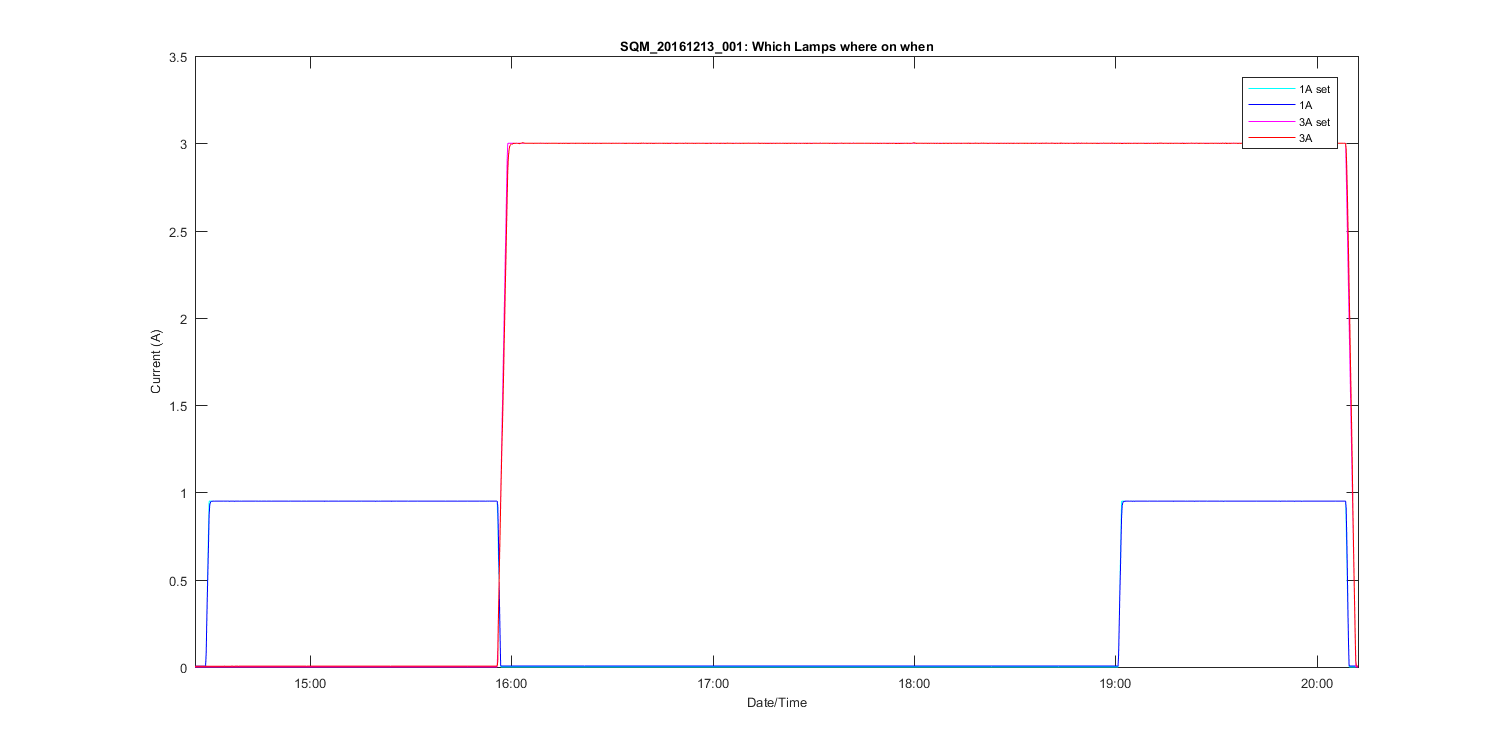
Figure 2
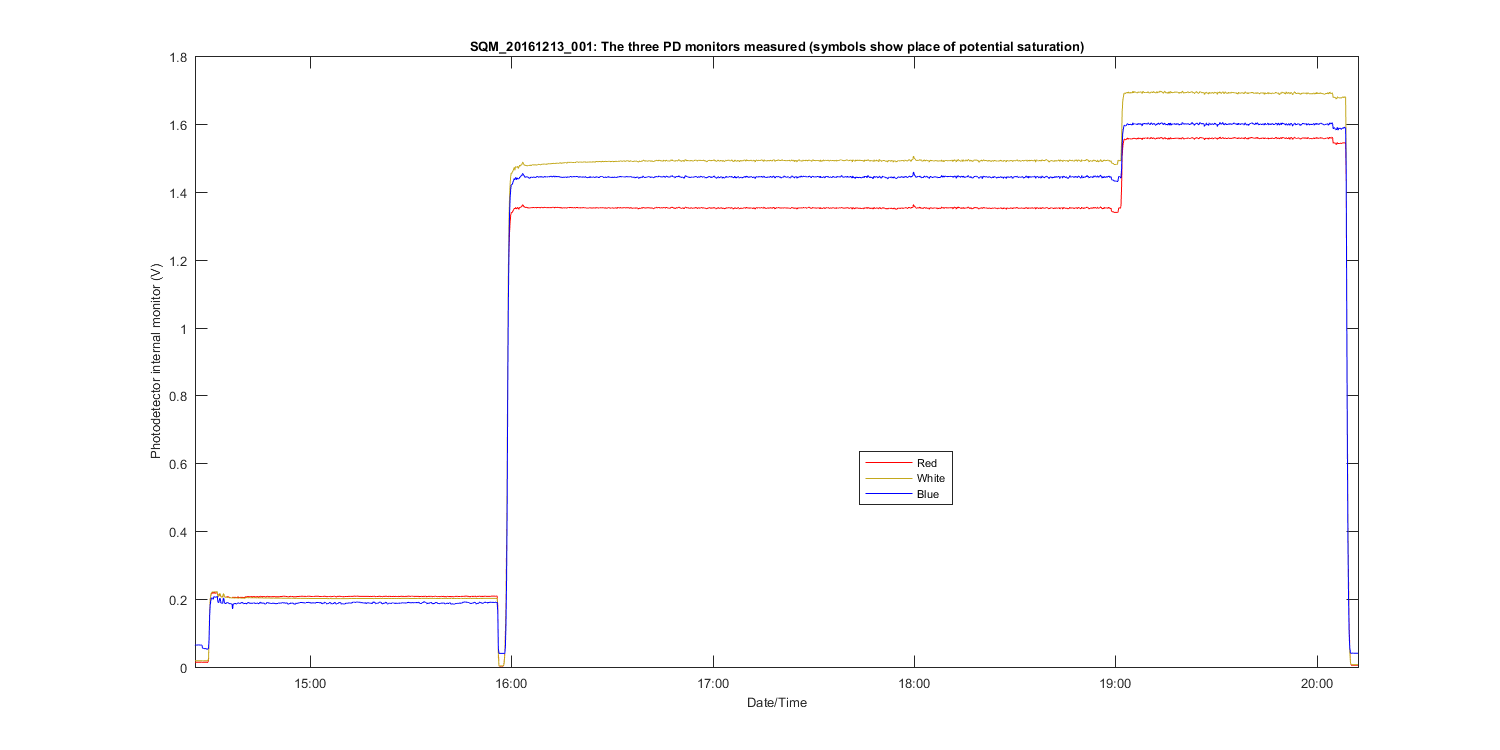
Figure 3
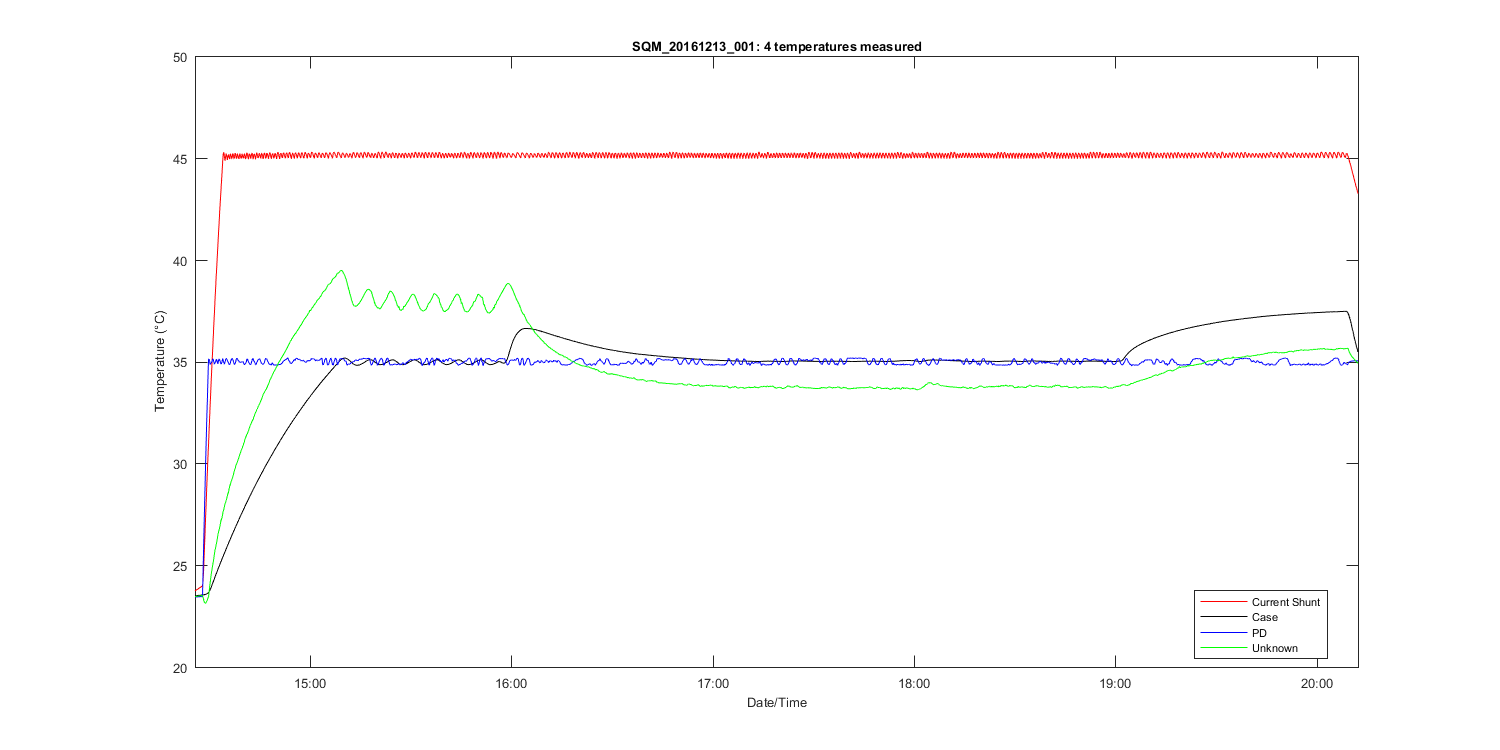
Figure 4
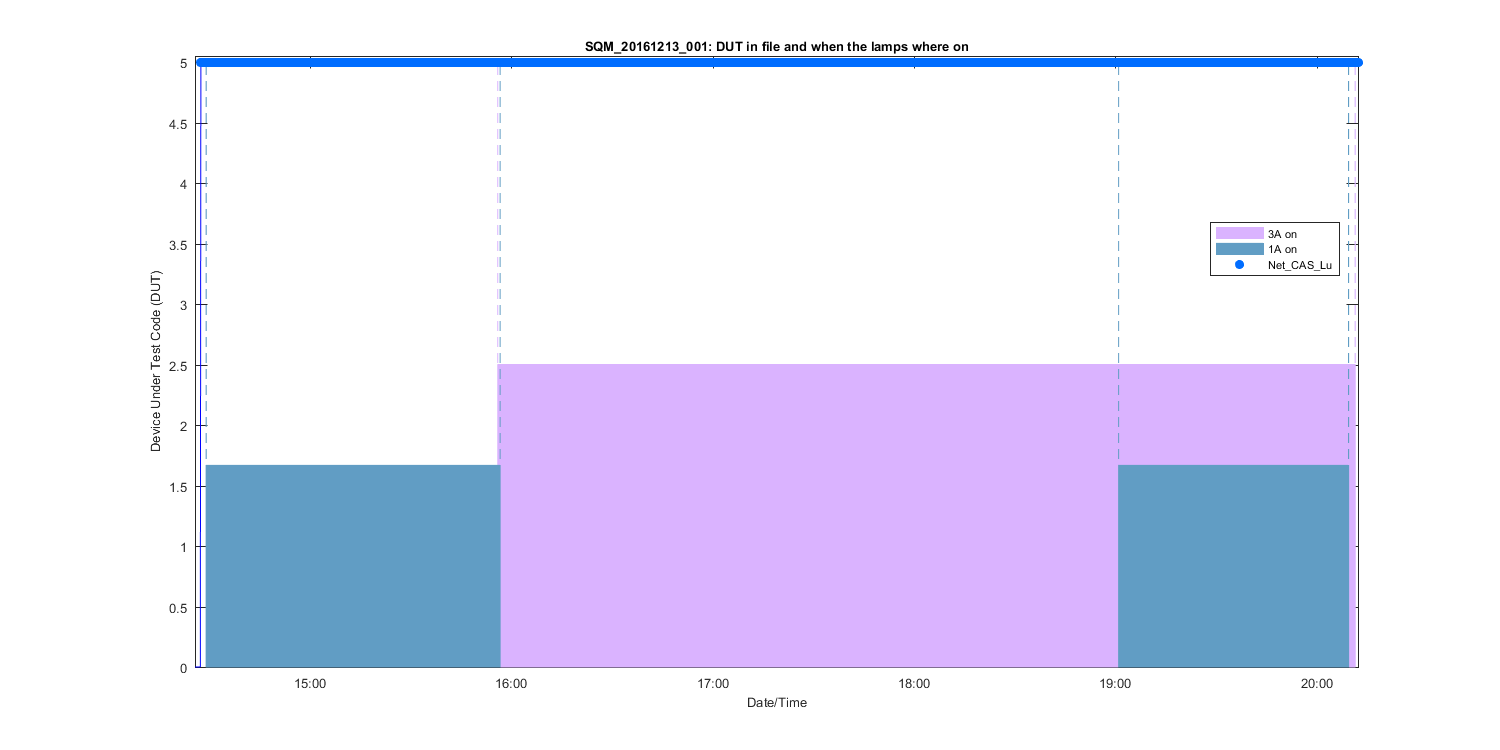
Figure 5
Figure 6
Figure 7
Figure 8
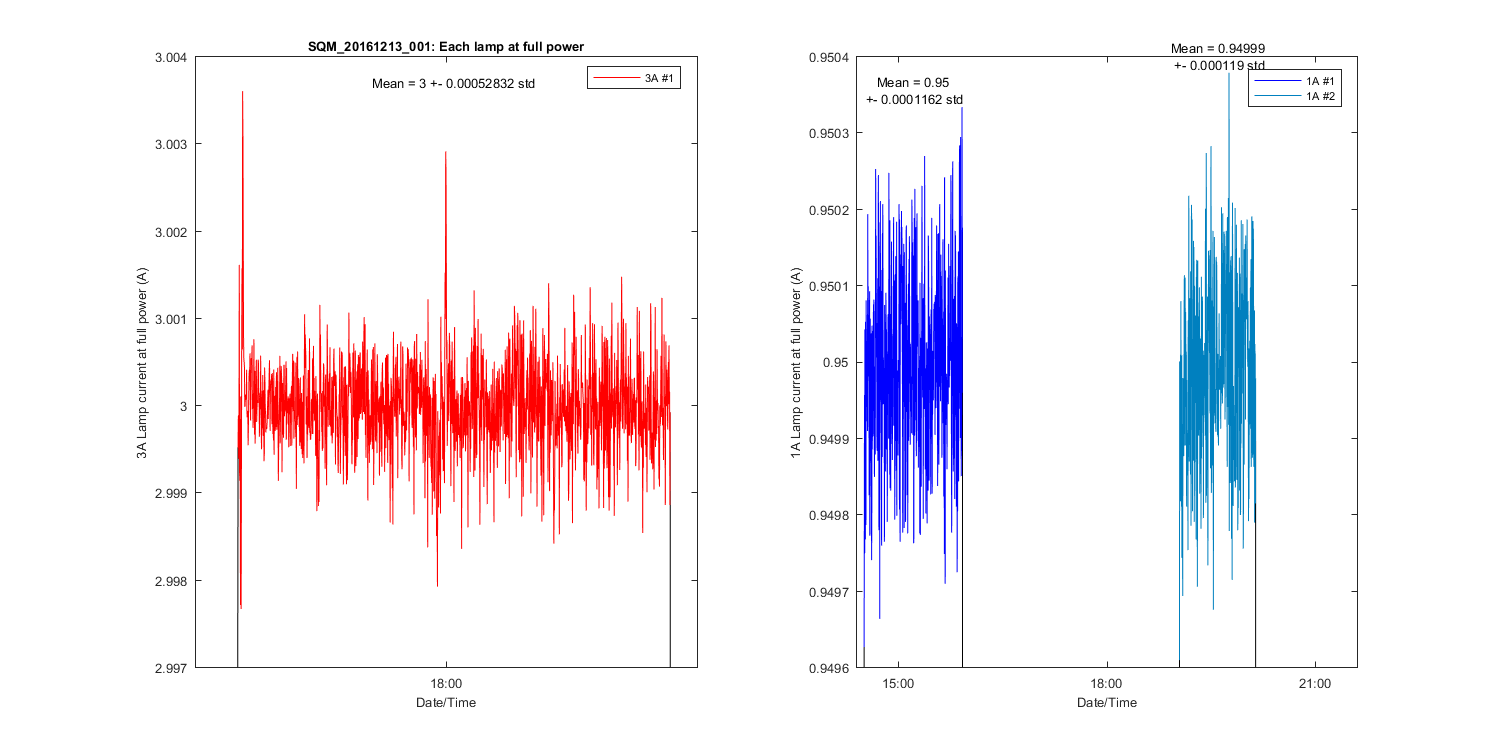
Figure 9
Figure 10