| Description | Value or Code |
|---|---|
| Cruise_Name:, Vaux(12,:) | NIST |
| Cruise_Number | 2016-001 |
| Investigator:: Vaux(16,:) | Carol Johnson |
| Location_of_Measurement: Vaux(17,:) | NIST B019_221 |
| Purpose: Vaux(18,:) | Testing |
| MOBY_NET_Sequence_Position: Vaux(20,:) | Calibration Facility |
| Ambient_Air_Temp (deg C) | 23.9 |
| Relative_Humidity (%) | 21.2 |
| #_of_Levels | 4 |
| Time_Step (sec) | 10 |
| Initial lamp state: Vaux(40,:) | All Off |
| Time_adjustment_to_GMT | 0 |
| Time_of_Last_Servicing | 20151218 |
| SQM_120VAC_On | 20161214.134300 |
| SQM_Off_to_Standby | 20161214.134739 |
| SQM_Standby_to_Off | 20161214.215047 |
| SQM_120VAC_Off | NaN |
| Lamp 1 A burn hours | 1.1361 |
| Lamp 3 A burn hours | 1.1244 |
| DAQ_Program_Version | 0 |
| File Format Version | 2 |
| DAQ_Computer: Vaux(60,:) | EOS EQUIP 13 |
| DAQ_Program_Name: Vaux(61,:) | SQM Monitor_2.0.vi |
|
All Devices Under Test in the DUT column in DATA: DUT_White_Fiducial DUT_Net_CAS_Lu |
|
ASCII SQM file data: SQM_20161214_001.txt
ASCII SQM file data: PDF log file
| Lamp | On/Off # | N | Time on (hrs) | Mean (meas./set) | std | %std |
|---|---|---|---|---|---|---|
| Lamp 1A | 1 | 225 | 0.65417 | 0.94998 / 0.95 | 0.00011187 | 0.011776 |
| Lamp 1A | 2 | 132 | 0.3825 | 0.94995 / 0.95 | 0.00010026 | 0.010554 |
| Lamp 3A | 1 | 343 | 0.99861 | 3 / 3 | 0.0006648 | 0.02216 |
| Level | PD internal monitor (V) | Level Change # | Mean | std | %std |
|---|---|---|---|---|---|
| Low (1A) | Red | 1 | 0.20816 | 0.0024735 | 1.1883 |
| Low (1A) | White | 1 | 0.20265 | 0.0030635 | 1.2206 |
| Low (1A) | Blue | 1 | 0.189 | 0.0049731 | 1.3087 |
| Medium (3A) | Red | 3 | 1.35 | 0.0040592 | 0.30069 |
| Medium (3A) | White | 3 | 1.4834 | 0.005725 | 0.27363 |
| Medium (3A) | Blue | 3 | 1.4409 | 0.004339 | 0.28171 |
| High (1A & 3A) | Red | 4 | 1.5451 | 0.037588 | 2.4328 |
| High (1A & 3A) | White | 4 | 1.6815 | 0.037214 | 2.2354 |
| High (1A & 3A) | Blue | 4 | 1.5887 | 0.029536 | 2.3659 |
| Level | Temperature (C) | Level Change # | Mean | std | %std |
|---|---|---|---|---|---|
| Low (1A) | PD | 1 | 35.0466 | 0.09925 | 0.28319 |
| Medium (3A) | PD | 3 | 34.9677 | 0.11017 | 0.31506 |
| High (1A & 3A) | PD | 4 | 34.9156 | 0.10114 | 0.28966 |
Red PD (max value): 1.5639: #of possible satureated values 0
White PD (max value): 1.7103: #of possible satureated values 0
Blue PD (max value): 1.6073: #of possible satureated values 0
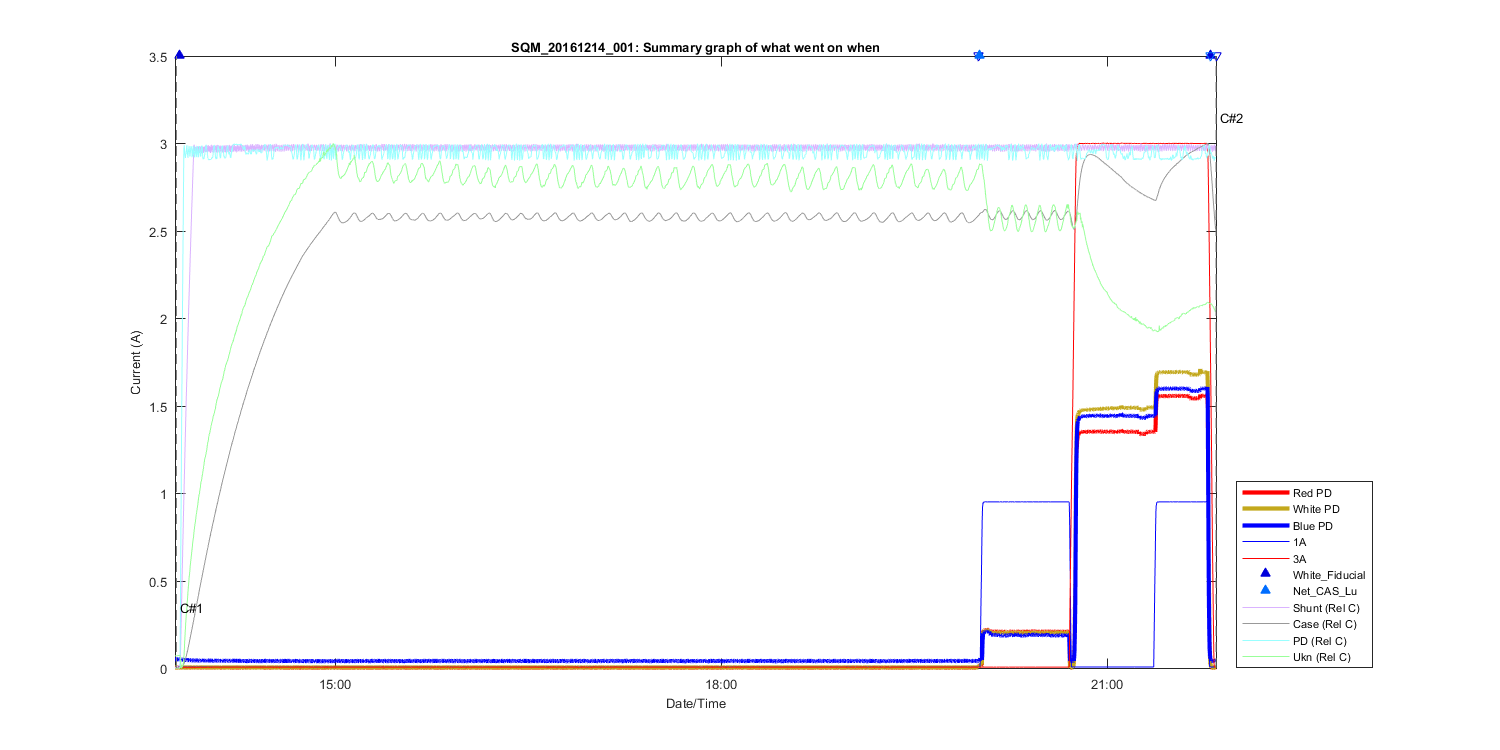
Figure 1
Summary Graph showing all measurements taken in this file, including auxilliary temperature measurements and comments. The text C# shows what time in the file the comments (shown above where made). The triangles at the top of the figure shows then a DUT (Device under test) was placed in front of the SQM and removed.
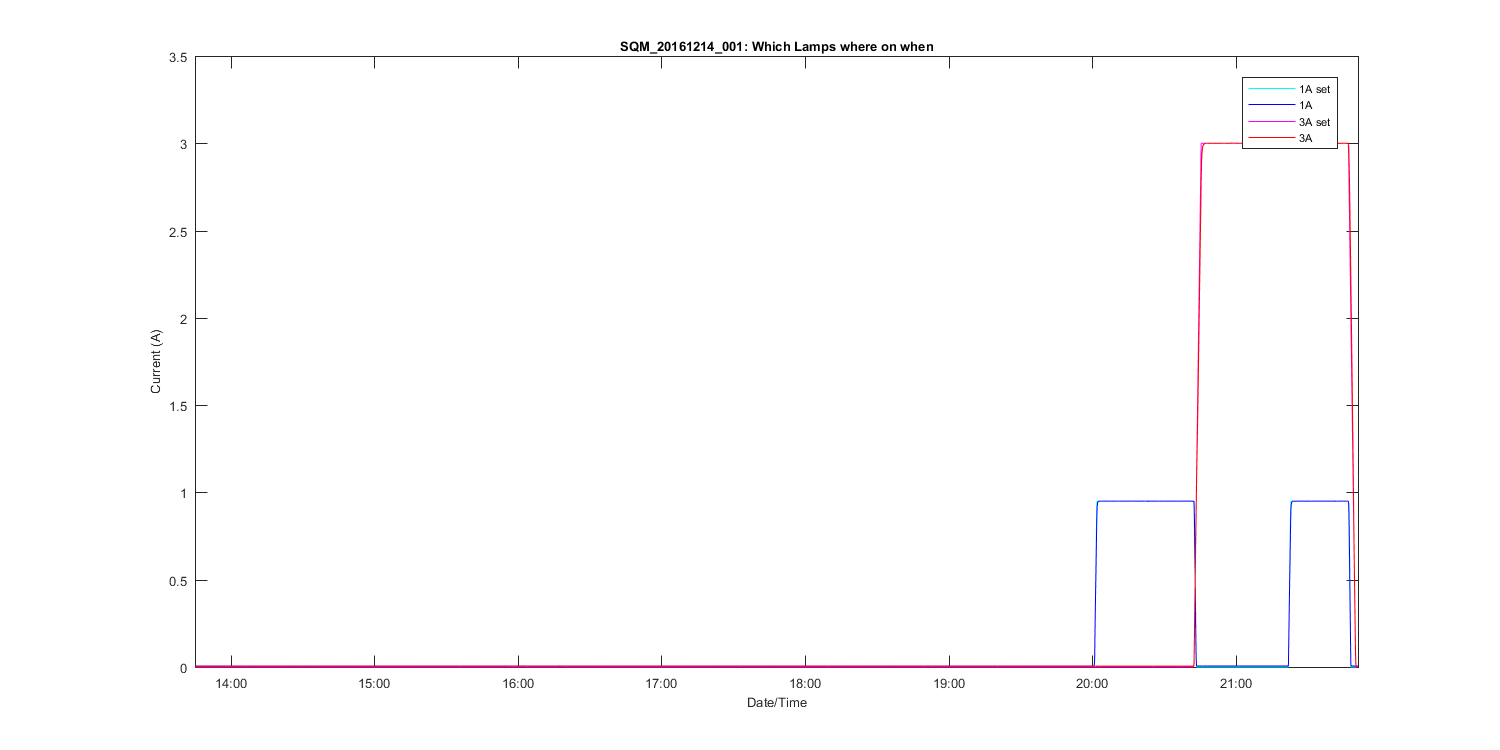
Figure 2
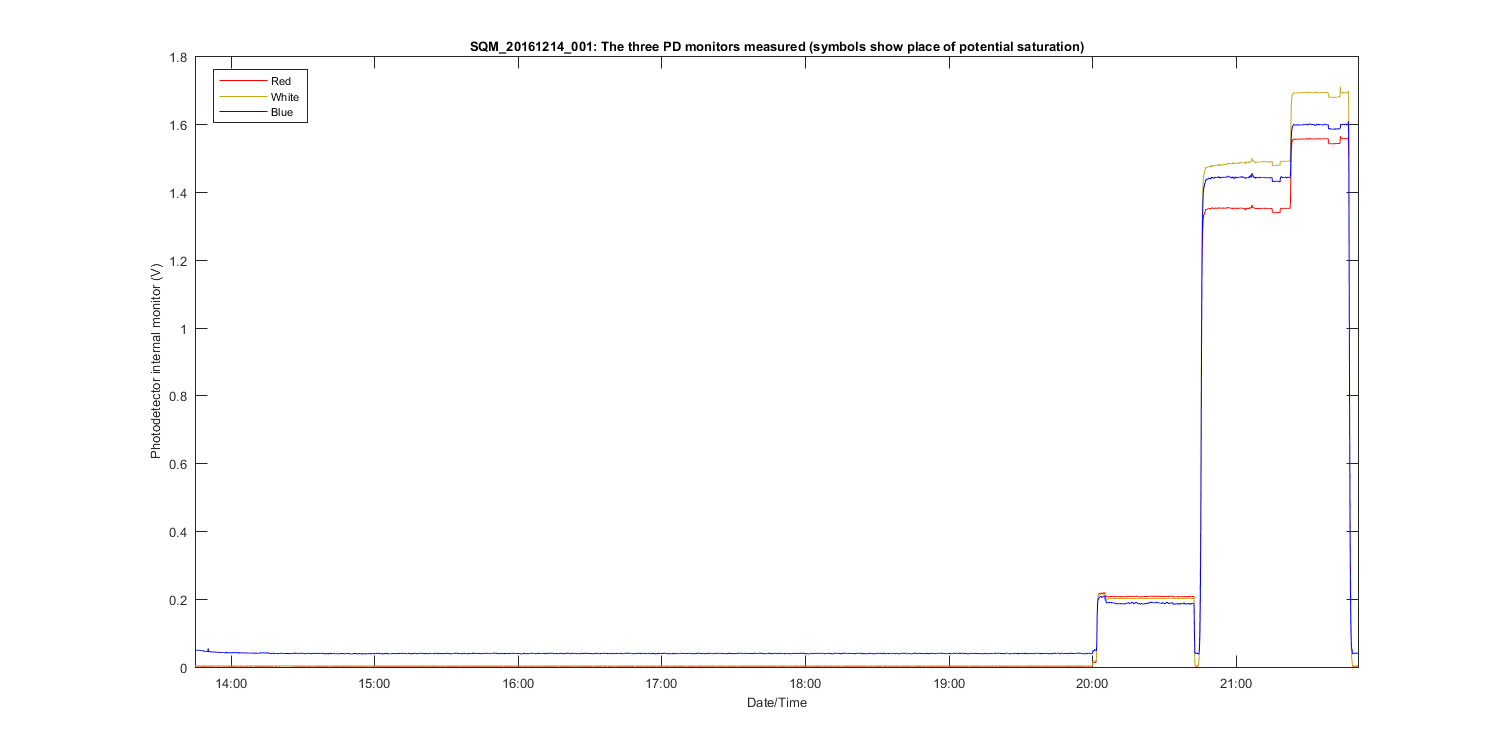
Figure 3
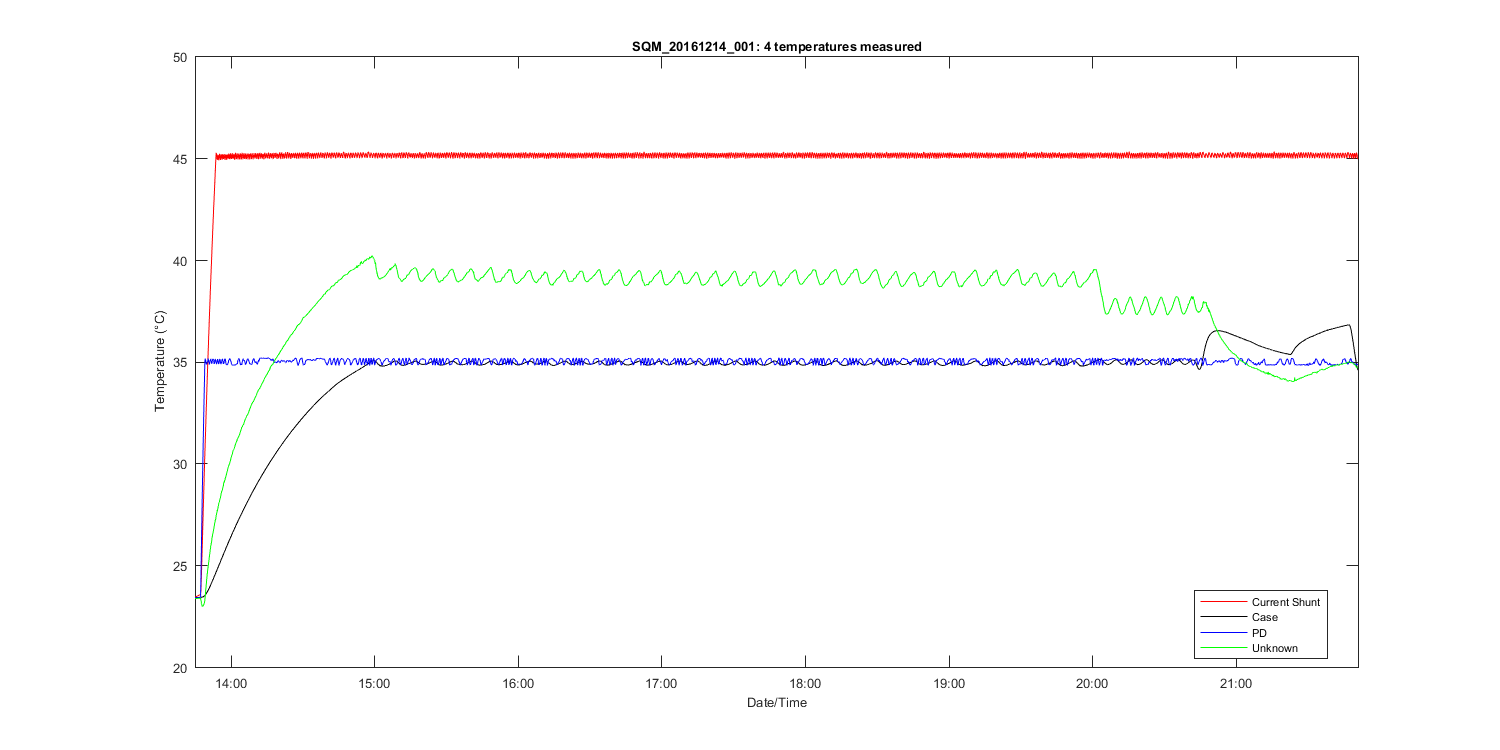
Figure 4
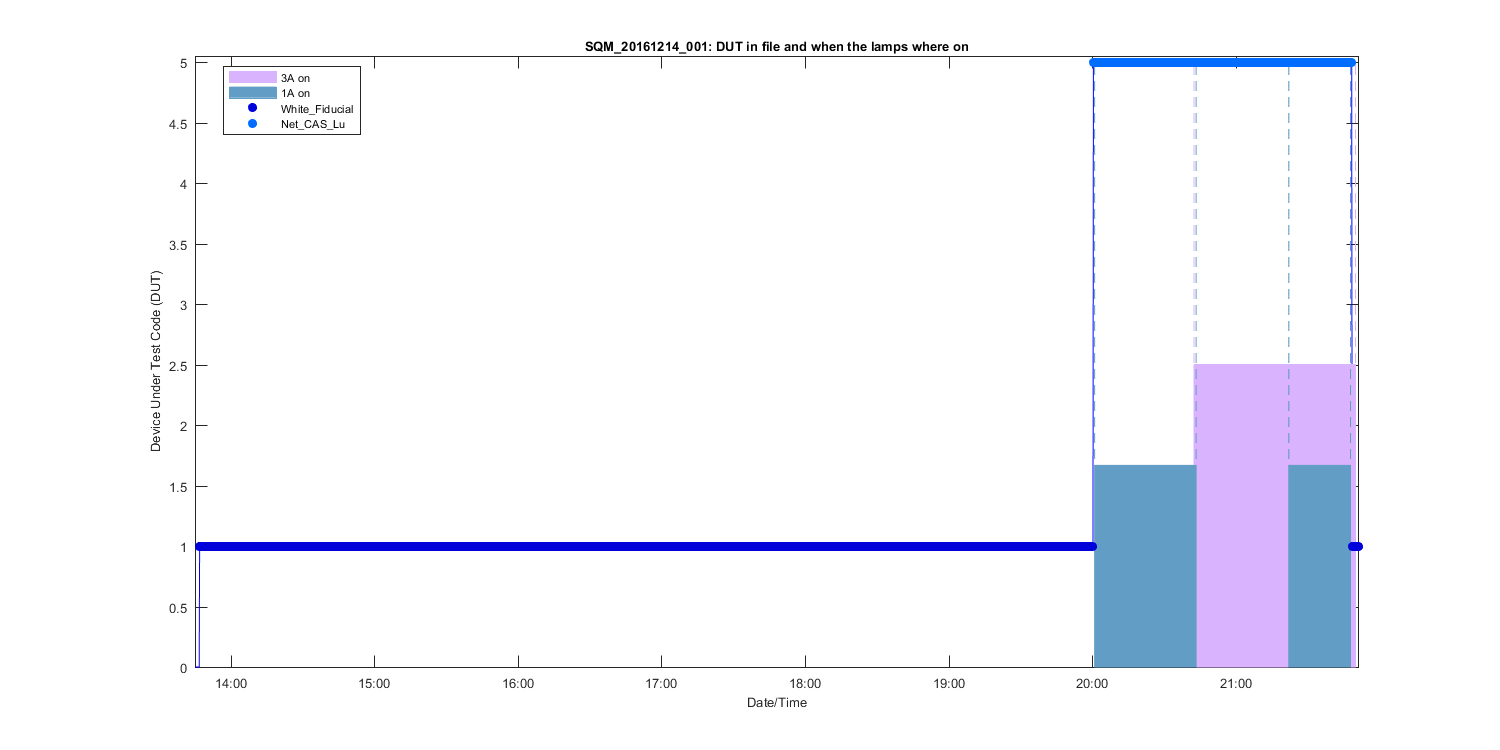
Figure 5
Figure 6
Figure 7
Figure 8
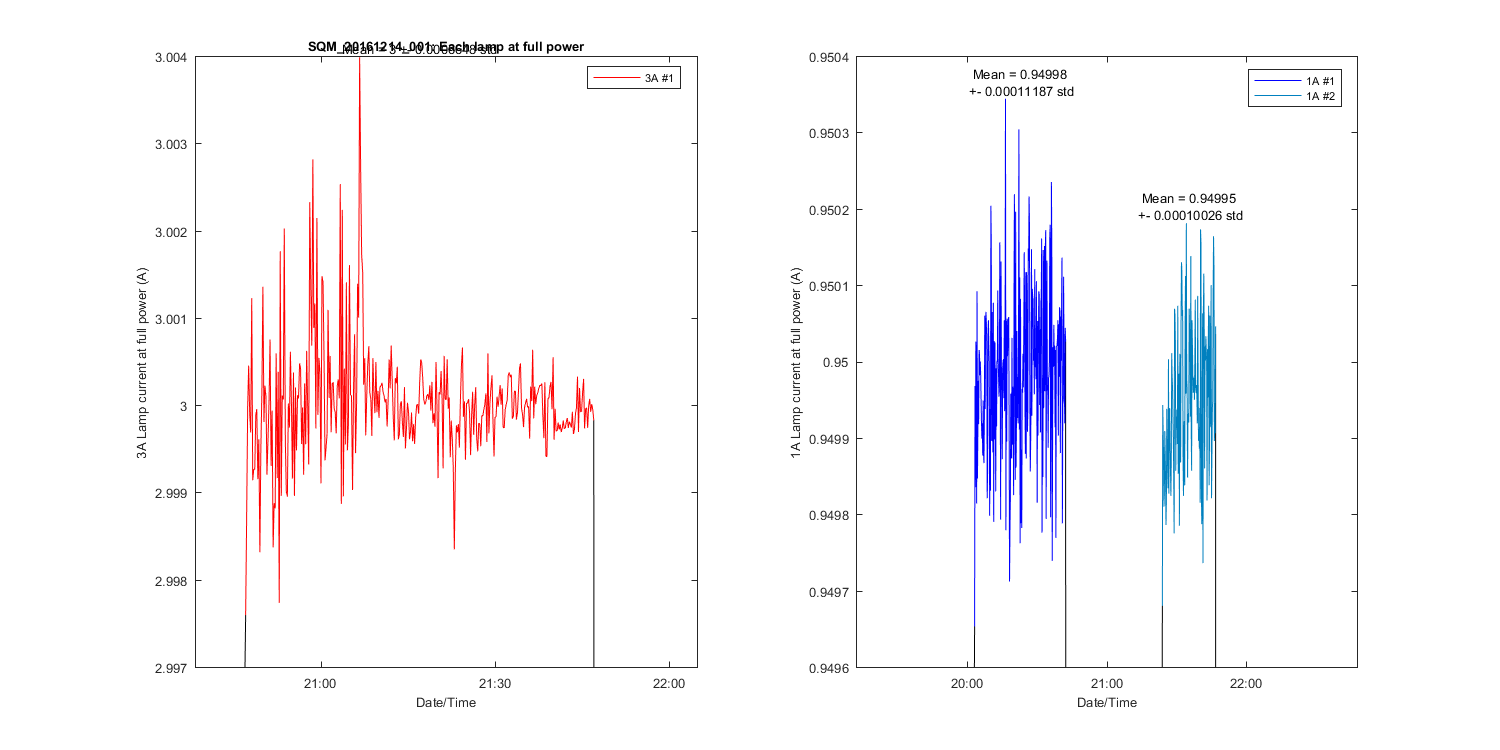
Figure 9
Figure 10