| Description | Value or Code |
|---|---|
| Cruise_Name:, Vaux(12,:) | NIST |
| Cruise_Number | 2016-001 |
| Investigator:: Vaux(16,:) | Carol Johnson |
| Location_of_Measurement: Vaux(17,:) | NIST B019_221 |
| Purpose: Vaux(18,:) | Testing |
| MOBY_NET_Sequence_Position: Vaux(20,:) | Calibration Facility |
| Ambient_Air_Temp (deg C) | 24.5 |
| Relative_Humidity (%) | 10.9 |
| #_of_Levels | 4 |
| Time_Step (sec) | 10 |
| Initial lamp state: Vaux(40,:) | All Off |
| Time_adjustment_to_GMT | 0 |
| Time_of_Last_Servicing | 20151218 |
| SQM_120VAC_On | 20161215.145700 |
| SQM_Off_to_Standby | 20161215.150005 |
| SQM_Standby_to_Off | 20161215.210346 |
| SQM_120VAC_Off | NaN |
| Lamp 1 A burn hours | 0.90806 |
| Lamp 3 A burn hours | 0.57222 |
| DAQ_Program_Version | 0 |
| File Format Version | 2 |
| DAQ_Computer: Vaux(60,:) | EOS EQUIP 13 |
| DAQ_Program_Name: Vaux(61,:) | SQM Monitor_2.0.vi |
|
All Devices Under Test in the DUT column in DATA: DUT_White_Fiducial DUT_Net_CAS_Lu |
|
ASCII SQM file data: SQM_20161215_001.txt
ASCII SQM file data: PDF log file
| Lamp | On/Off # | N | Time on (hrs) | Mean (meas./set) | std | %std |
|---|---|---|---|---|---|---|
| Lamp 1A | 1 | 211 | 0.61306 | 0.94997 / 0.95 | 0.00010261 | 0.010802 |
| Lamp 1A | 2 | 69 | 0.19833 | 0.94998 / 0.95 | 0.0001185 | 0.012474 |
| Lamp 3A | 1 | 156 | 0.4525 | 2.9998 / 3 | 0.0007917 | 0.026392 |
| Level | PD internal monitor (V) | Level Change # | Mean | std | %std |
|---|---|---|---|---|---|
| Low (1A) | Red | 1 | 0.20761 | 0.00055651 | 0.26806 |
| Low (1A) | White | 1 | 0.20183 | 0.00040343 | 0.27573 |
| Low (1A) | Blue | 1 | 0.18827 | 0.0014663 | 0.29559 |
| Medium (3A) | Red | 3 | 1.3501 | 0.0061221 | 0.45346 |
| Medium (3A) | White | 3 | 1.4764 | 0.0057314 | 0.41465 |
| Medium (3A) | Blue | 3 | 1.4391 | 0.0043555 | 0.42542 |
| High (1A & 3A) | Red | 4 | 1.5403 | 0.050173 | 3.2573 |
| High (1A & 3A) | White | 4 | 1.6706 | 0.051539 | 3.0033 |
| High (1A & 3A) | Blue | 4 | 1.5847 | 0.040654 | 3.1662 |
| Level | Temperature (C) | Level Change # | Mean | std | %std |
|---|---|---|---|---|---|
| Low (1A) | PD | 1 | 35.0364 | 0.11618 | 0.3316 |
| Medium (3A) | PD | 3 | 35.0634 | 0.076399 | 0.21789 |
| High (1A & 3A) | PD | 4 | 34.9436 | 0.1056 | 0.3022 |
Red PD (max value): 1.5623: #of possible satureated values 0
White PD (max value): 1.6977: #of possible satureated values 0
Blue PD (max value): 1.6092: #of possible satureated values 0
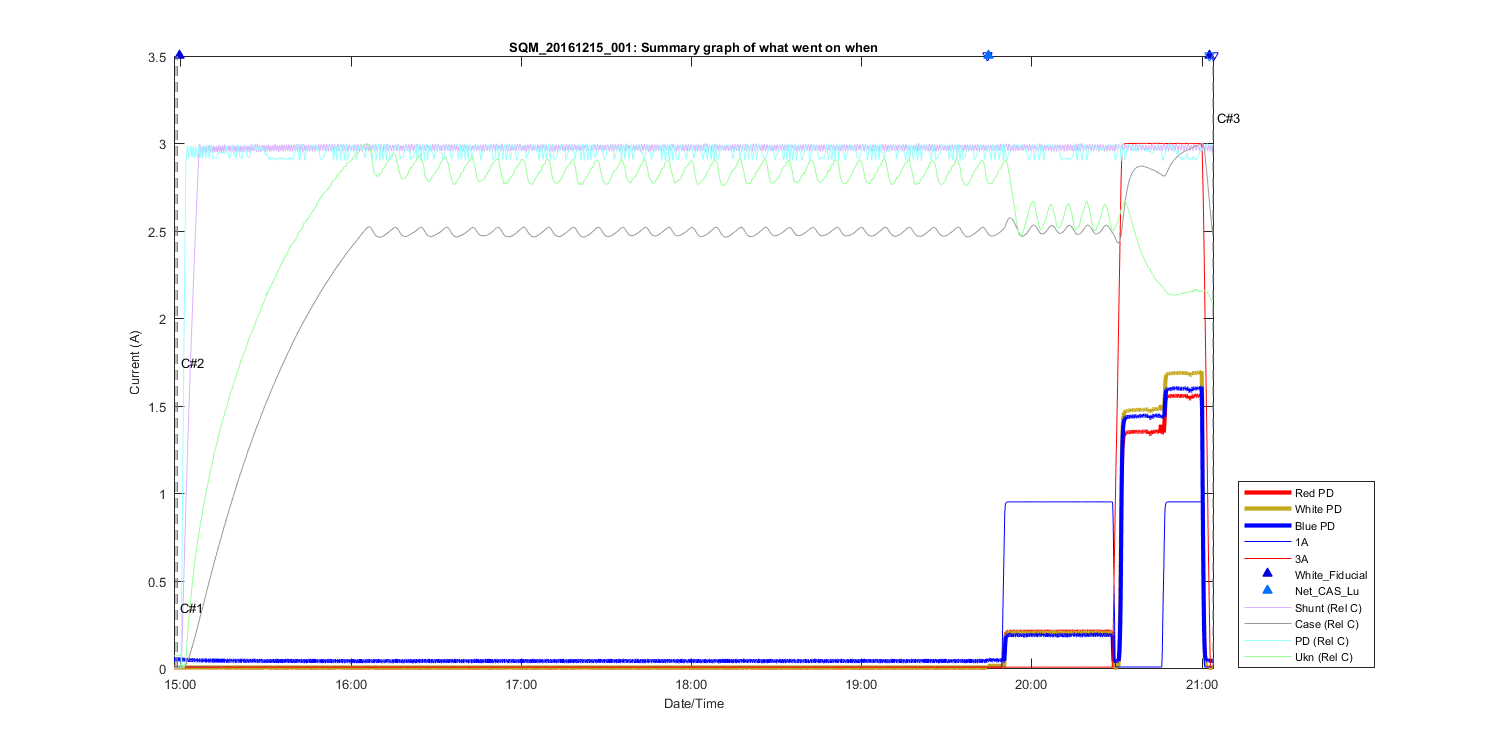
Figure 1
Summary Graph showing all measurements taken in this file, including auxilliary temperature measurements and comments. The text C# shows what time in the file the comments (shown above where made). The triangles at the top of the figure shows then a DUT (Device under test) was placed in front of the SQM and removed.
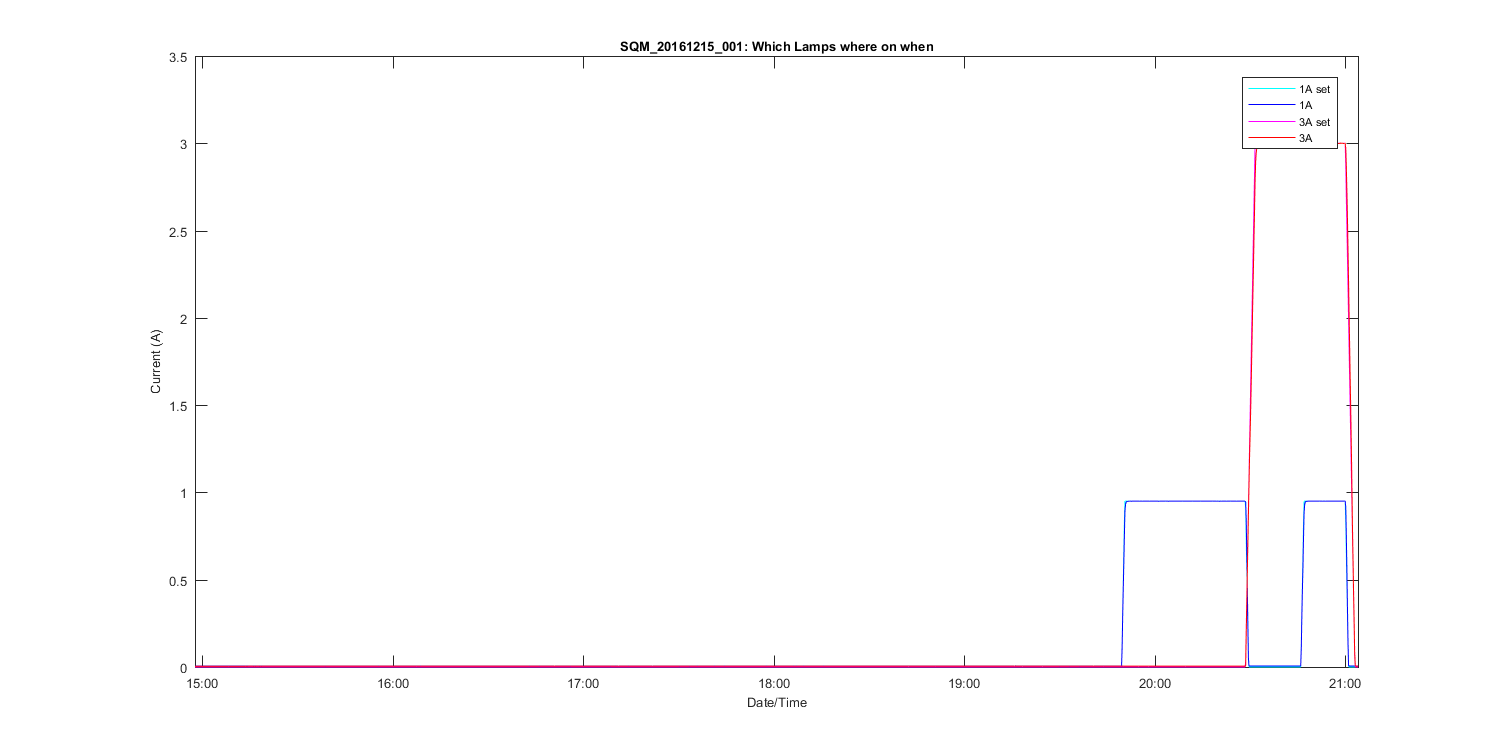
Figure 2
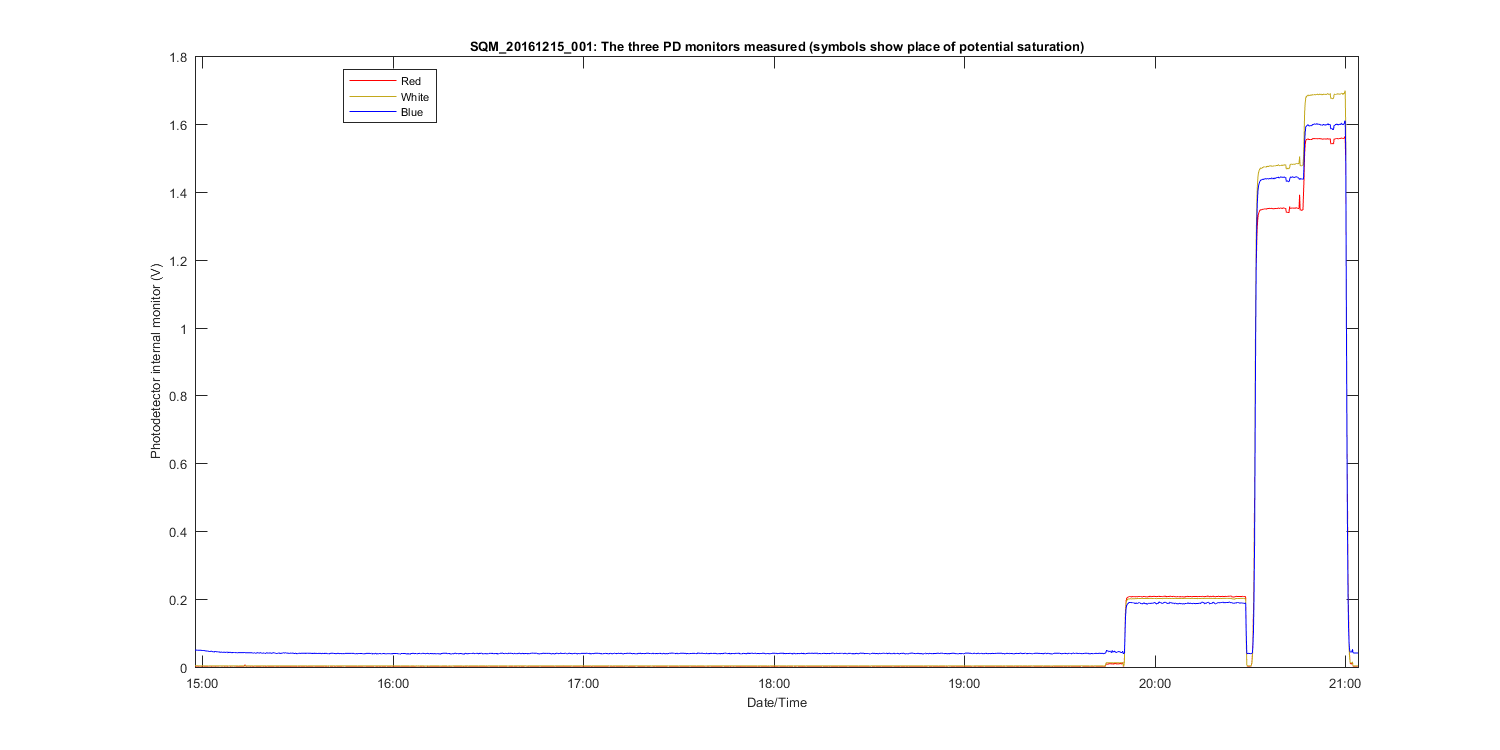
Figure 3
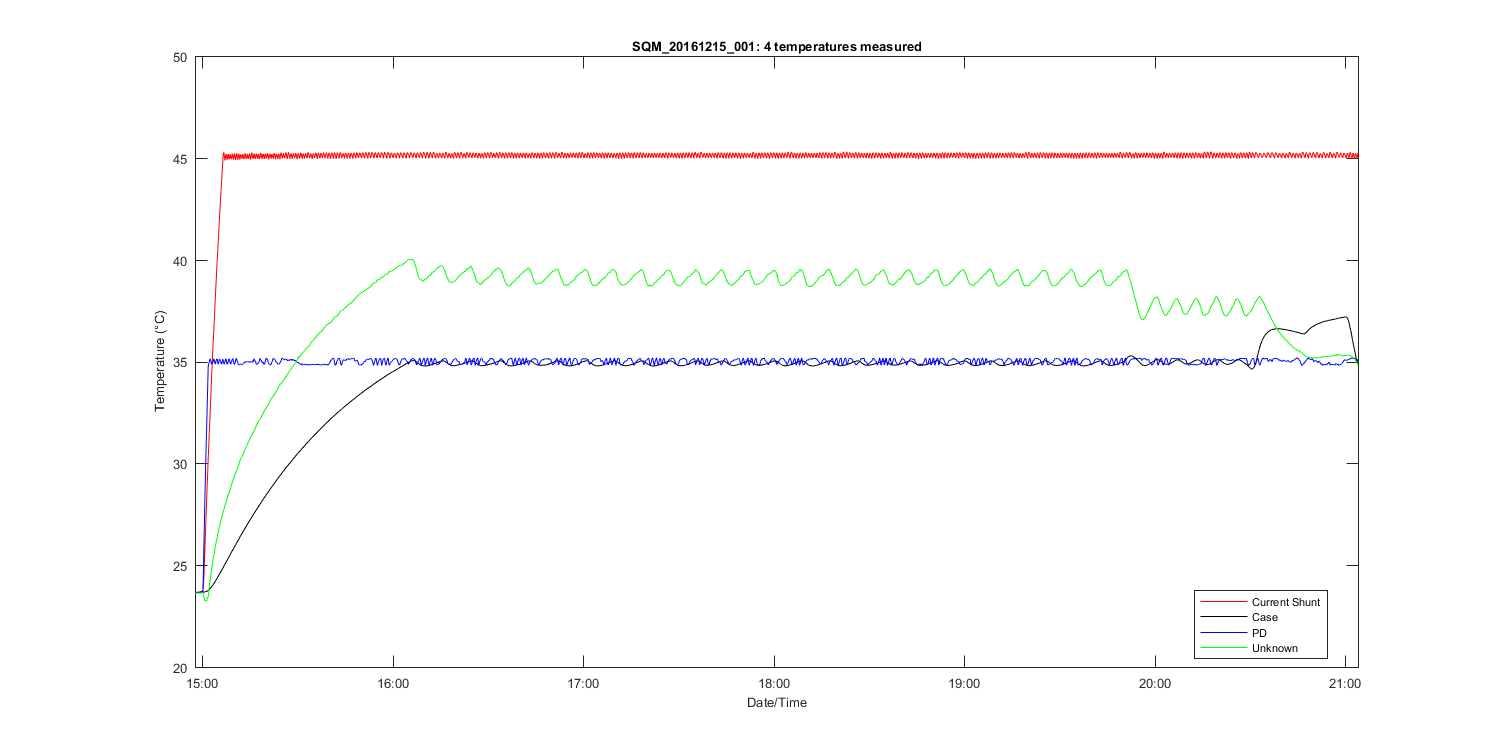
Figure 4
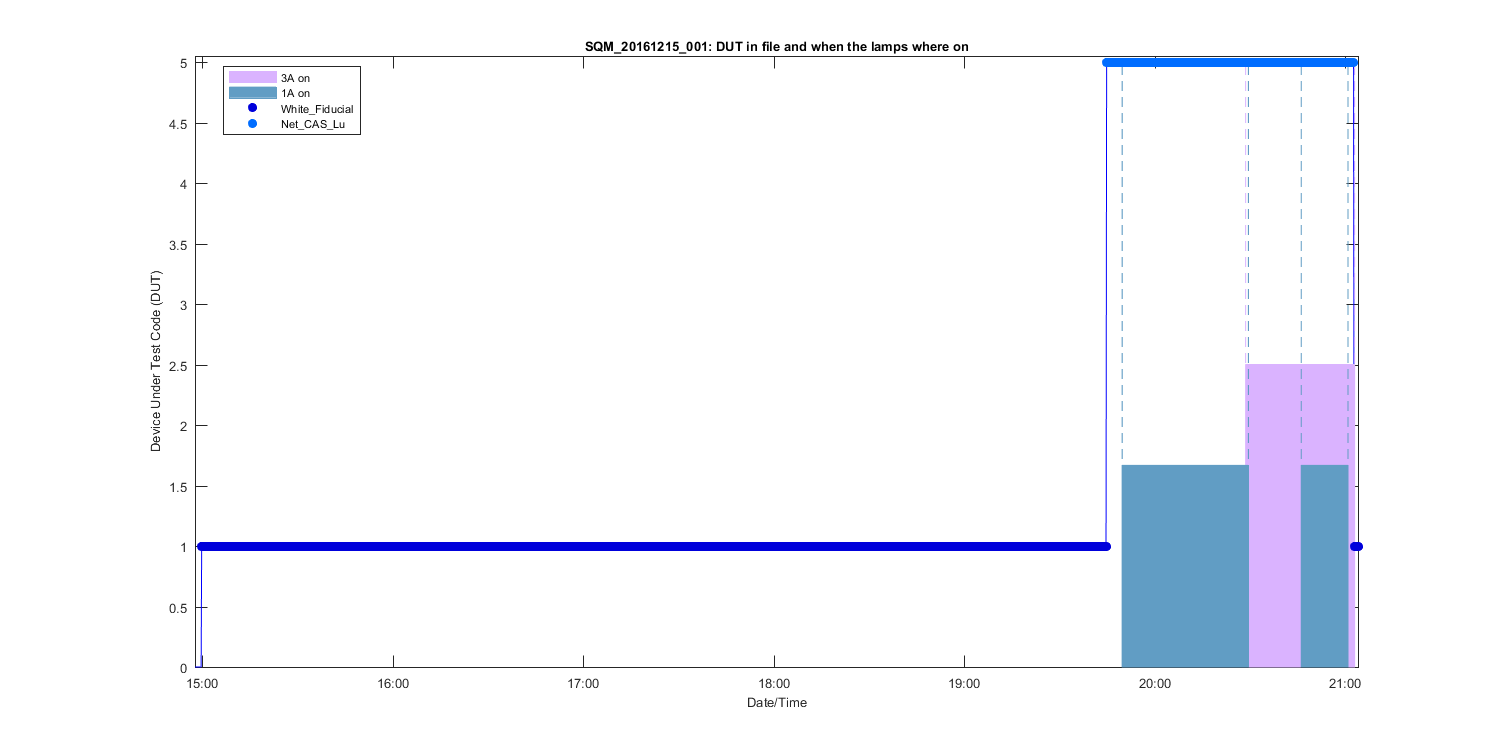
Figure 5
Figure 6
Figure 7
Figure 8
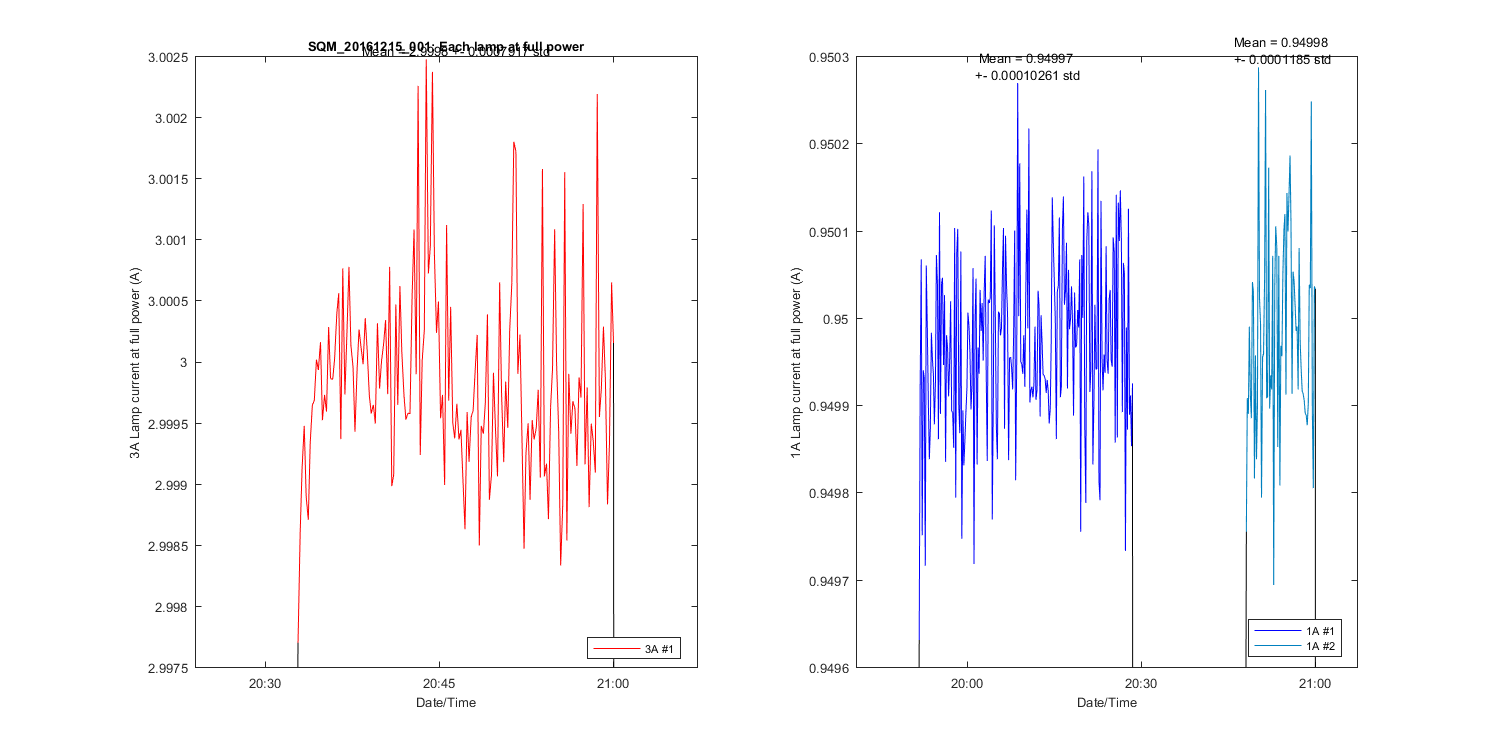
Figure 9
Figure 10