| Description | Value or Code |
|---|---|
| Cruise_Name:, Vaux(12,:) | NIST |
| Cruise_Number | 2016-001 |
| Investigator:: Vaux(16,:) | Carol Johnson |
| Location_of_Measurement: Vaux(17,:) | NIST B019_221 |
| Purpose: Vaux(18,:) | Testing |
| MOBY_NET_Sequence_Position: Vaux(20,:) | Calibration Facility |
| Ambient_Air_Temp (deg C) | 24.4 |
| Relative_Humidity (%) | 10.2 |
| #_of_Levels | 4 |
| Time_Step (sec) | 10 |
| Initial lamp state: Vaux(40,:) | All Off |
| Time_adjustment_to_GMT | 0 |
| Time_of_Last_Servicing | 20151218 |
| SQM_120VAC_On | 20161216.133900 |
| SQM_Off_to_Standby | 20161216.133832 |
| SQM_Standby_to_Off | 20161216.154332 |
| SQM_120VAC_Off | 20161216.154500 |
| Lamp 1 A burn hours | 1.5244 |
| Lamp 3 A burn hours | 0.81472 |
| DAQ_Program_Version | 0 |
| File Format Version | 2 |
| DAQ_Computer: Vaux(60,:) | EOS EQUIP 13 |
| DAQ_Program_Name: Vaux(61,:) | SQM Monitor_2.0.vi |
|
All Devices Under Test in the DUT column in DATA: DUT_White_Fiducial DUT_Net_CAS_Lu |
|
ASCII SQM file data: SQM_20161216_001.txt
ASCII SQM file data: PDF log file
| Lamp | On/Off # | N | Time on (hrs) | Mean (meas./set) | std | %std |
|---|---|---|---|---|---|---|
| Lamp 1A | 1 | 241 | 0.70083 | 0.94998 / 0.95 | 0.00012179 | 0.01282 |
| Lamp 1A | 2 | 250 | 0.72722 | 0.94999 / 0.95 | 0.00014564 | 0.015331 |
| Lamp 3A | 1 | 239 | 0.695 | 3.0001 / 3 | 0.00072812 | 0.02427 |
| Level | PD internal monitor (V) | Level Change # | Mean | std | %std |
|---|---|---|---|---|---|
| Low (1A) | Red | 1 | 0.23734 | 0.066214 | 27.8991 |
| Low (1A) | White | 1 | 0.23067 | 0.060753 | 28.7052 |
| Low (1A) | Blue | 1 | 0.20394 | 0.034452 | 32.4677 |
| Medium (3A) | Red | 3 | 1.3507 | 0.0042264 | 0.31292 |
| Medium (3A) | White | 3 | 1.4802 | 0.0060928 | 0.28554 |
| Medium (3A) | Blue | 3 | 1.441 | 0.0034572 | 0.29329 |
| High (1A & 3A) | Red | 4 | 1.3685 | 0.43091 | 31.4882 |
| High (1A & 3A) | White | 4 | 1.4823 | 0.47936 | 29.0696 |
| High (1A & 3A) | Blue | 4 | 1.3997 | 0.46 | 30.7868 |
| Low (1A) | Red | 5 | 0.27654 | 0.086159 | 31.1558 |
| Low (1A) | White | 5 | 0.2659 | 0.079065 | 32.4024 |
| Low (1A) | Blue | 5 | 0.22458 | 0.045051 | 38.3652 |
| Level | Temperature (C) | Level Change # | Mean | std | %std |
|---|---|---|---|---|---|
| Low (1A) | PD | 1 | 35.0002 | 0.11033 | 0.31522 |
| Medium (3A) | PD | 3 | 34.9856 | 0.10461 | 0.299 |
| High (1A & 3A) | PD | 4 | 34.9644 | 0.10531 | 0.3012 |
| Low (1A) | PD | 5 | 35.005 | 0.11023 | 0.3149 |
Red PD (max value): 1.561: #of possible satureated values 0
White PD (max value): 1.6964: #of possible satureated values 0
Blue PD (max value): 1.6065: #of possible satureated values 0
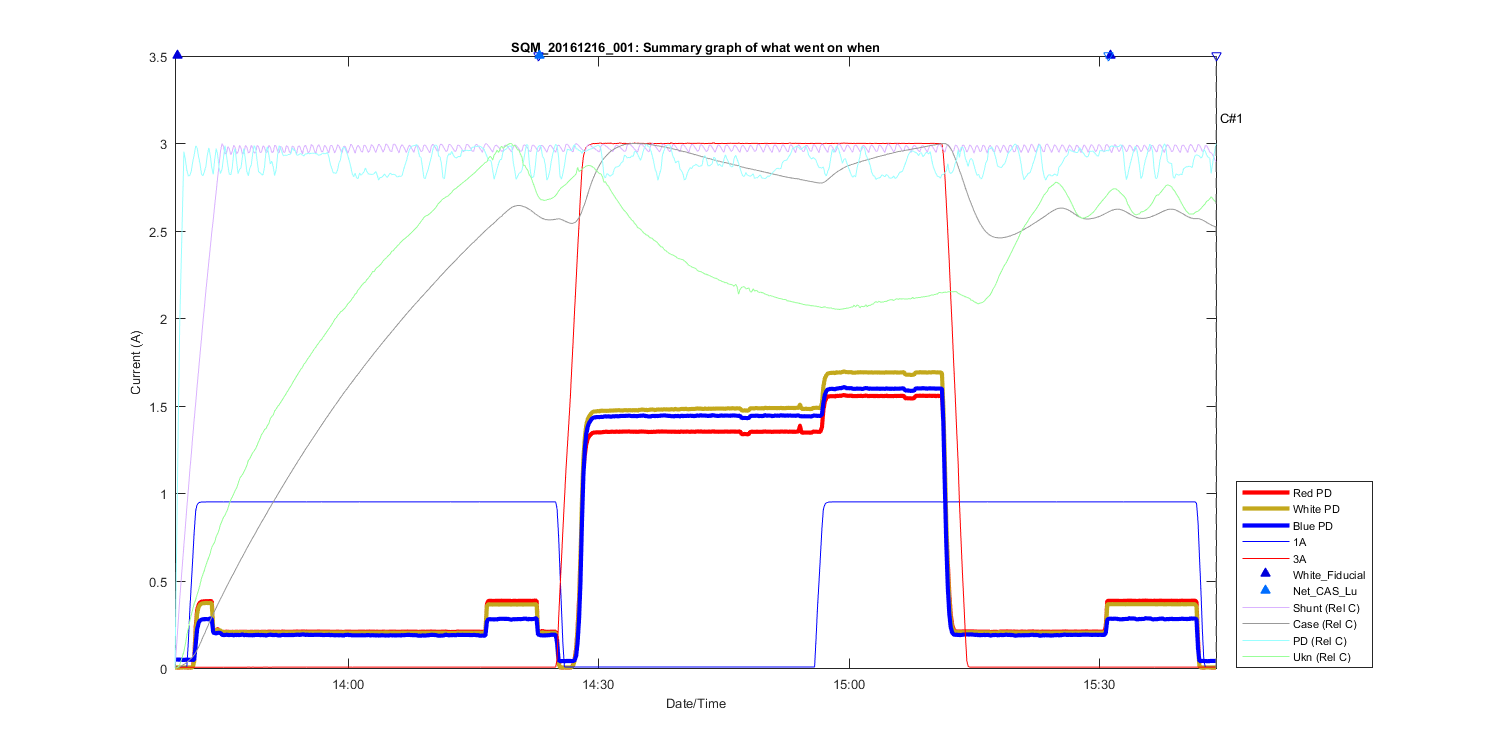
Figure 1
Summary Graph showing all measurements taken in this file, including auxilliary temperature measurements and comments. The text C# shows what time in the file the comments (shown above where made). The triangles at the top of the figure shows then a DUT (Device under test) was placed in front of the SQM and removed.
Figure 2
Figure 3
Figure 4
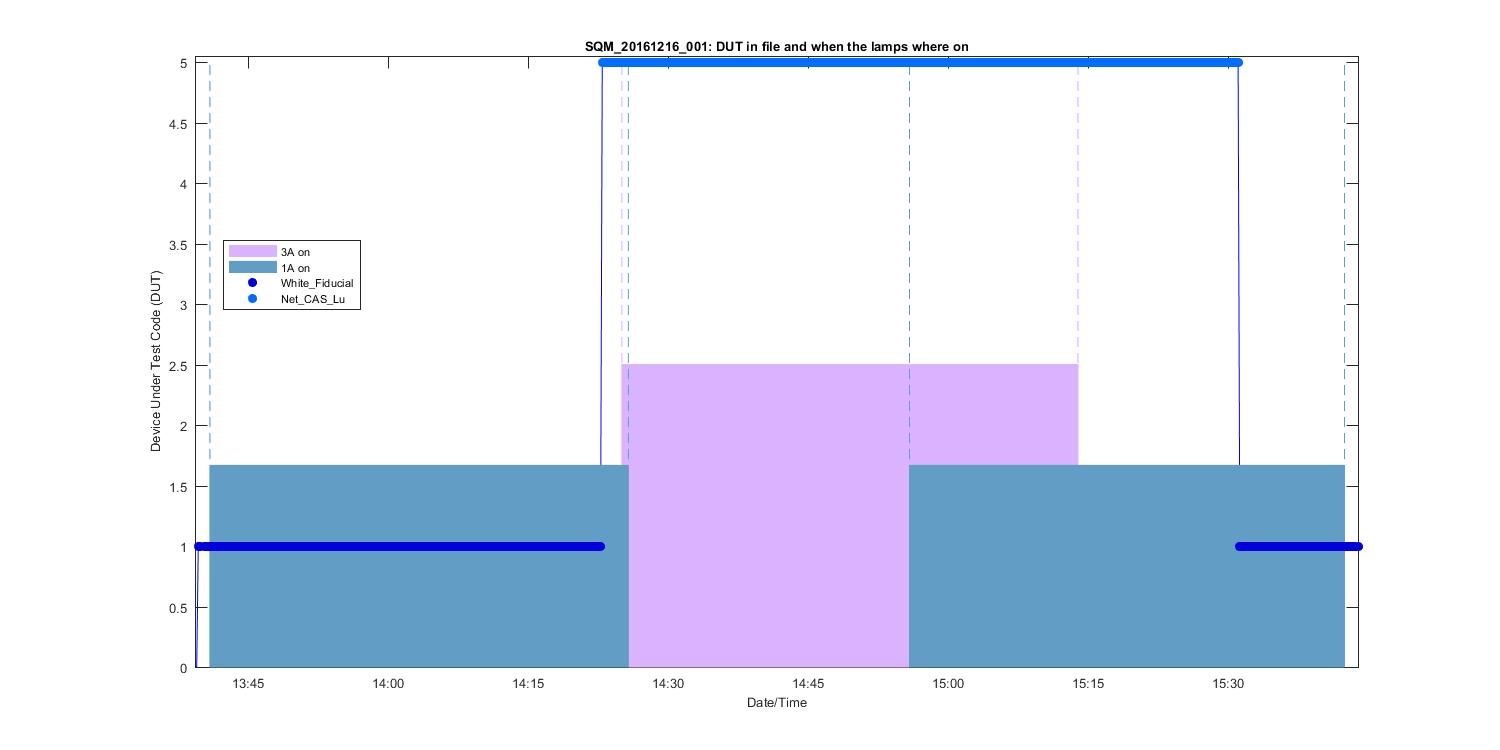
Figure 5
Figure 6
Figure 7
Figure 8
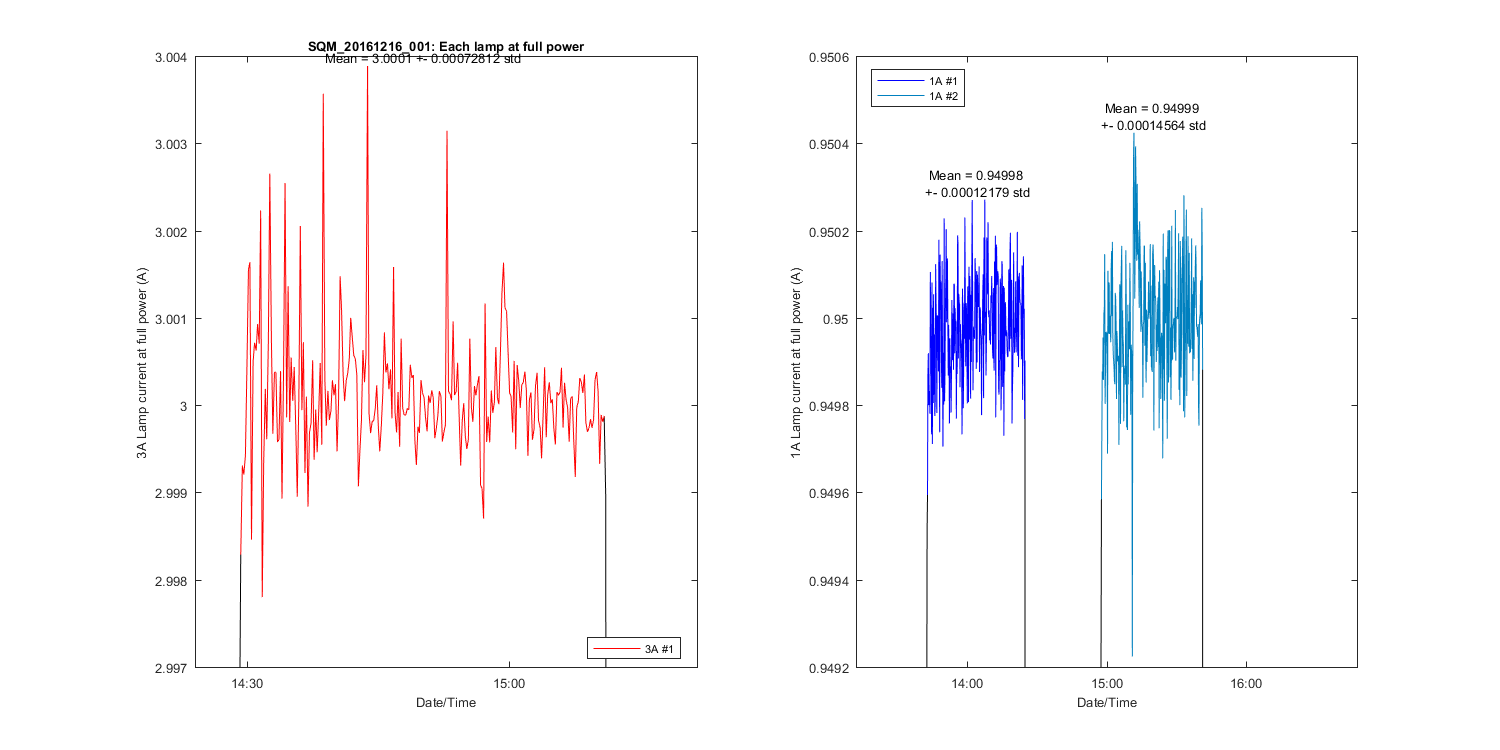
Figure 9
Figure 10