| Description | Value or Code |
|---|---|
| Cruise_Name:, Vaux(12,:) | NIST |
| Cruise_Number | 2016-001 |
| Investigator:: Vaux(16,:) | Carol Johnson |
| Location_of_Measurement: Vaux(17,:) | NIST B019_221 |
| Purpose: Vaux(18,:) | Testing |
| MOBY_NET_Sequence_Position: Vaux(20,:) | Calibration Facility |
| Ambient_Air_Temp (deg C) | 24.6 |
| Relative_Humidity (%) | 19.3 |
| #_of_Levels | 4 |
| Time_Step (sec) | 10 |
| Initial lamp state: Vaux(40,:) | All Off |
| Time_adjustment_to_GMT | 0 |
| Time_of_Last_Servicing | 20151218 |
| SQM_120VAC_On | 20161223.172200 |
| SQM_Off_to_Standby | 20161223.172430 |
| SQM_Standby_to_Off | 20161223.193337 |
| SQM_120VAC_Off | 20161223.193500 |
| Lamp 1 A burn hours | 1.4892 |
| Lamp 3 A burn hours | 0.79139 |
| DAQ_Program_Version | 0 |
| File Format Version | 2 |
| DAQ_Computer: Vaux(60,:) | EOS EQUIP 13 |
| DAQ_Program_Name: Vaux(61,:) | SQM Monitor_2.0.vi |
|
All Devices Under Test in the DUT column in DATA: DUT_White_Fiducial DUT_Net_CAS_Lu |
|
ASCII SQM file data: SQM_20161223_001.txt
ASCII SQM file data: PDF log file
| Lamp | On/Off # | N | Time on (hrs) | Mean (meas./set) | std | %std |
|---|---|---|---|---|---|---|
| Lamp 1A | 1 | 240 | 0.69806 | 0.94999 / 0.95 | 0.00011082 | 0.011666 |
| Lamp 1A | 2 | 77 | 0.22194 | 0.94996 / 0.95 | 0.00012035 | 0.012669 |
| Lamp 1A | 3 | 147 | 0.42611 | 0.94999 / 0.95 | 0.00011916 | 0.012543 |
| Lamp 3A | 1 | 232 | 0.67444 | 3 / 3 | 0.00099578 | 0.033193 |
| Level | PD internal monitor (V) | Level Change # | Mean | std | %std |
|---|---|---|---|---|---|
| Low (1A) | Red | 1 | 0.20707 | 0.00083252 | 0.40205 |
| Low (1A) | White | 1 | 0.20215 | 0.0013297 | 0.41184 |
| Low (1A) | Blue | 1 | 0.18784 | 0.001693 | 0.44321 |
| Medium (3A) | Red | 3 | 1.3493 | 0.0043897 | 0.32533 |
| Medium (3A) | White | 3 | 1.4761 | 0.0051422 | 0.29739 |
| Medium (3A) | Blue | 3 | 1.4398 | 0.0046817 | 0.30487 |
| High (1A & 3A) | Red | 4 | 1.5312 | 0.060387 | 3.9438 |
| High (1A & 3A) | White | 4 | 1.6633 | 0.05991 | 3.6306 |
| High (1A & 3A) | Blue | 4 | 1.5778 | 0.047157 | 3.8273 |
| Medium (3A) | Red | 5 | 1.3517 | 0.00072048 | 0.053301 |
| Medium (3A) | White | 5 | 1.4886 | 0.0012802 | 0.048399 |
| Medium (3A) | Blue | 5 | 1.443 | 0.0010446 | 0.049928 |
| High (1A & 3A) | Red | 6 | 0.2079 | 0.00028742 | 0.13825 |
| High (1A & 3A) | White | 6 | 0.20435 | 0.00030079 | 0.14065 |
| High (1A & 3A) | Blue | 6 | 0.18889 | 0.00048476 | 0.15216 |
| Low (1A) | Red | 7 | 0.25555 | 0.078594 | 30.7548 |
| Low (1A) | White | 7 | 0.24655 | 0.072026 | 31.8771 |
| Low (1A) | Blue | 7 | 0.21417 | 0.041777 | 36.6963 |
| Level | Temperature (C) | Level Change # | Mean | std | %std |
|---|---|---|---|---|---|
| Low (1A) | PD | 1 | 34.9977 | 0.11389 | 0.32542 |
| Medium (3A) | PD | 3 | 35.0005 | 0.10565 | 0.30185 |
| High (1A & 3A) | PD | 4 | 34.9674 | 0.11819 | 0.33799 |
| Medium (3A) | PD | 5 | 34.925 | 0.090375 | 0.25877 |
| High (1A & 3A) | PD | 6 | 34.8409 | 0.025214 | 0.072368 |
| Low (1A) | PD | 7 | 35.0435 | 0.091254 | 0.2604 |
Red PD (max value): 1.5581: #of possible satureated values 0
White PD (max value): 1.6914: #of possible satureated values 0
Blue PD (max value): 1.6005: #of possible satureated values 0
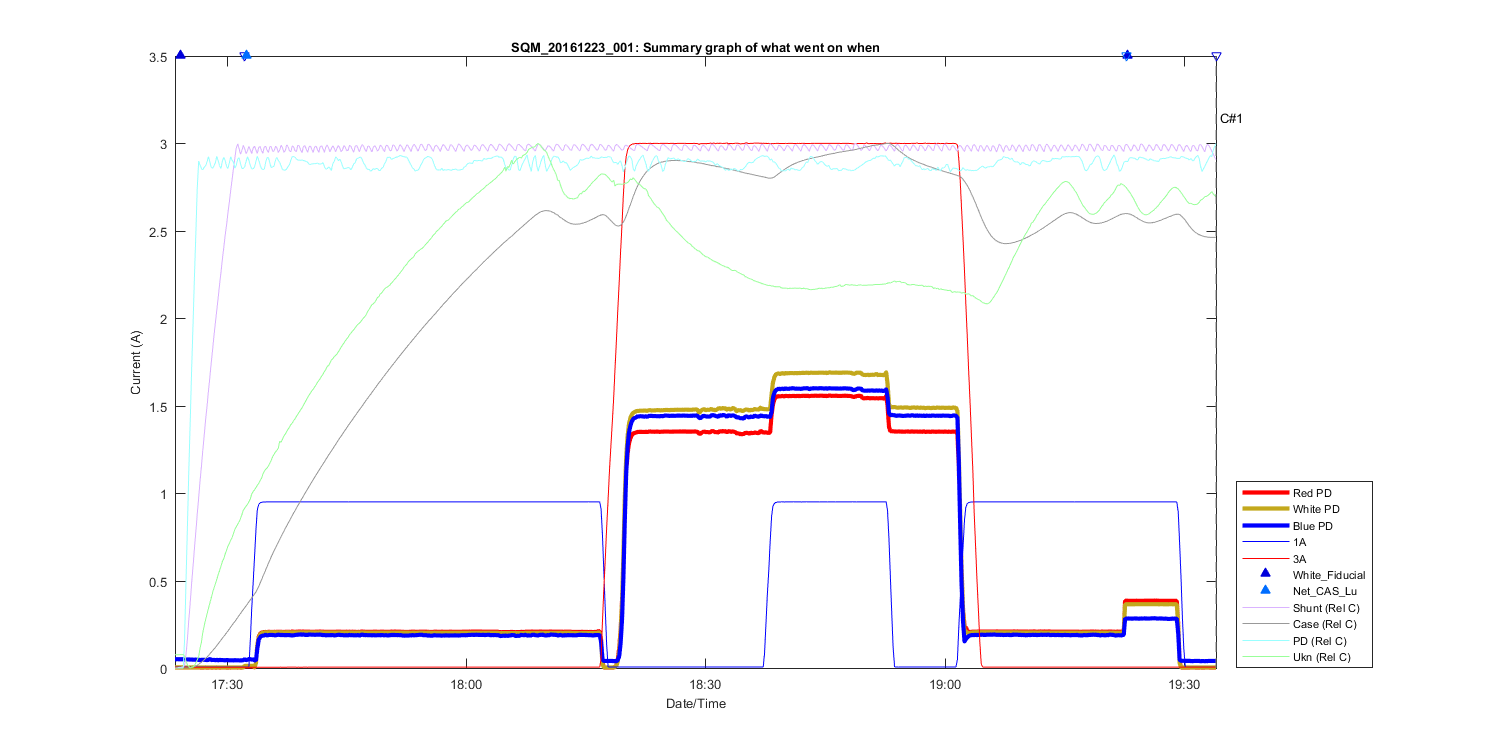
Figure 1
Summary Graph showing all measurements taken in this file, including auxilliary temperature measurements and comments. The text C# shows what time in the file the comments (shown above where made). The triangles at the top of the figure shows then a DUT (Device under test) was placed in front of the SQM and removed.
Figure 2
Figure 3
Figure 4
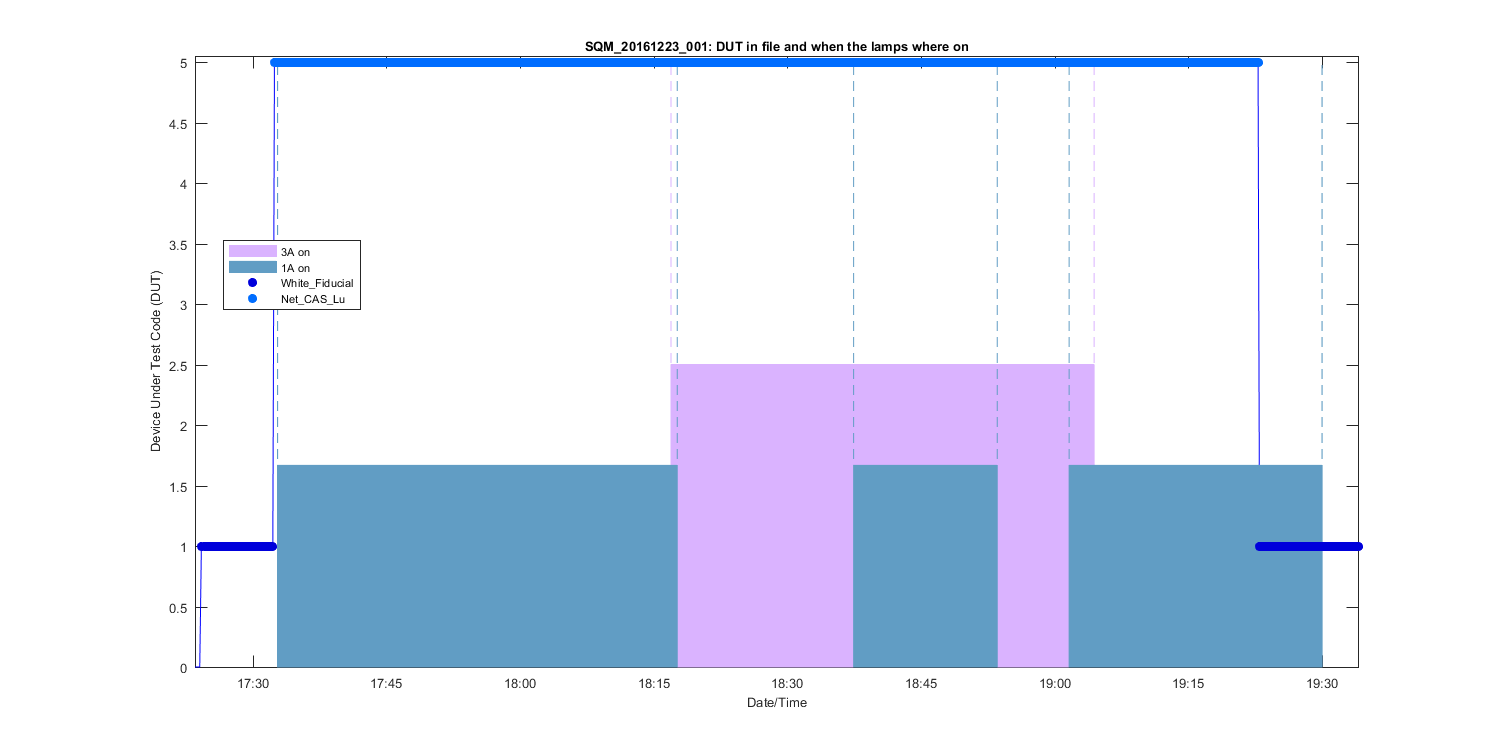
Figure 5
Figure 6
Figure 7
Figure 8
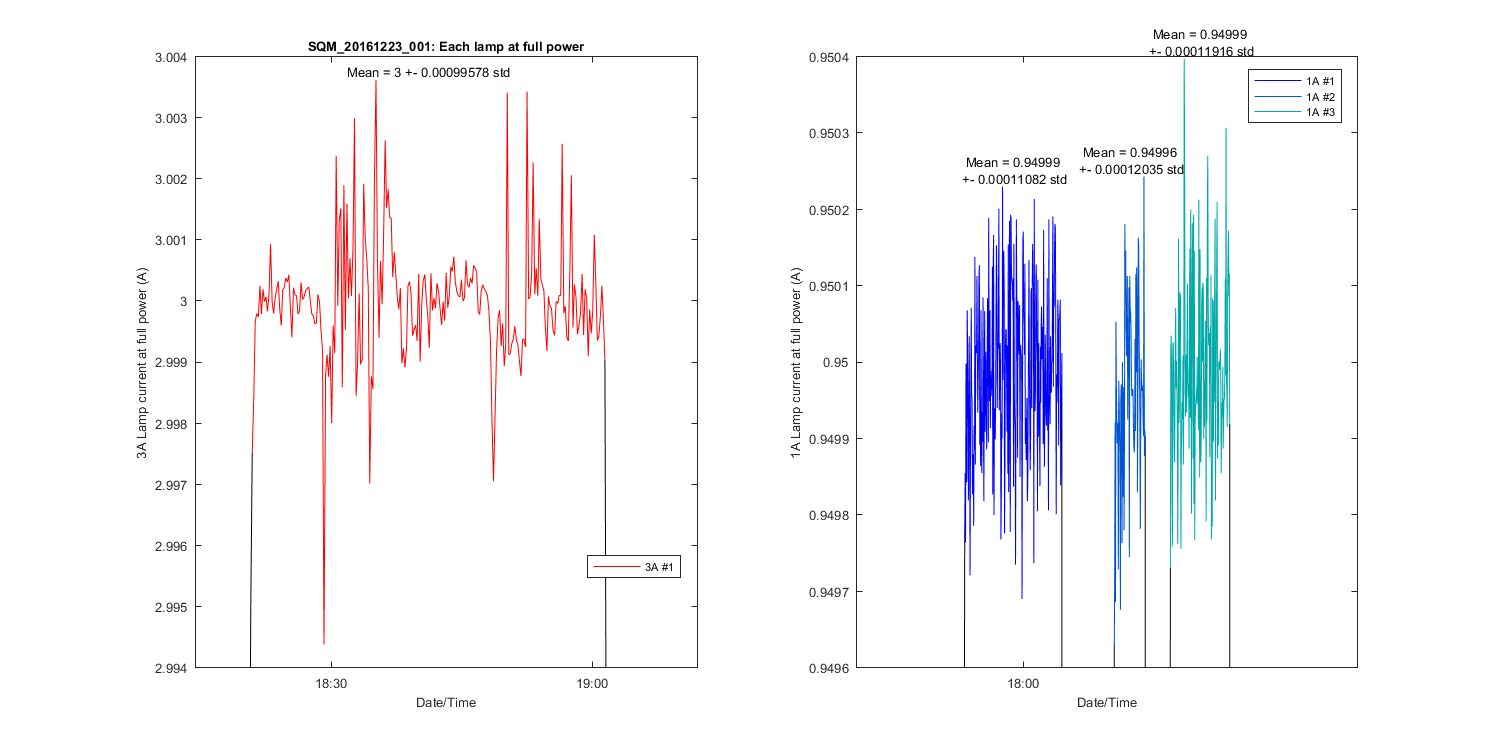
Figure 9
Figure 10