| Description | Value or Code |
|---|---|
| Cruise_Name:, Vaux(12,:) | NIST |
| Cruise_Number | 2017-001 |
| Investigator:: Vaux(16,:) | Carol Johnson |
| Location_of_Measurement: Vaux(17,:) | NIST B019_221 |
| Purpose: Vaux(18,:) | Stability Measurement |
| MOBY_NET_Sequence_Position: Vaux(20,:) | Calibration Facility |
| Ambient_Air_Temp (deg C) | 23.5 |
| Relative_Humidity (%) | 27.2 |
| #_of_Levels | 3 |
| Time_Step (sec) | 10 |
| Initial lamp state: Vaux(40,:) | All Off |
| Time_adjustment_to_GMT | 0 |
| Time_of_Last_Servicing | 20151218 |
| SQM_120VAC_On | 20170119.182130 |
| SQM_Off_to_Standby | 20170119.190015 |
| SQM_Standby_to_Off | 20170119.204742 |
| SQM_120VAC_Off | 20170119.205000 |
| Lamp 1 A burn hours | 1.67 |
| Lamp 3 A burn hours | 0.75889 |
| DAQ_Program_Version | 0 |
| File Format Version | 2 |
| DAQ_Computer: Vaux(60,:) | EOS EQUIP 13 |
| DAQ_Program_Name: Vaux(61,:) | SQM Monitor_2.0.vi |
|
All Devices Under Test in the DUT column in DATA: DUT_White_Fiducial DUT_Net_CAS_Lu DUT_VXR |
|
ASCII SQM file data: SQM_20170119_001.txt
ASCII SQM file data: PDF log file
| Lamp | On/Off # | N | Time on (hrs) | Mean (meas./set) | std | %std |
|---|---|---|---|---|---|---|
| Lamp 1A | 1 | 554 | 1.6203 | 0.94999 / 0.95 | 0.00013765 | 0.01449 |
| Lamp 3A | 1 | 219 | 0.64194 | 2.9999 / 3 | 0.00044995 | 0.014998 |
| Level | PD internal monitor (V) | Level Change # | Mean | std | %std |
|---|---|---|---|---|---|
| Low (1A) | Red | 1 | 0.33151 | 0.080588 | 24.3092 |
| Low (1A) | White | 1 | 0.31745 | 0.075293 | 25.3863 |
| Low (1A) | Blue | 1 | 0.25274 | 0.04203 | 31.8862 |
| High (1A & 3A) | Red | 2 | 1.456 | 0.32452 | 22.2879 |
| High (1A & 3A) | White | 2 | 1.5733 | 0.35944 | 20.6262 |
| High (1A & 3A) | Blue | 2 | 1.492 | 0.34717 | 21.7508 |
| Level | Temperature (C) | Level Change # | Mean | std | %std |
|---|---|---|---|---|---|
| Low (1A) | PD | 1 | 35.0139 | 0.11725 | 0.33486 |
| High (1A & 3A) | PD | 2 | 34.9954 | 0.12 | 0.34291 |
Red PD (max value): 1.5939: #of possible satureated values 0
White PD (max value): 1.7023: #of possible satureated values 0
Blue PD (max value): 1.6112: #of possible satureated values 0
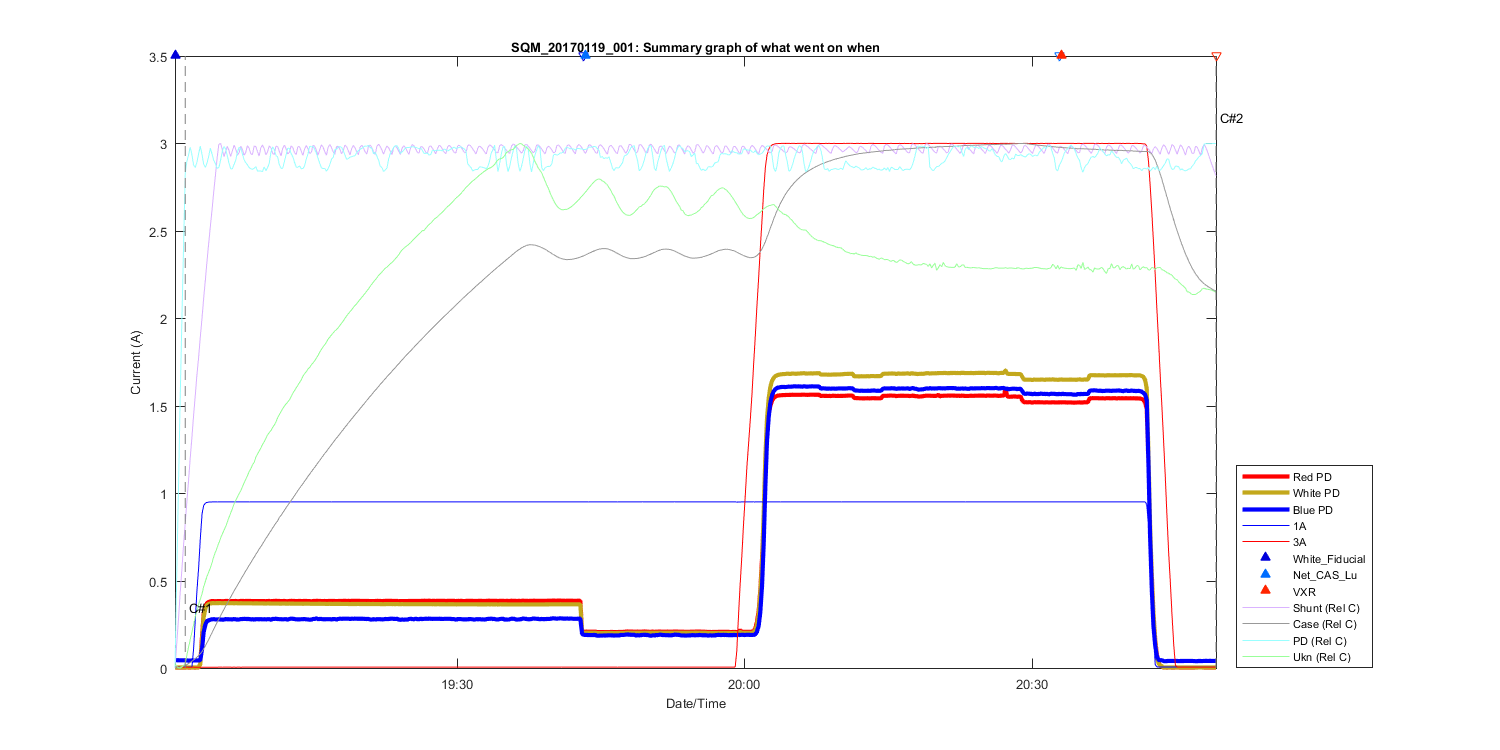
Figure 1
Summary Graph showing all measurements taken in this file, including auxilliary temperature measurements and comments. The text C# shows what time in the file the comments (shown above where made). The triangles at the top of the figure shows then a DUT (Device under test) was placed in front of the SQM and removed.
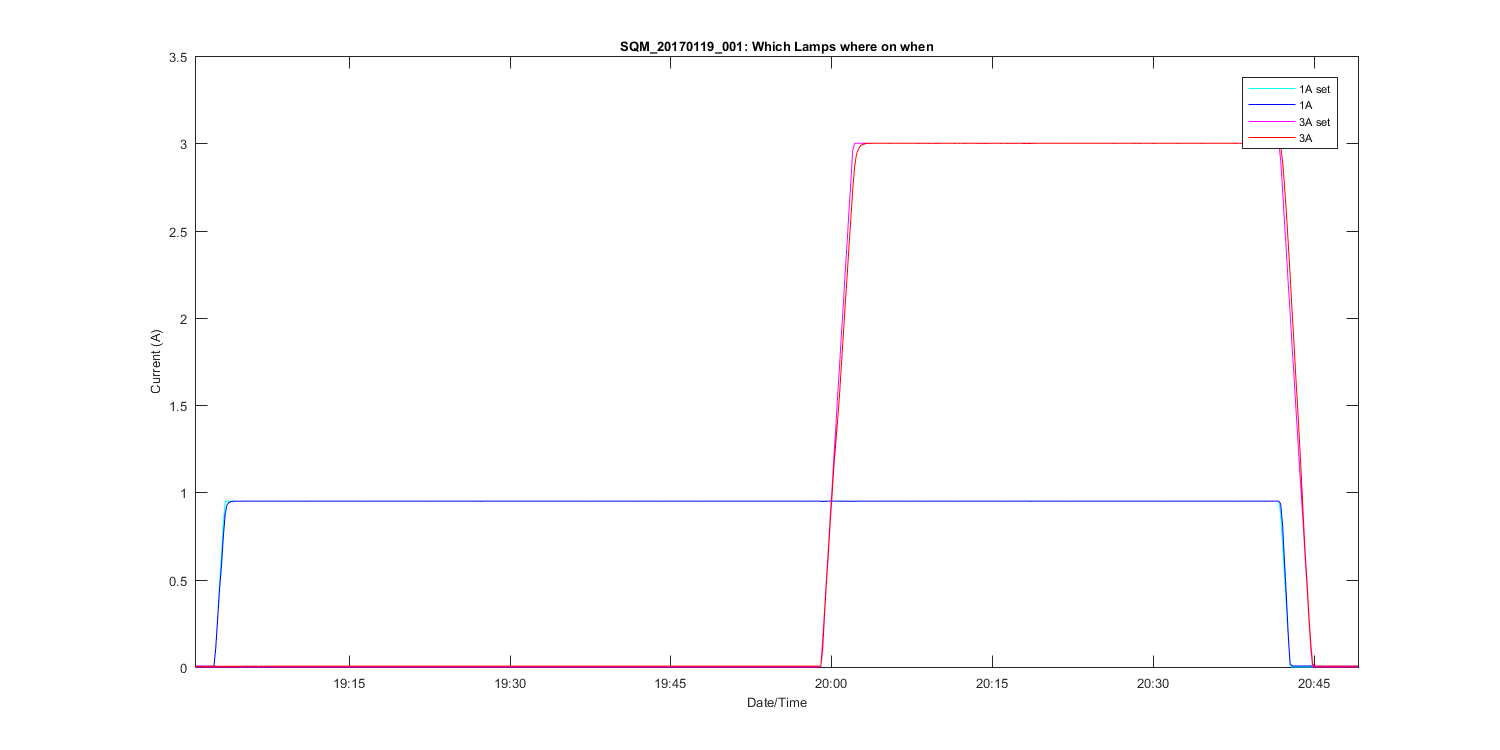
Figure 2
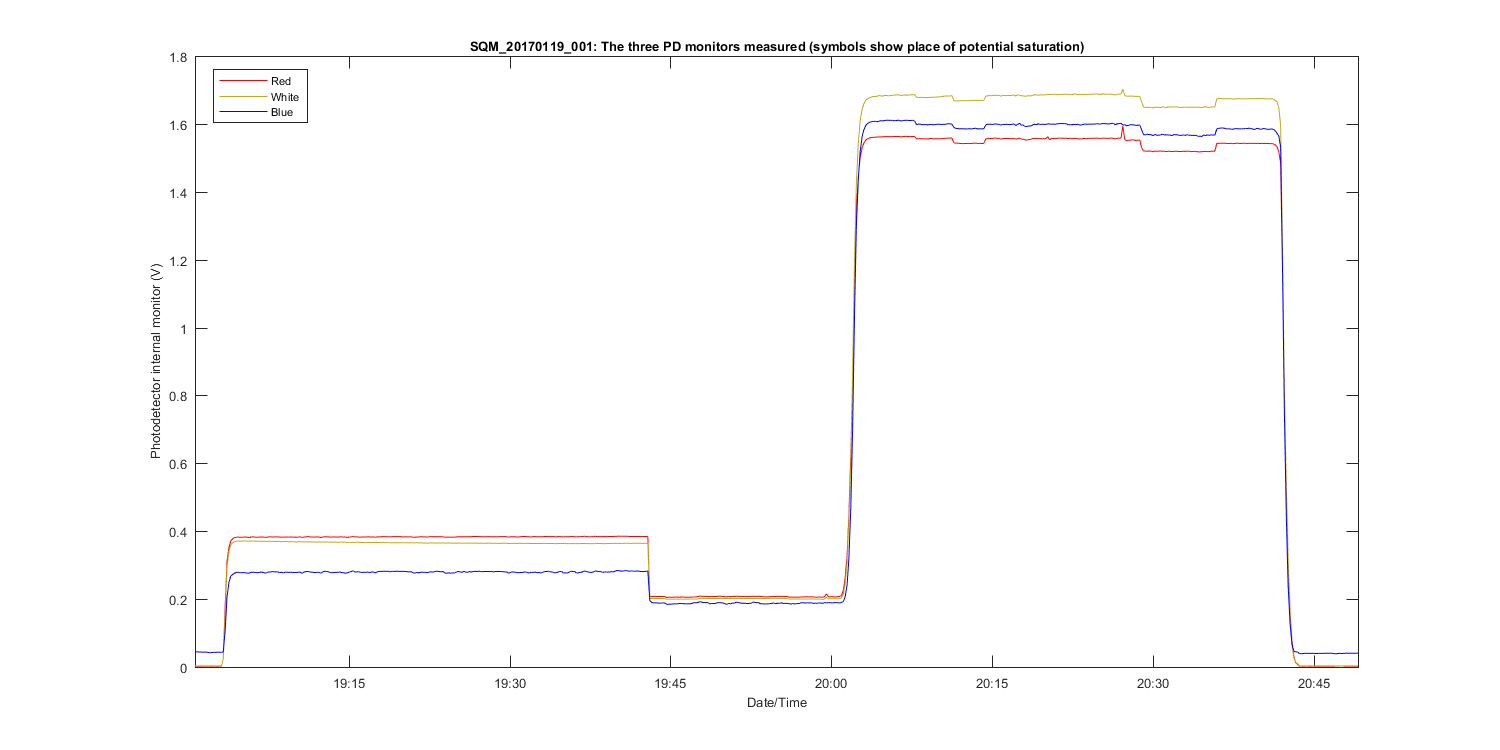
Figure 3
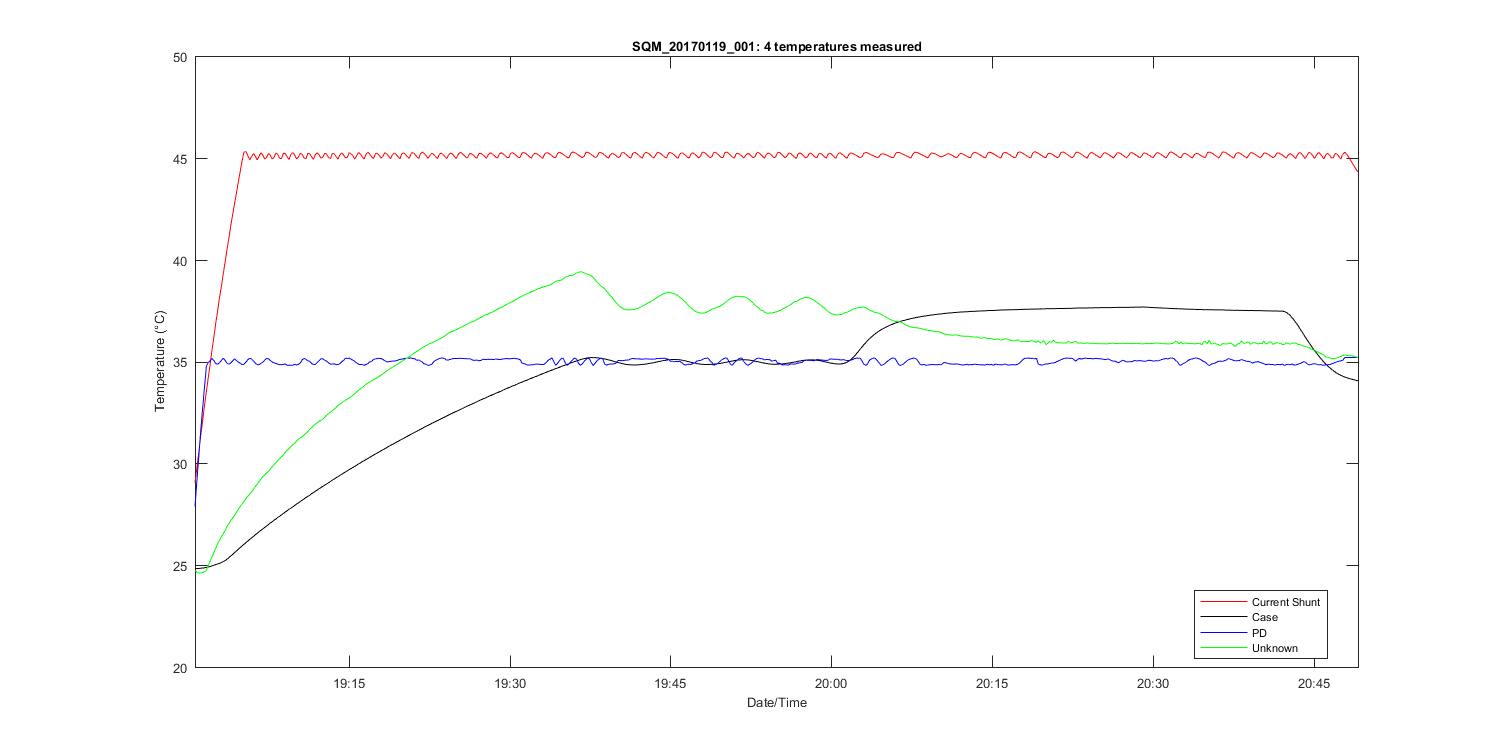
Figure 4
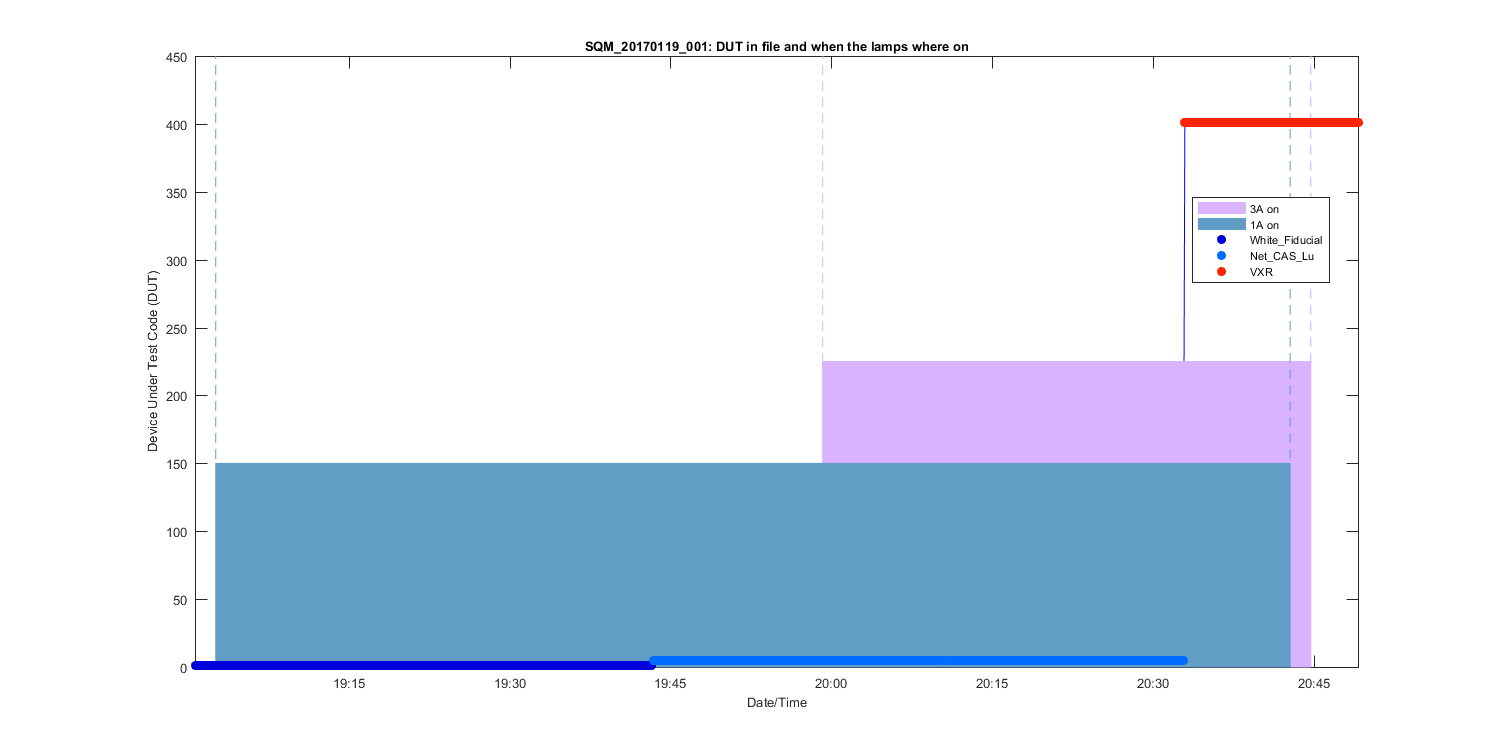
Figure 5
Figure 6
Figure 7
Figure 8
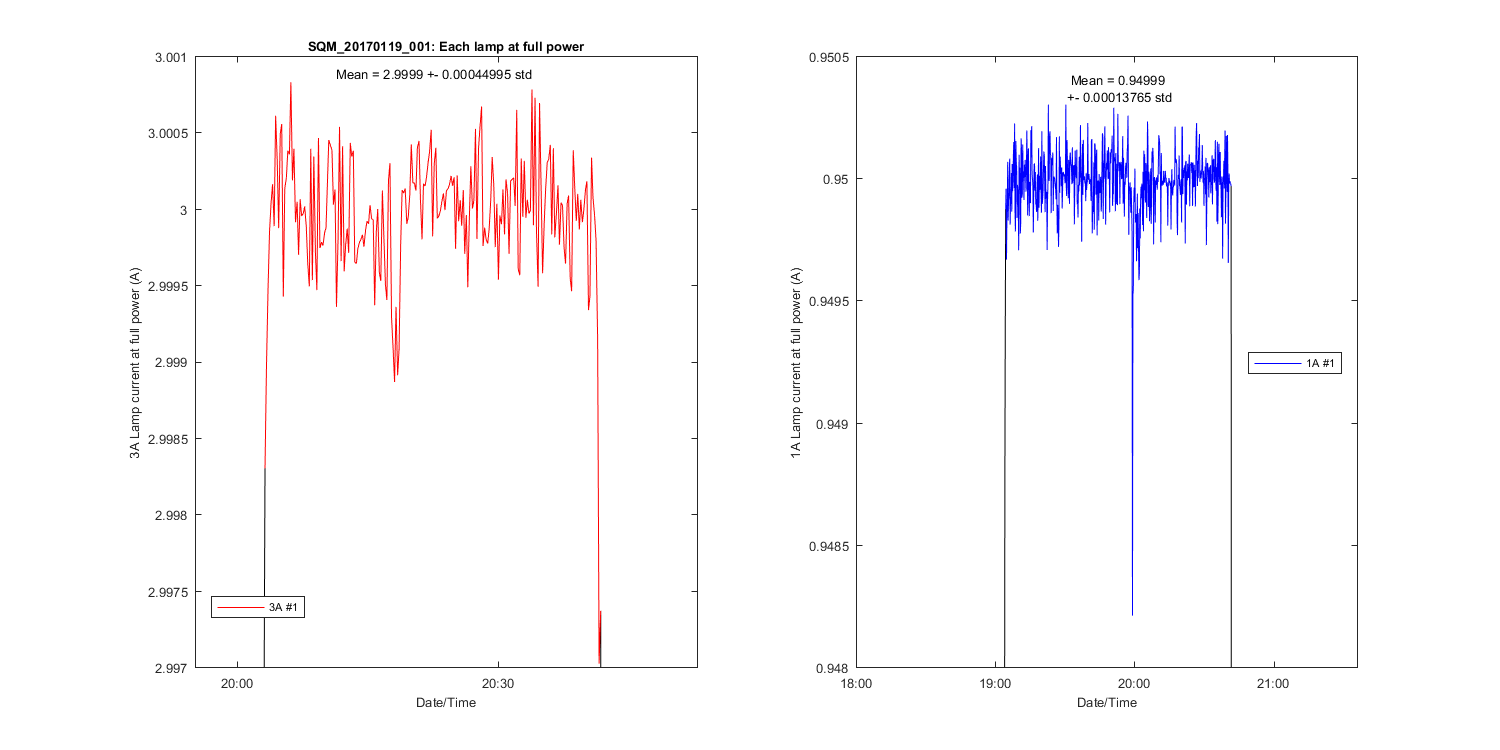
Figure 9
Figure 10