| Description | Value or Code |
|---|---|
| Cruise_Name:, Vaux(12,:) | NIST |
| Cruise_Number | 2017-001 |
| Investigator:: Vaux(16,:) | Carol Johnson |
| Location_of_Measurement: Vaux(17,:) | NIST B019_221 |
| Purpose: Vaux(18,:) | Stability Measurement |
| MOBY_NET_Sequence_Position: Vaux(20,:) | Calibration Facility |
| Ambient_Air_Temp (deg C) | 23.6 |
| Relative_Humidity (%) | 17.9 |
| #_of_Levels | 3 |
| Time_Step (sec) | 10 |
| Initial lamp state: Vaux(40,:) | All Off |
| Time_adjustment_to_GMT | 0 |
| Time_of_Last_Servicing | 20151218 |
| SQM_120VAC_On | 20170127.141401 |
| SQM_Off_to_Standby | 20170127.141424 |
| SQM_Standby_to_Off | 20170127.214201 |
| SQM_120VAC_Off | 20170127.214300 |
| Lamp 1 A burn hours | 1.2058 |
| Lamp 3 A burn hours | 0.365 |
| DAQ_Program_Version | 0 |
| File Format Version | 2 |
| DAQ_Computer: Vaux(60,:) | EOS EQUIP 13 |
| DAQ_Program_Name: Vaux(61,:) | SQM Monitor_2.0.vi |
|
All Devices Under Test in the DUT column in DATA: DUT_White_Fiducial DUT_Net_CAS_Lu DUT_VXR |
|
ASCII SQM file data: SQM_20170127_001.txt
ASCII SQM file data: PDF log file
| Lamp | On/Off # | N | Time on (hrs) | Mean (meas./set) | std | %std |
|---|---|---|---|---|---|---|
| Lamp 1A | 1 | 397 | 1.1564 | 0.94999 / 0.95 | 0.00012608 | 0.013272 |
| Lamp 3A | 1 | 86 | 0.24806 | 2.9998 / 3 | 0.0012763 | 0.042546 |
| Level | PD internal monitor (V) | Level Change # | Mean | std | %std |
|---|---|---|---|---|---|
| Low (1A) | Red | 1 | 0.27311 | 0.085378 | 31.2616 |
| Low (1A) | White | 1 | 0.26241 | 0.078068 | 32.5364 |
| Low (1A) | Blue | 1 | 0.22384 | 0.043921 | 38.1416 |
| High (1A & 3A) | Red | 2 | 1.3405 | 0.46657 | 34.8058 |
| High (1A & 3A) | White | 2 | 1.4423 | 0.51452 | 32.3501 |
| High (1A & 3A) | Blue | 2 | 1.3664 | 0.49673 | 34.1467 |
| Level | Temperature (C) | Level Change # | Mean | std | %std |
|---|---|---|---|---|---|
| Low (1A) | PD | 1 | 35.013 | 0.11388 | 0.32525 |
| High (1A & 3A) | PD | 2 | 35.0749 | 0.10921 | 0.31137 |
Red PD (max value): 1.6158: #of possible satureated values 0
White PD (max value): 1.7205: #of possible satureated values 0
Blue PD (max value): 1.6108: #of possible satureated values 0
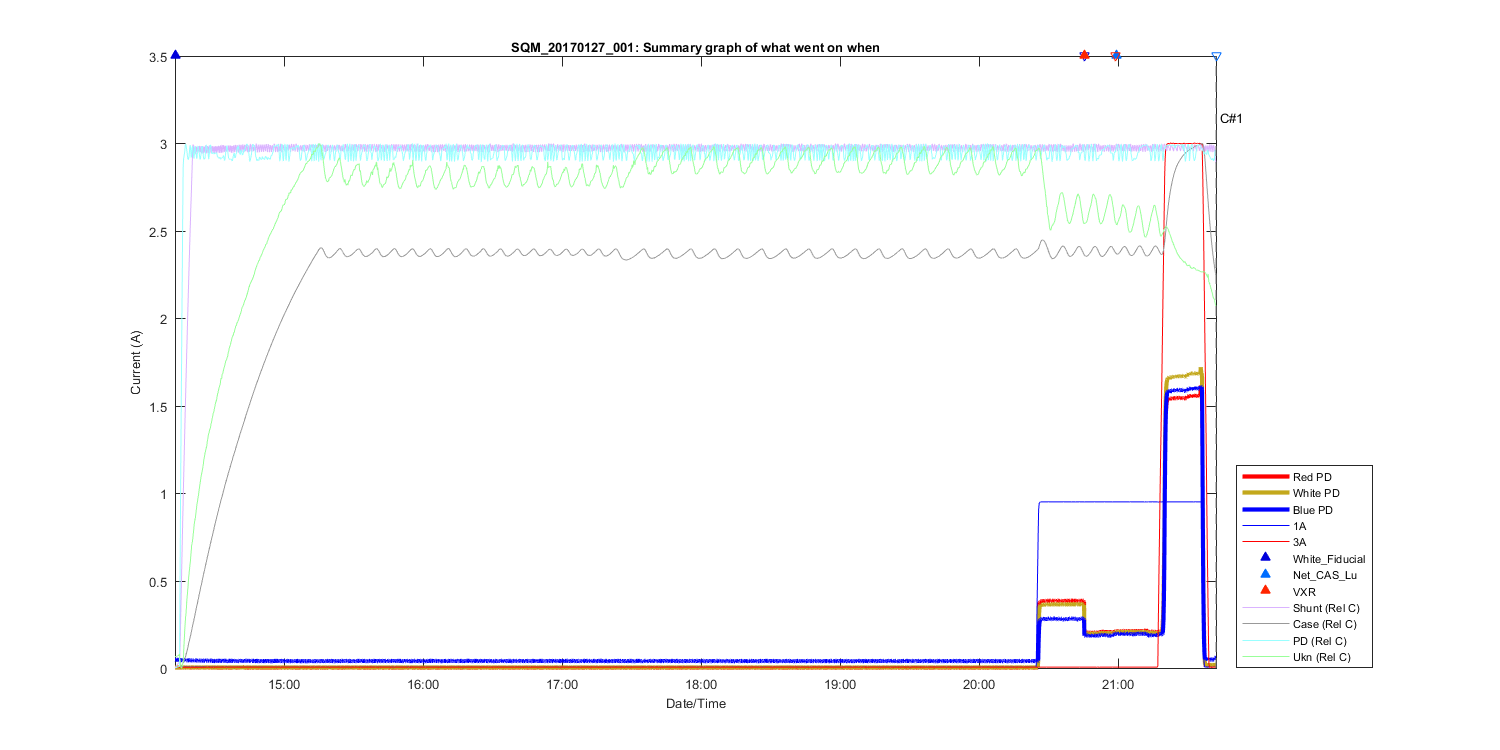
Figure 1
Summary Graph showing all measurements taken in this file, including auxilliary temperature measurements and comments. The text C# shows what time in the file the comments (shown above where made). The triangles at the top of the figure shows then a DUT (Device under test) was placed in front of the SQM and removed.
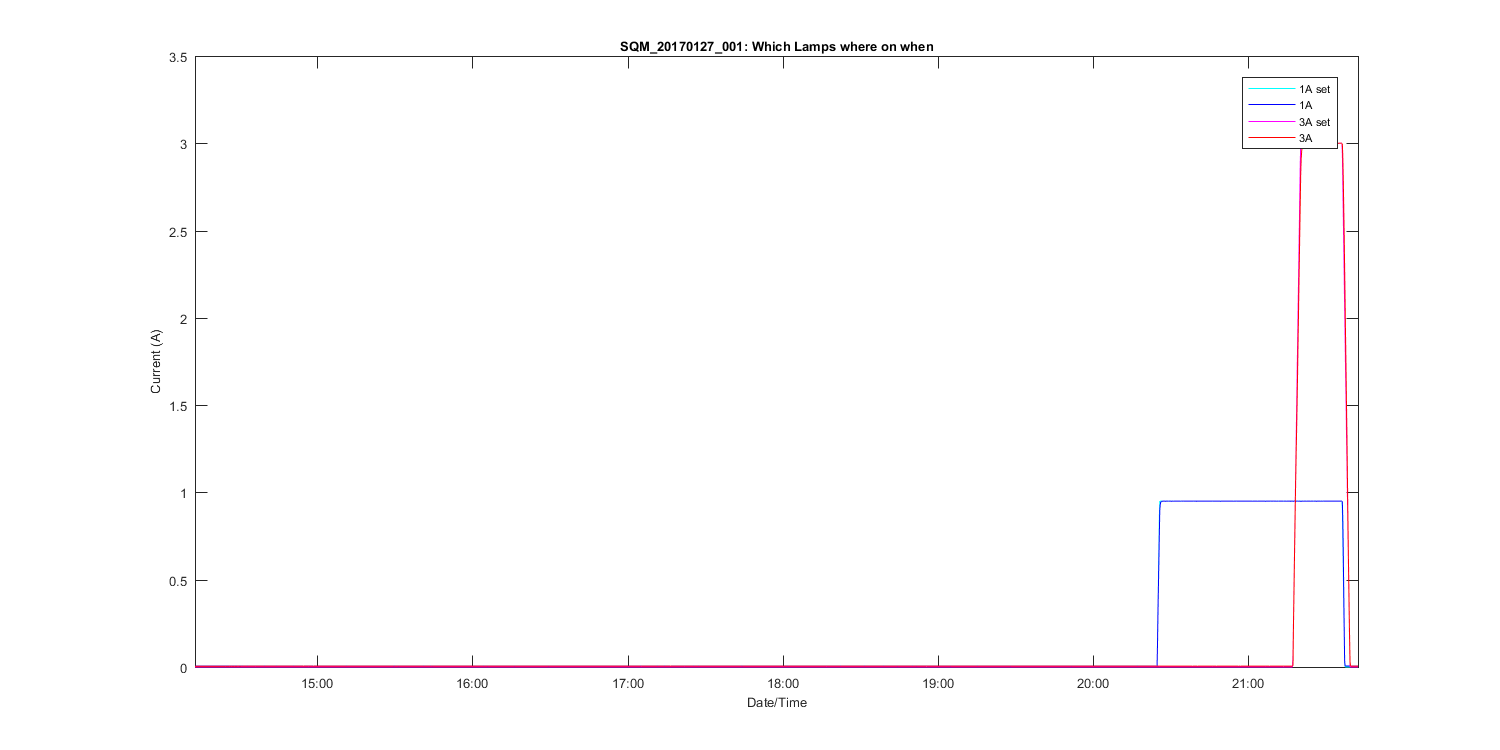
Figure 2
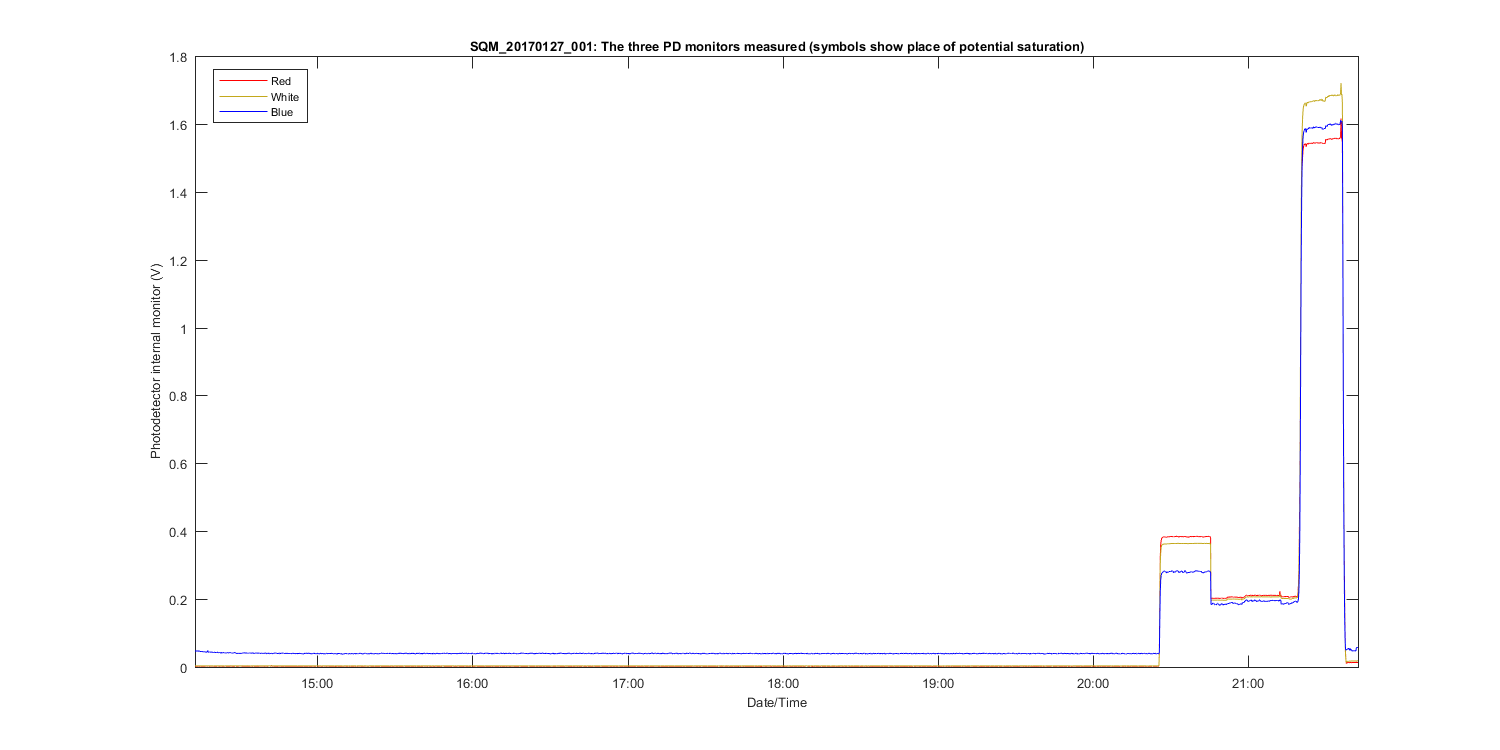
Figure 3
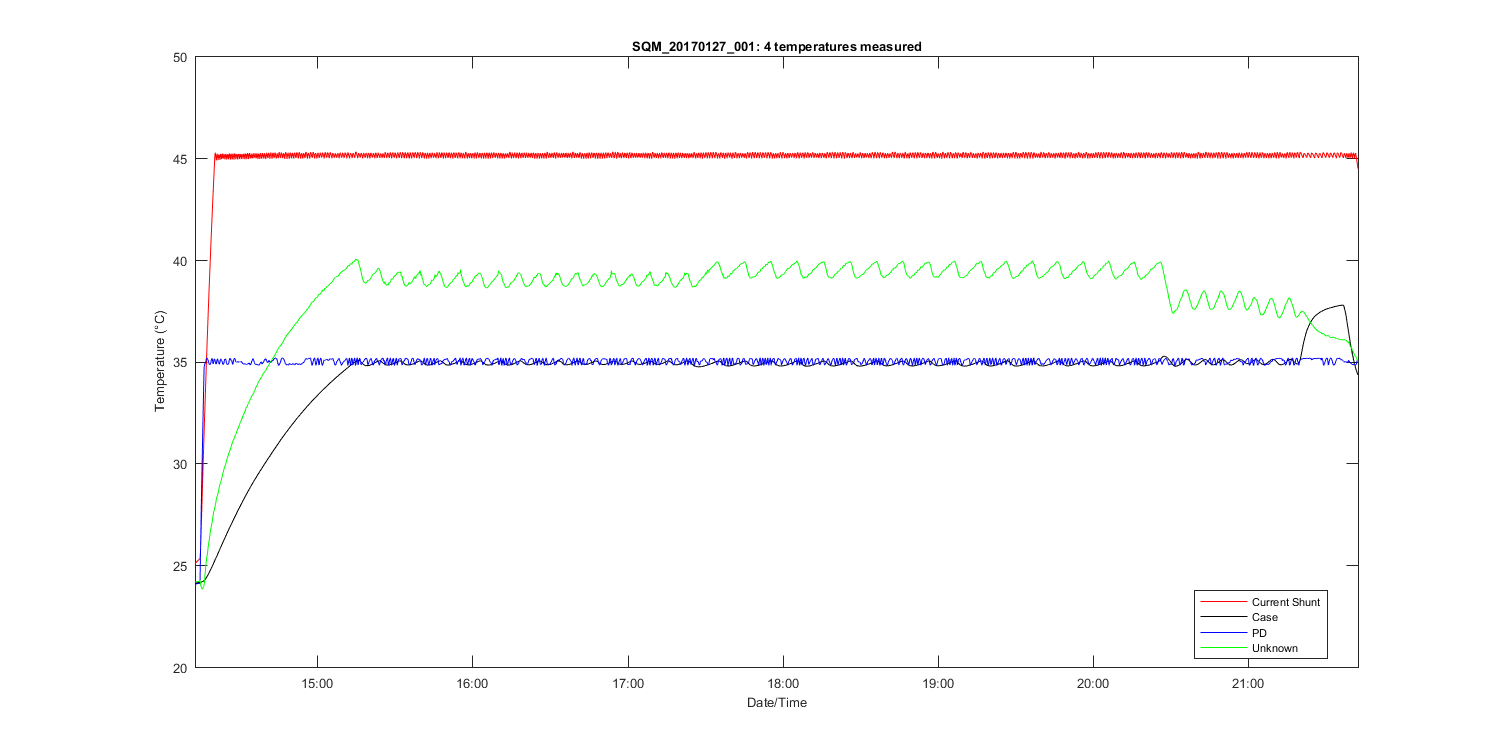
Figure 4
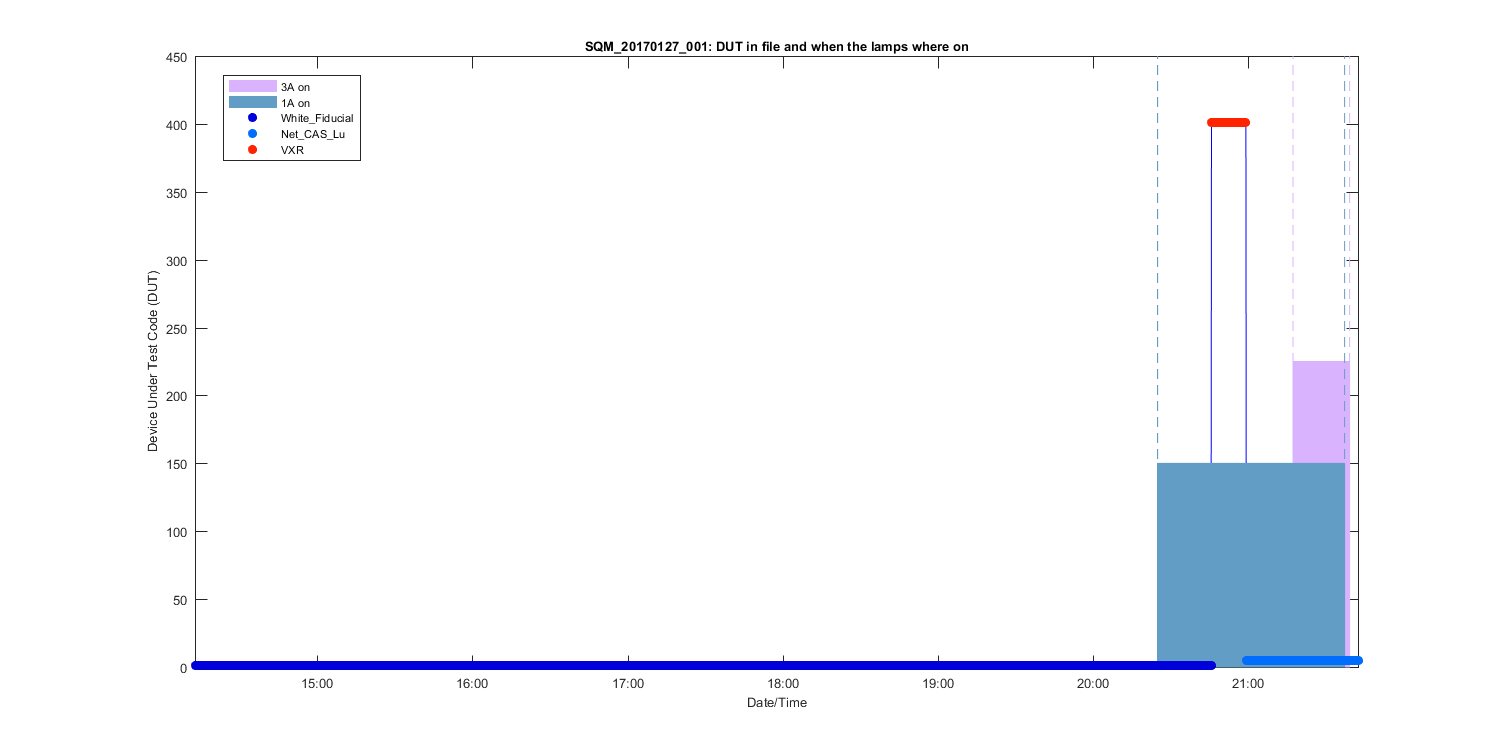
Figure 5
Figure 6
Figure 7
Figure 8
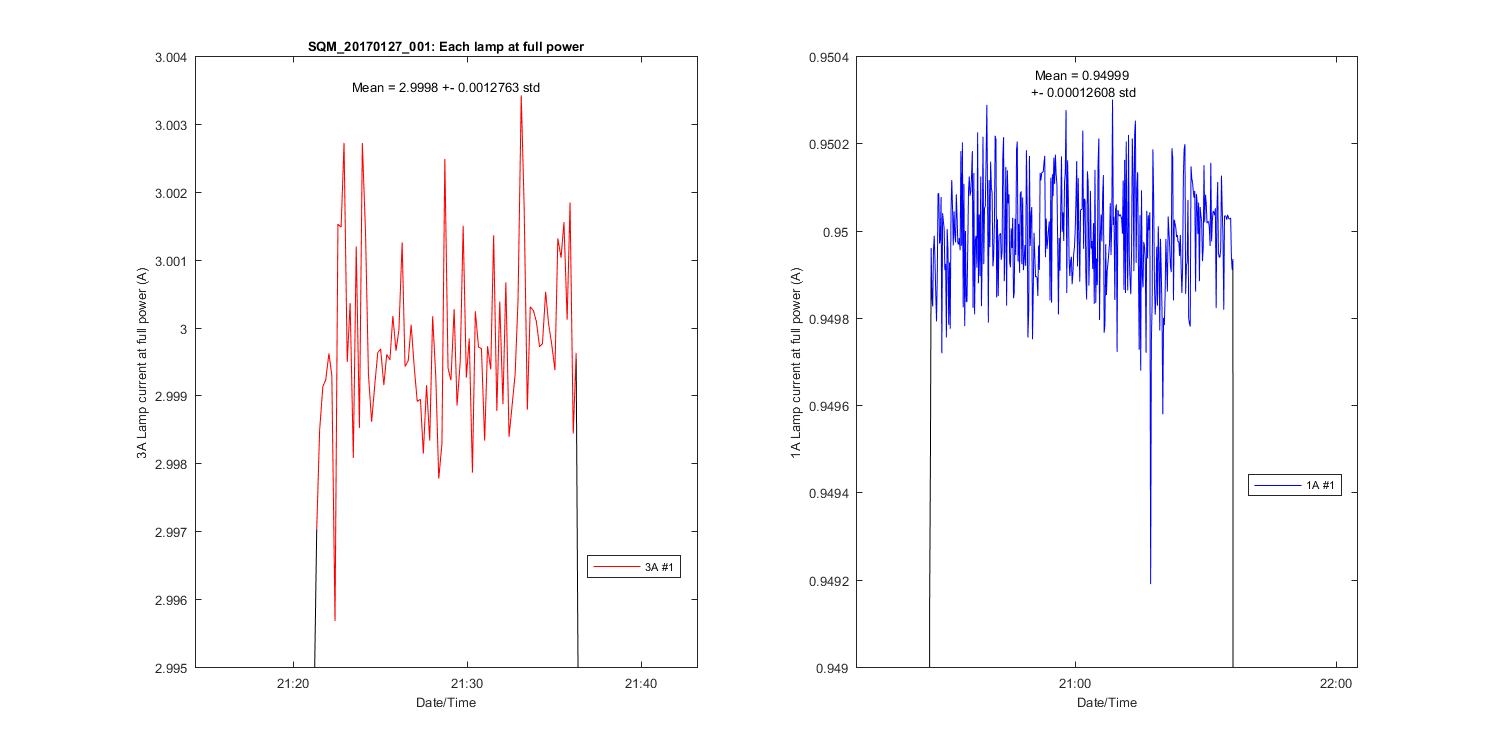
Figure 9
Figure 10