| Description | Value or Code |
|---|---|
| Cruise_Name:, Vaux(12,:) | NIST |
| Cruise_Number | 2017-001 |
| Investigator:: Vaux(16,:) | Carol Johnson |
| Location_of_Measurement: Vaux(17,:) | NIST B019_221 |
| Purpose: Vaux(18,:) | Stability Measurement |
| MOBY_NET_Sequence_Position: Vaux(20,:) | Calibration Facility |
| Ambient_Air_Temp (deg C) | 23.4 |
| Relative_Humidity (%) | 31.2 |
| #_of_Levels | 3 |
| Time_Step (sec) | 10 |
| Initial lamp state: Vaux(40,:) | All Off |
| Time_adjustment_to_GMT | 0 |
| Time_of_Last_Servicing | 20151218 |
| SQM_120VAC_On | 20170321.173100 |
| SQM_Off_to_Standby | 20170321.173100 |
| SQM_Standby_to_Off | 20170321.211329 |
| SQM_120VAC_Off | 20170321.211500 |
| Lamp 1 A burn hours | 1.1781 |
| Lamp 3 A burn hours | 0.555 |
| DAQ_Program_Version | 0 |
| File Format Version | 2 |
| DAQ_Computer: Vaux(60,:) | EOS EQUIP 13 |
| DAQ_Program_Name: Vaux(61,:) | SQM Monitor_2.0.vi |
|
All Devices Under Test in the DUT column in DATA: DUT_White_Fiducial DUT_Net_CAS_Lu DUT_VXR |
|
ASCII SQM file data: SQM_20170321_001.txt
ASCII SQM file data: PDF log file
| Lamp | On/Off # | N | Time on (hrs) | Mean (meas./set) | std | %std |
|---|---|---|---|---|---|---|
| Lamp 1A | 1 | 388 | 1.1325 | 0.94996 / 0.95 | 0.0002369 | 0.024938 |
| Lamp 3A | 1 | 149 | 0.43222 | 3 / 3 | 0.00054907 | 0.018302 |
| Level | PD internal monitor (V) | Level Change # | Mean | std | %std |
|---|---|---|---|---|---|
| Low (1A) | Red | 1 | 0.27201 | 0.086346 | 31.7439 |
| Low (1A) | White | 1 | 0.26126 | 0.079035 | 33.0499 |
| Low (1A) | Blue | 1 | 0.22241 | 0.045062 | 38.8231 |
| High (1A & 3A) | Red | 2 | 1.4129 | 0.37391 | 26.4636 |
| High (1A & 3A) | White | 2 | 1.5269 | 0.41407 | 24.488 |
| High (1A & 3A) | Blue | 2 | 1.4459 | 0.40025 | 25.8609 |
| Level | Temperature (C) | Level Change # | Mean | std | %std |
|---|---|---|---|---|---|
| Low (1A) | PD | 1 | 35.0235 | 0.11533 | 0.32929 |
| High (1A & 3A) | PD | 2 | 34.9141 | 0.1093 | 0.31304 |
Red PD (max value): 1.5719: #of possible satureated values 0
White PD (max value): 1.7043: #of possible satureated values 0
Blue PD (max value): 1.6034: #of possible satureated values 0
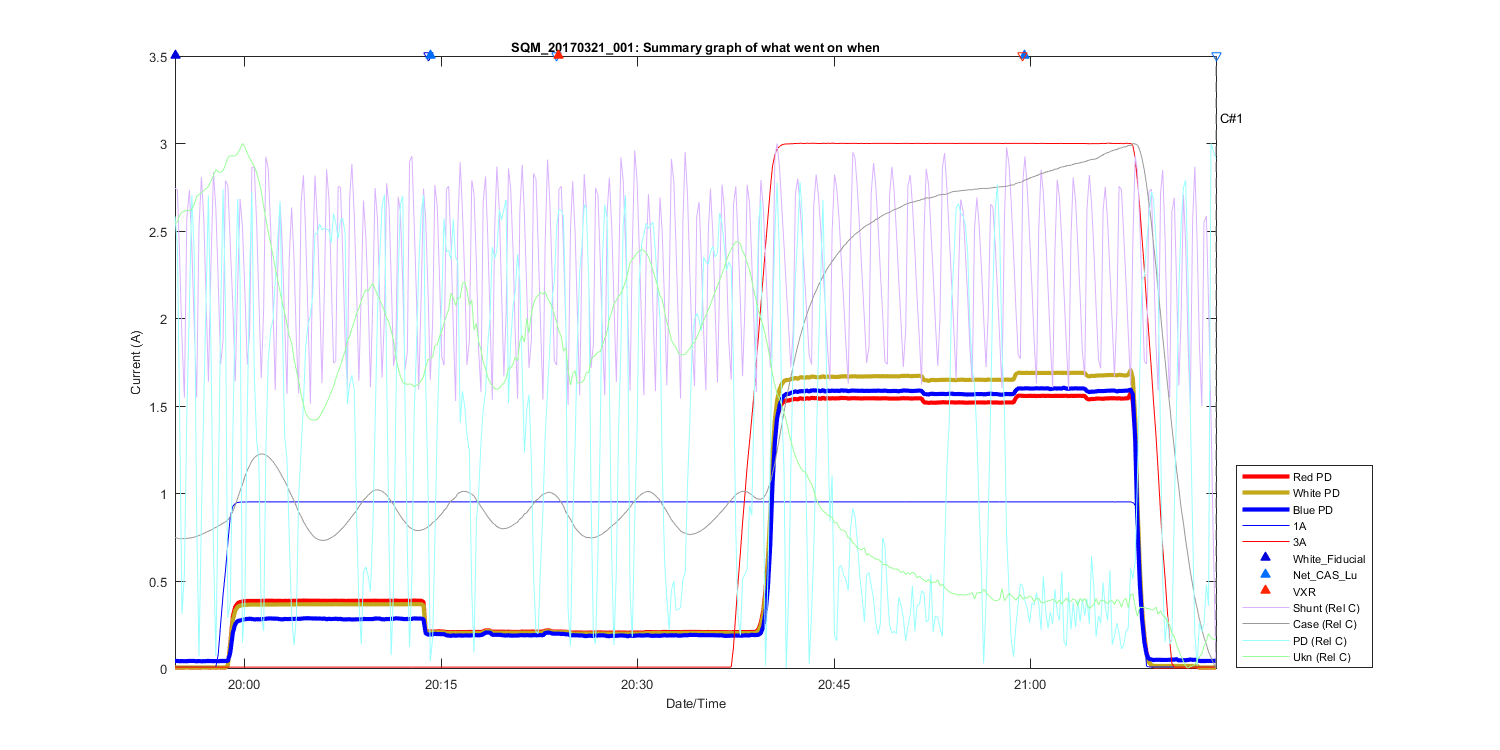
Figure 1
Summary Graph showing all measurements taken in this file, including auxilliary temperature measurements and comments. The text C# shows what time in the file the comments (shown above where made). The triangles at the top of the figure shows then a DUT (Device under test) was placed in front of the SQM and removed.
Figure 2
Figure 3
Figure 4
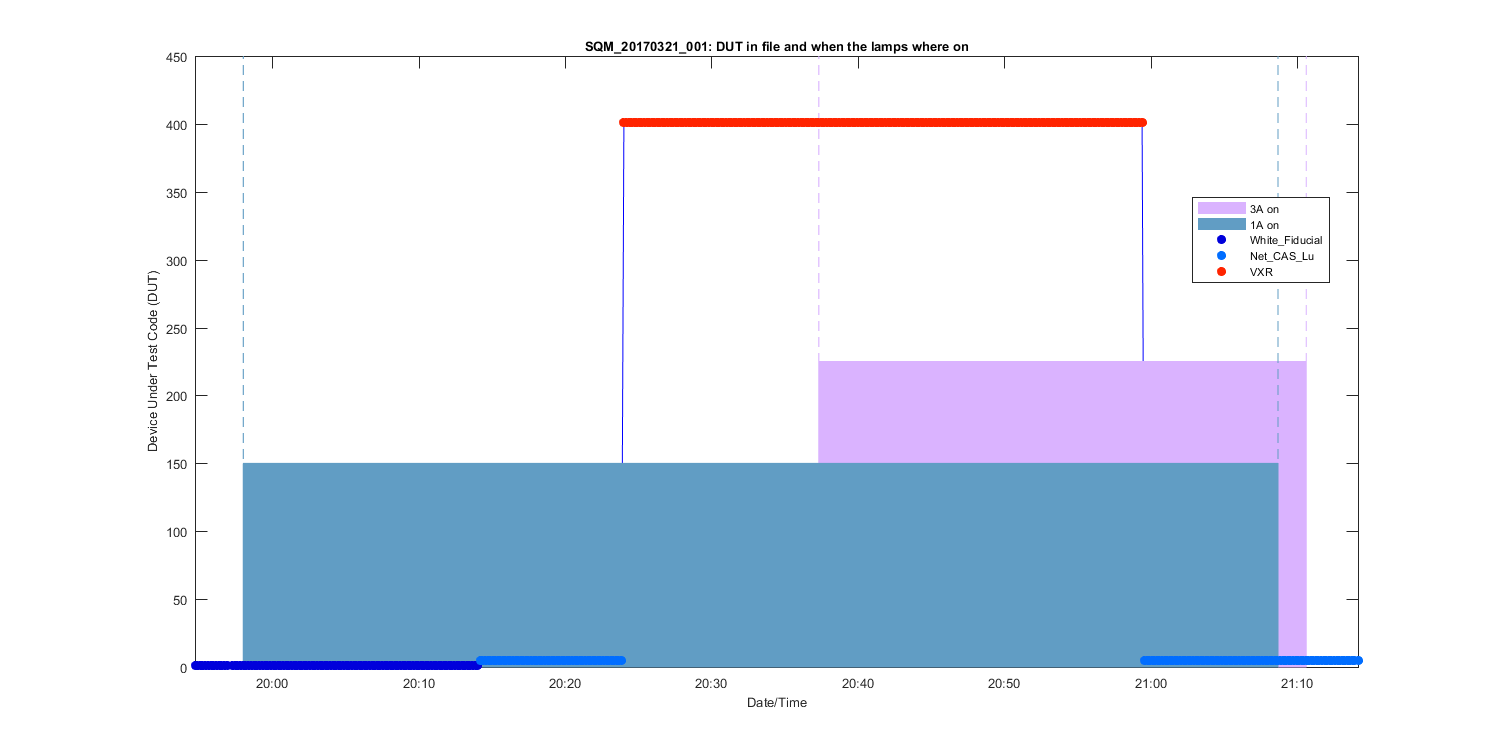
Figure 5
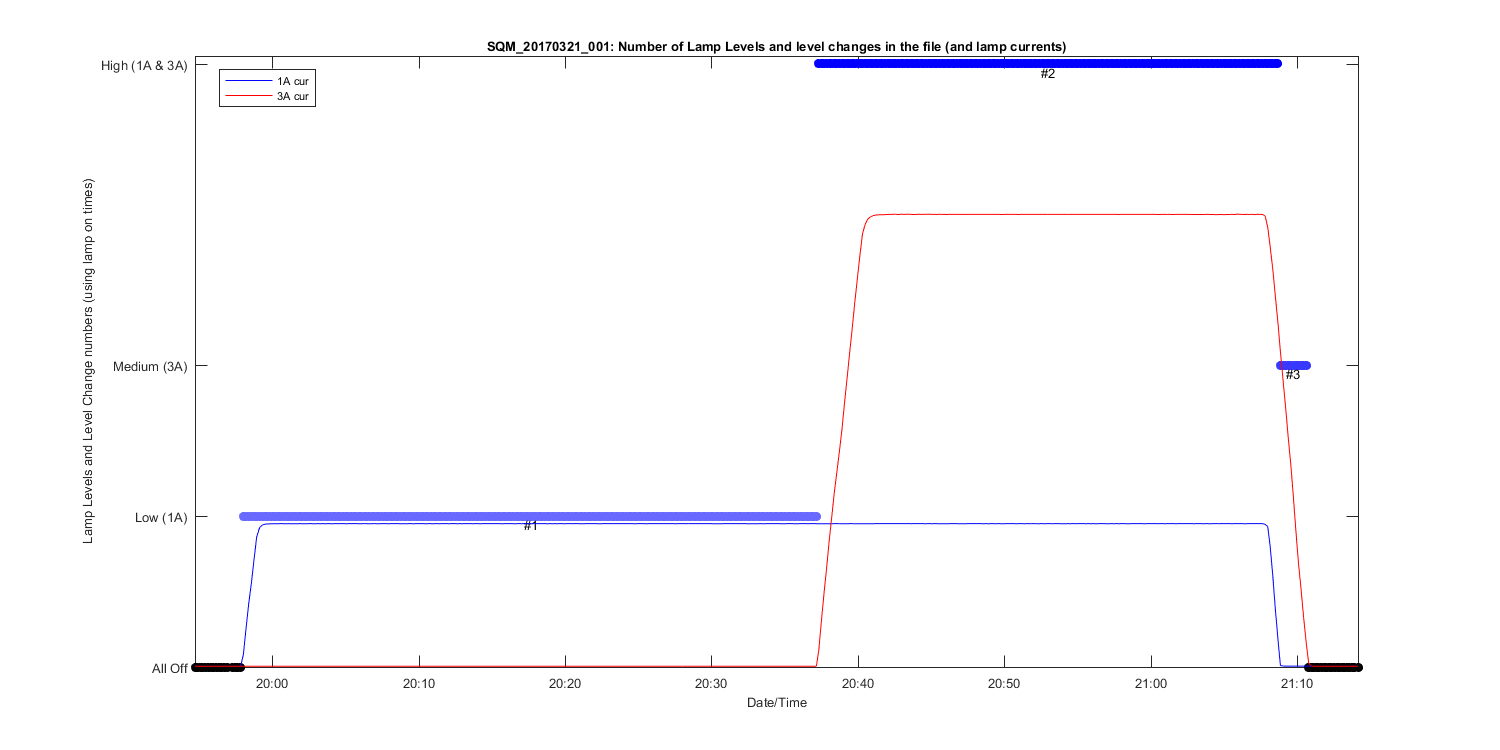
Figure 6
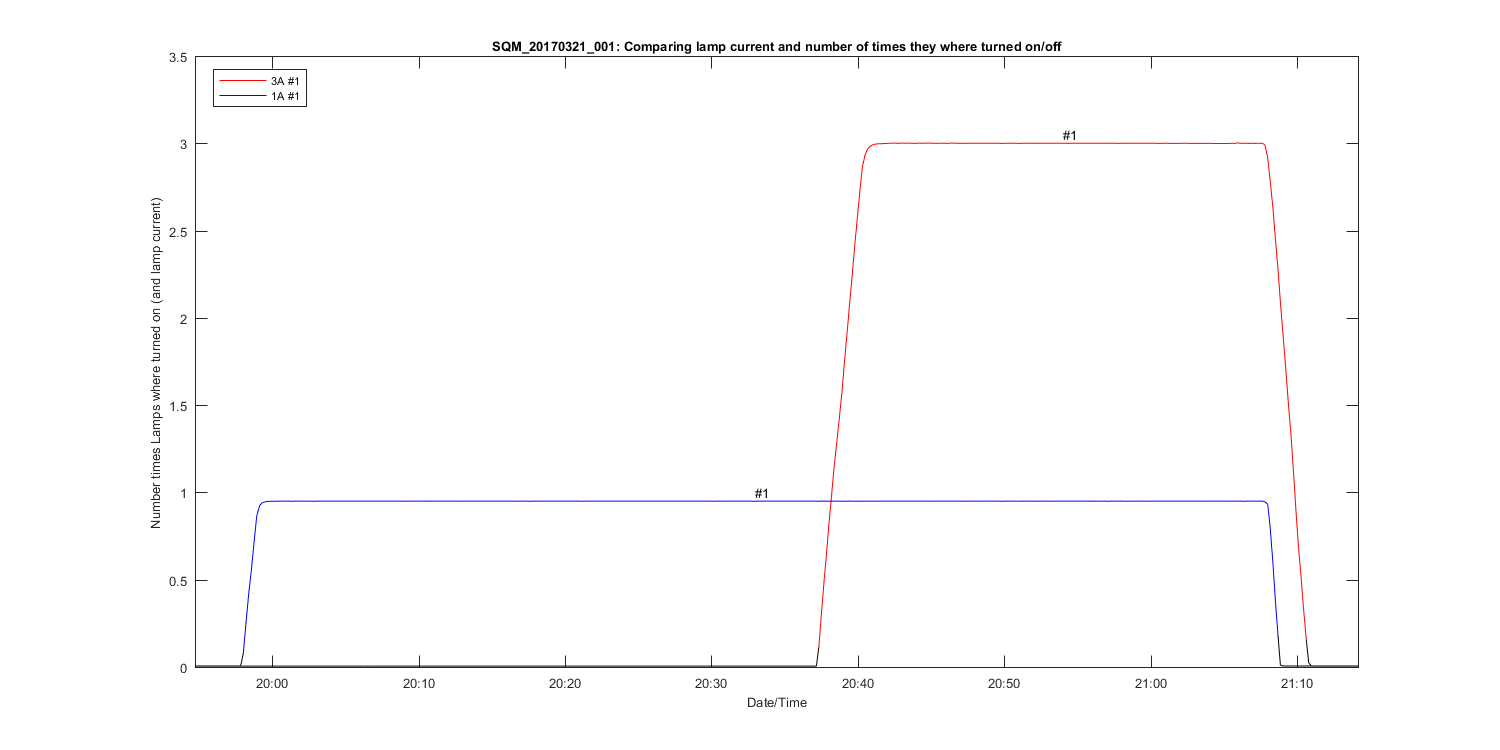
Figure 7
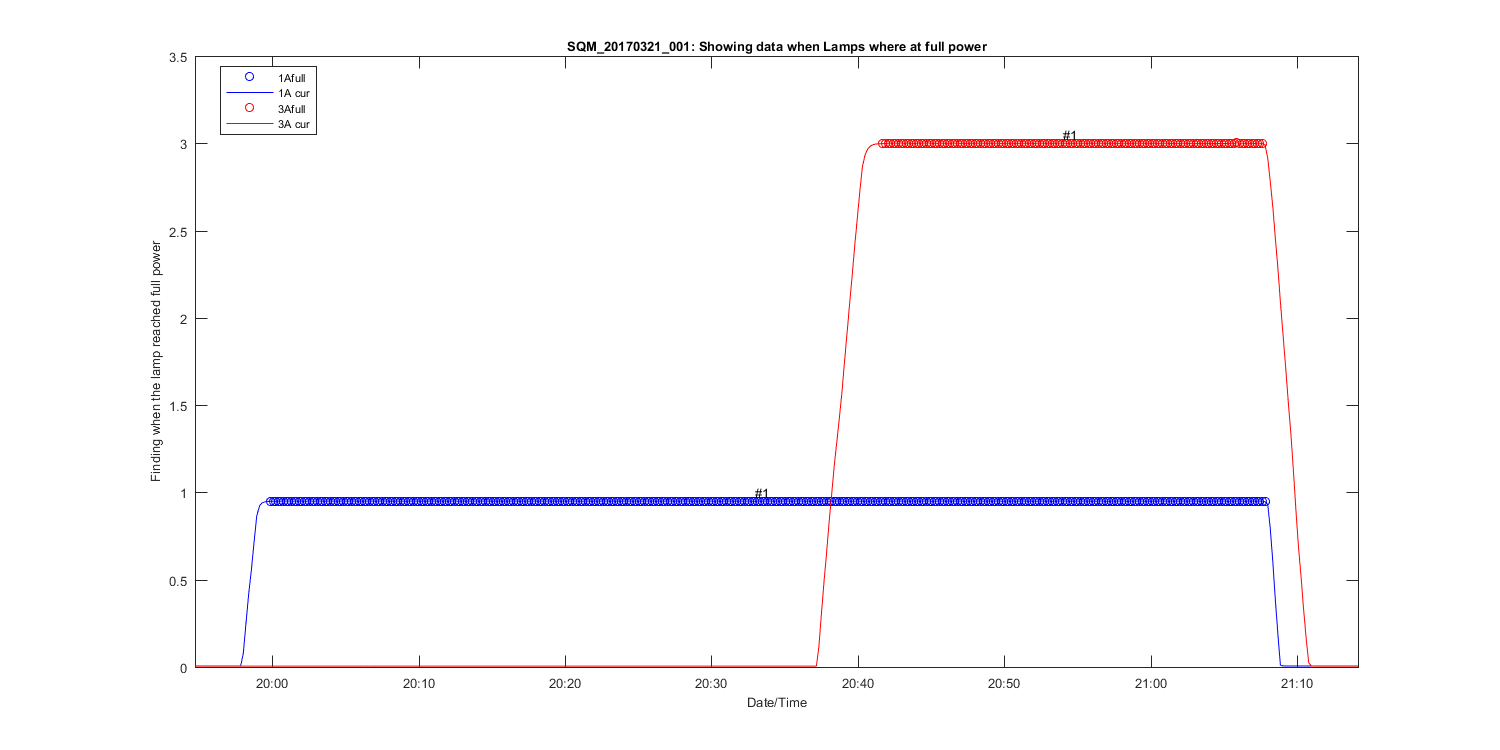
Figure 8
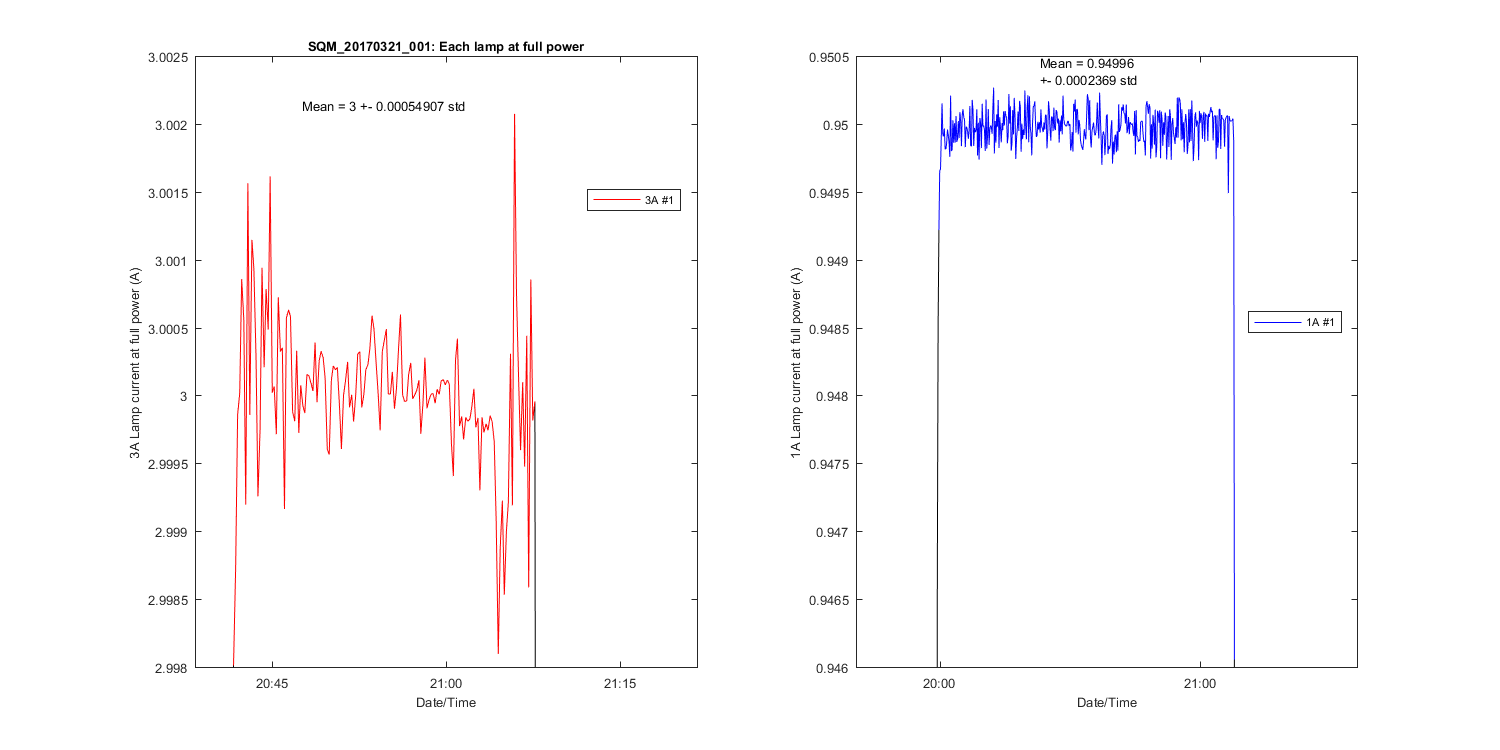
Figure 9
Figure 10