| Description | Value or Code |
|---|---|
| Cruise_Name:, Vaux(12,:) | NIST |
| Cruise_Number | 2017-001 |
| Investigator:: Vaux(16,:) | Carol Johnson |
| Location_of_Measurement: Vaux(17,:) | NIST B019_221 |
| Purpose: Vaux(18,:) | Stability Measurement |
| MOBY_NET_Sequence_Position: Vaux(20,:) | Calibration Facility |
| Ambient_Air_Temp (deg C) | 23 |
| Relative_Humidity (%) | 19 |
| #_of_Levels | 4 |
| Time_Step (sec) | 10 |
| Initial lamp state: Vaux(40,:) | All Off |
| Time_adjustment_to_GMT | 0 |
| Time_of_Last_Servicing | 20151218 |
| SQM_120VAC_On | 20170322.132900 |
| SQM_Off_to_Standby | 20170322.133059 |
| SQM_Standby_to_Off | 20170322.161338 |
| SQM_120VAC_Off | 20170322.161500 |
| Lamp 1 A burn hours | 1.9769 |
| Lamp 3 A burn hours | 1.6964 |
| DAQ_Program_Version | 0 |
| File Format Version | 2 |
| DAQ_Computer: Vaux(60,:) | EOS EQUIP 13 |
| DAQ_Program_Name: Vaux(61,:) | SQM Monitor_2.0.vi |
|
All Devices Under Test in the DUT column in DATA: DUT_White_Fiducial DUT_Net_CAS_Lu DUT_VXR |
|
ASCII SQM file data: SQM_20170322_002.txt
ASCII SQM file data: PDF log file
| Lamp | On/Off # | N | Time on (hrs) | Mean (meas./set) | std | %std |
|---|---|---|---|---|---|---|
| Lamp 1A | 1 | 297 | 0.86417 | 0.94997 / 0.95 | 0.00011196 | 0.011786 |
| Lamp 1A | 2 | 349 | 1.0161 | 0.94999 / 0.95 | 0.00010582 | 0.011139 |
| Lamp 3A | 1 | 540 | 1.5739 | 3 / 3 | 0.00057358 | 0.019119 |
| Level | PD internal monitor (V) | Level Change # | Mean | std | %std |
|---|---|---|---|---|---|
| Low (1A) | Red | 1 | 0.27041 | 0.085554 | 31.6389 |
| Low (1A) | White | 1 | 0.26208 | 0.081572 | 32.6446 |
| Low (1A) | Blue | 1 | 0.22074 | 0.045031 | 38.7585 |
| Medium (3A) | Red | 3 | 1.3339 | 0.012262 | 0.91926 |
| Medium (3A) | White | 3 | 1.4657 | 0.011681 | 0.83661 |
| Medium (3A) | Blue | 3 | 1.4276 | 0.011029 | 0.85894 |
| High (1A & 3A) | Red | 4 | 1.5187 | 0.12811 | 8.4355 |
| High (1A & 3A) | White | 4 | 1.6453 | 0.14561 | 7.7866 |
| High (1A & 3A) | Blue | 4 | 1.5745 | 0.11187 | 8.1365 |
| Level | Temperature (C) | Level Change # | Mean | std | %std |
|---|---|---|---|---|---|
| Low (1A) | PD | 1 | 34.988 | 0.12428 | 0.35521 |
| Medium (3A) | PD | 3 | 34.9668 | 0.11403 | 0.3261 |
| High (1A & 3A) | PD | 4 | 34.9638 | 0.1117 | 0.31948 |
Red PD (max value): 2.3895: #of possible satureated values 0
White PD (max value): 1.8605: #of possible satureated values 0
Blue PD (max value): 2.4997: #of possible satureated values 0
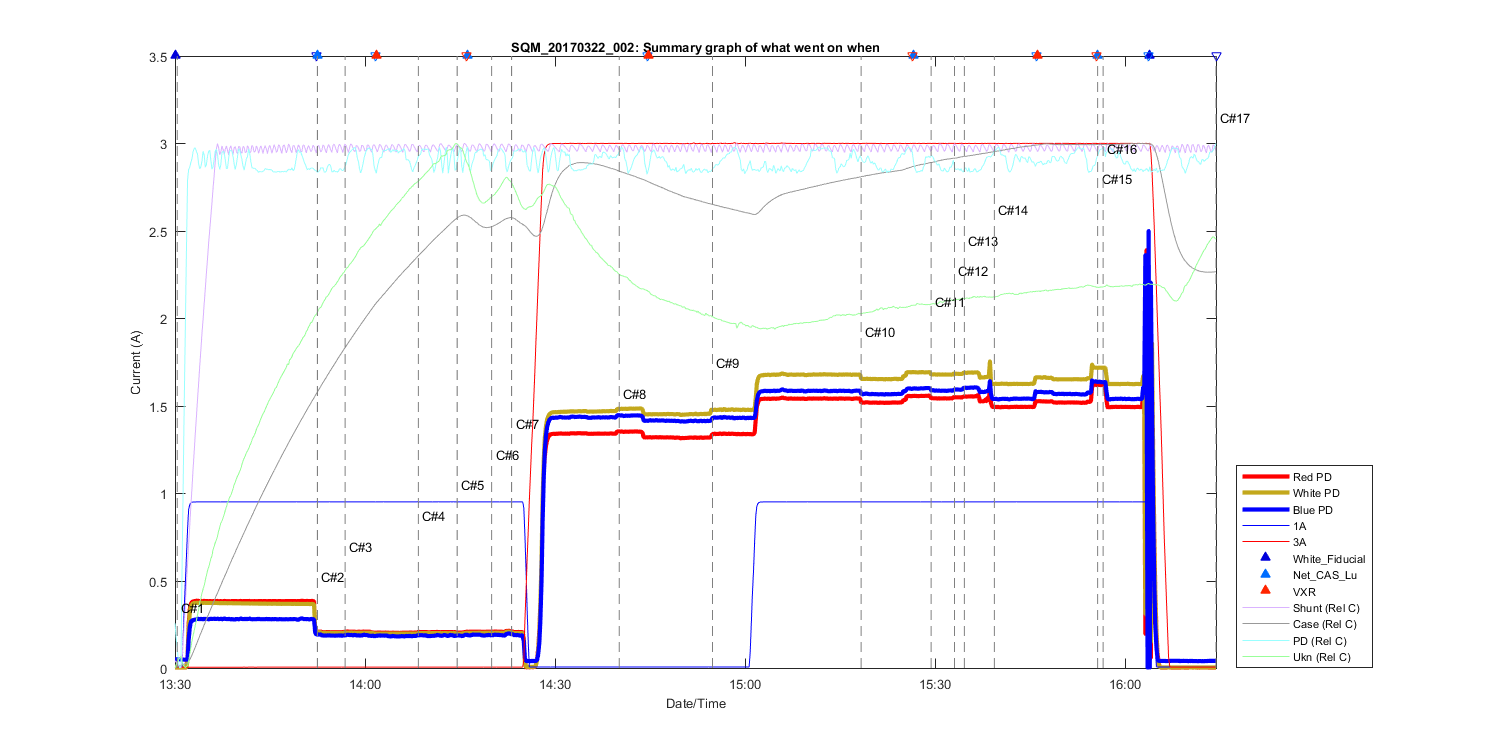
Figure 1
Summary Graph showing all measurements taken in this file, including auxilliary temperature measurements and comments. The text C# shows what time in the file the comments (shown above where made). The triangles at the top of the figure shows then a DUT (Device under test) was placed in front of the SQM and removed.
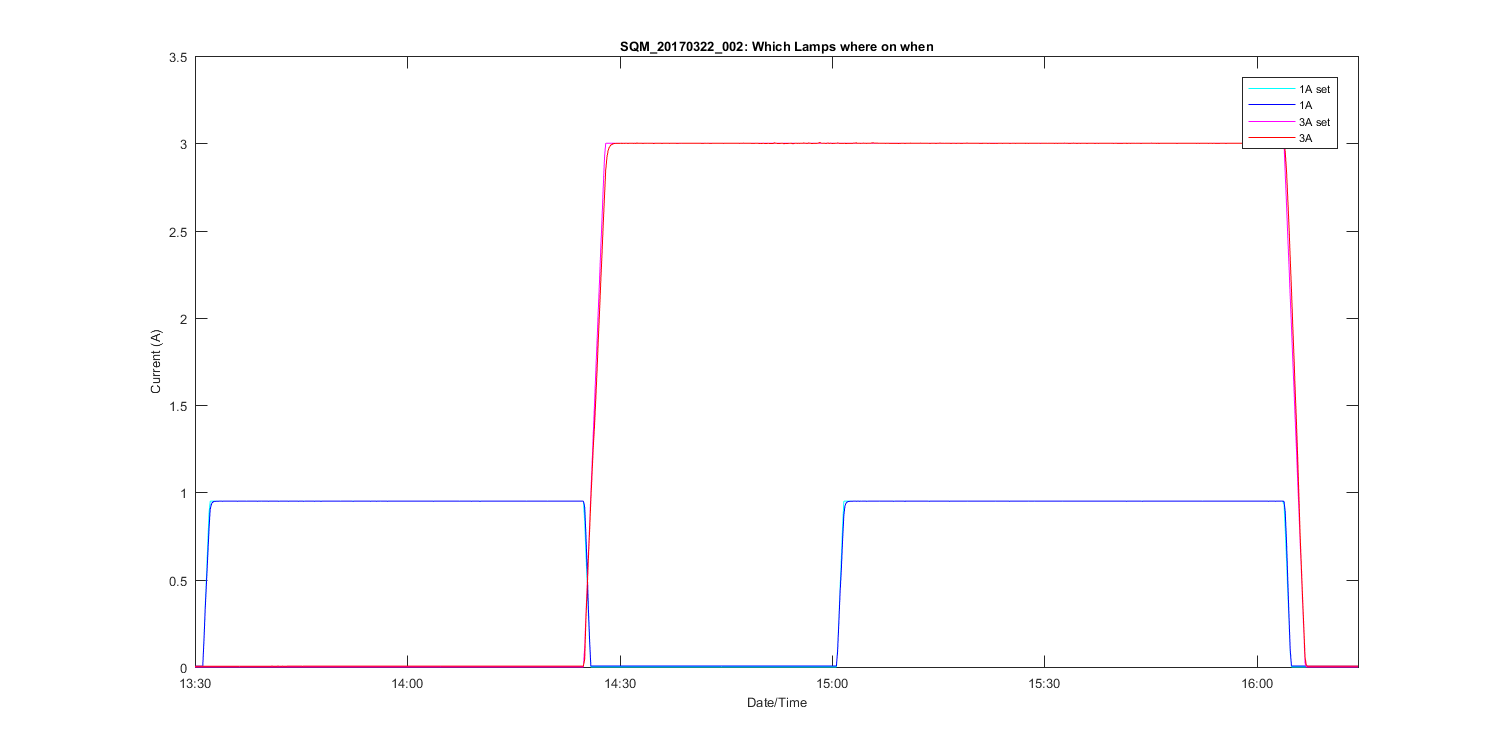
Figure 2
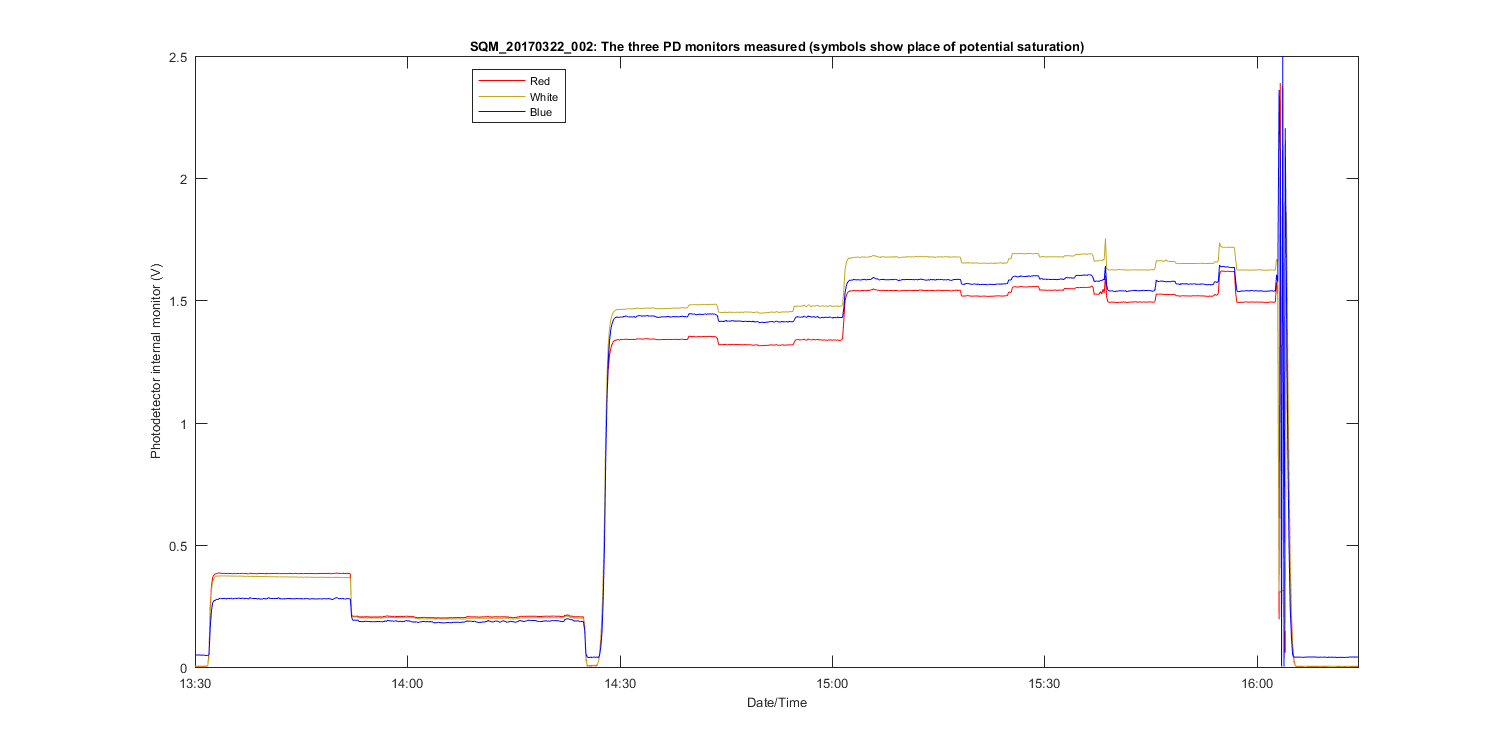
Figure 3
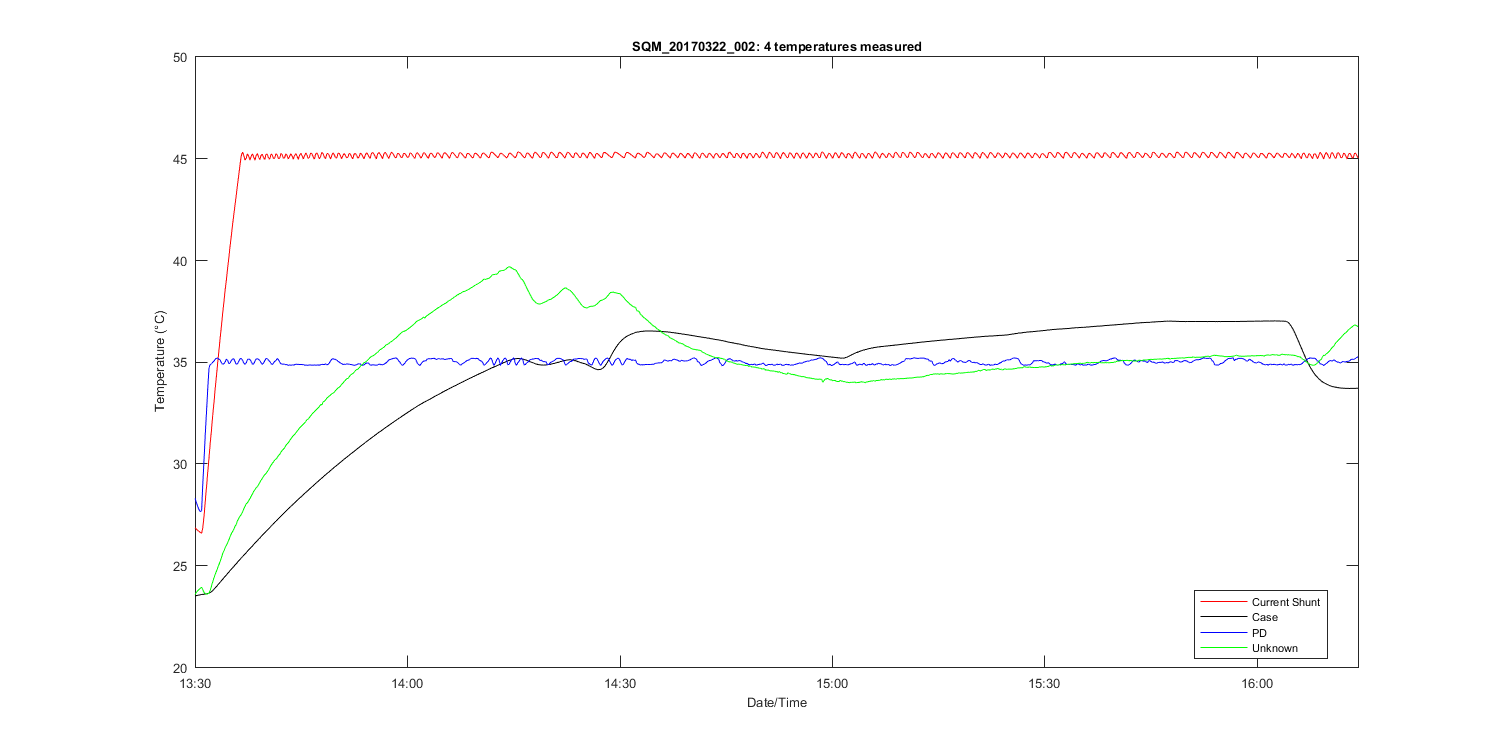
Figure 4
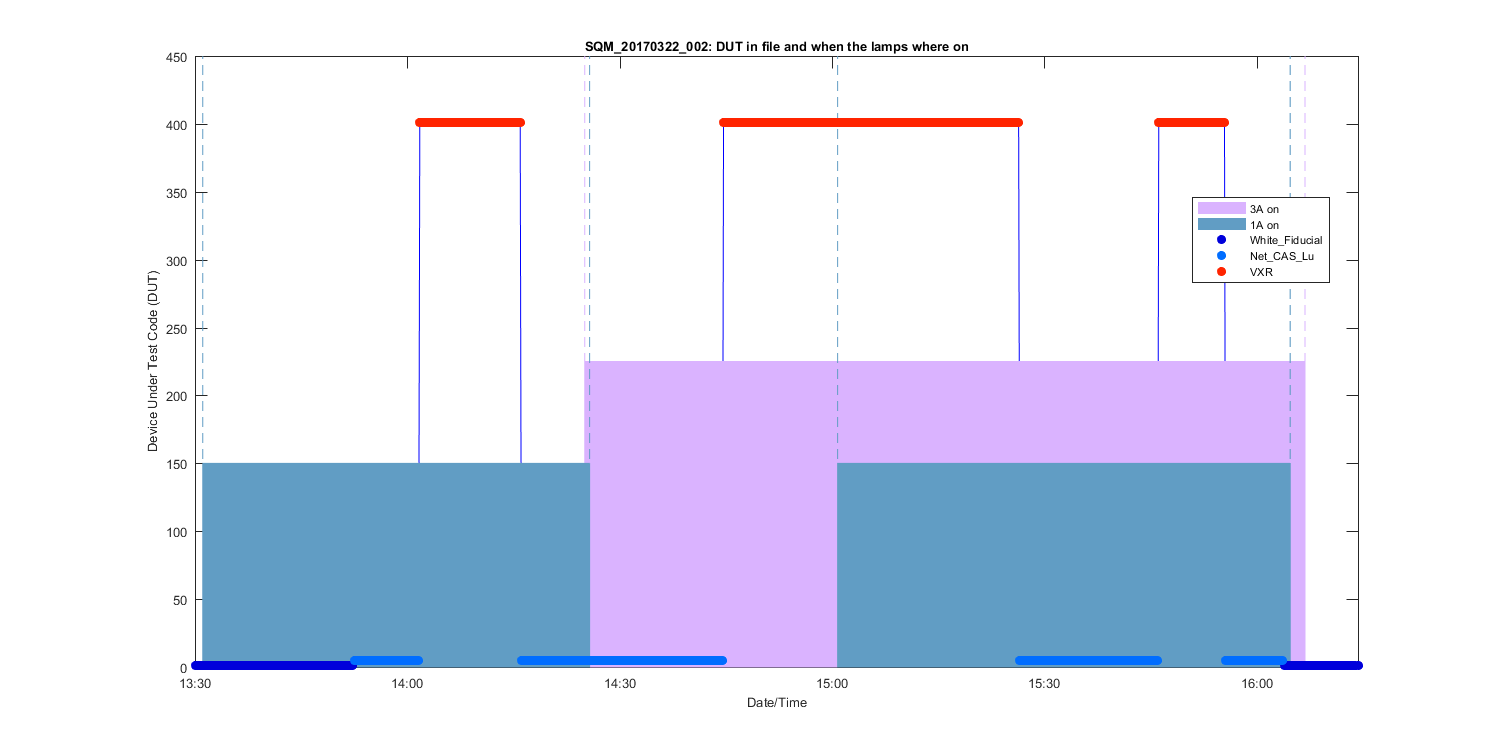
Figure 5
Figure 6
Figure 7
Figure 8
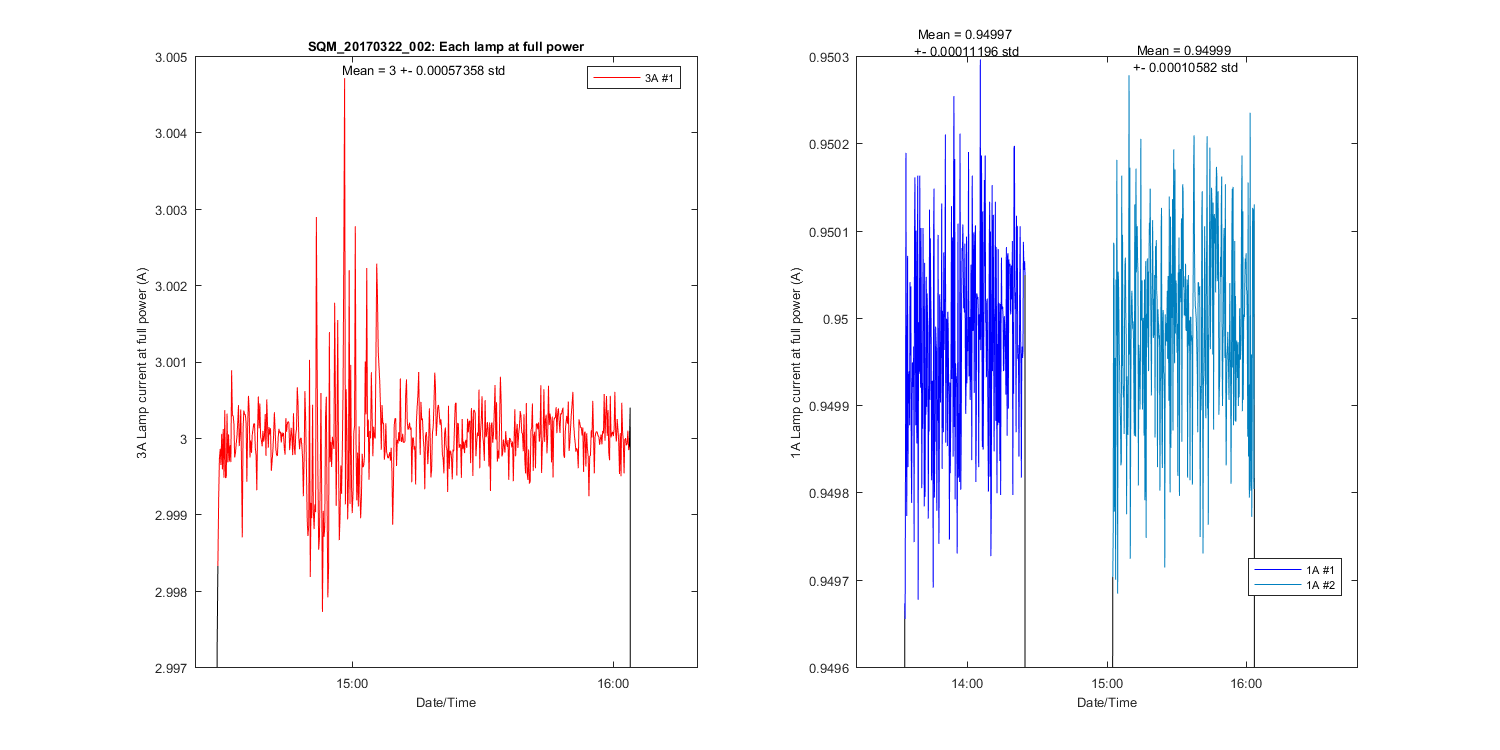
Figure 9
Figure 10